ORIGINAL ARTICLE
CITE AS: Bandeira, A.M.P.; Gomes, V.V.; Vasconcelos, A.A.; Taube, P.S.; de Barros, E.C.; Costa, S.C.; Lima, A.K.O.; Boligon, A.A.; Waczuk, E.P.; Rocha, J.B.T.
2018. Antioxidant activity and physicochemical characteristics of honeys from the eastern Amazon region, Brazil. Acta Amazonica 48: 158-167
Antioxidant activity and physicochemical characteristics
of honeys from the eastern Amazon region, Brazil
Adelene Menezes Portela BANDEIRA1, Victor Valentim GOMES1, Arthur Abinader VASCONCELOS1,
Paulo Sérgio TAUBE1*, Emerson Cristi de BARROS1, Samuel Carvalho COSTA1, Alan Kelbis Oliveira LIMA1,
Aline Augusti BOLIGON2, Emily Pansera WACZUK3, João Batista Teixeira ROCHA3
1 Instituto de Biodiversidade e Florestas, Universidade Federal do Oeste do Pará, Santarém, CEP 68005-100, Brasil
2 Laboratório de Pesquisa Fitoquímica, Departamento de Farmácia, Universidade Federal de Santa Maria, Prédio 26, Sala 1115, Santa Maria, CEP 97105-900, Brasil 3 Laboratório de Pesquisa Bioquímica, Toxicológica, Farmacológica e Organocalcogênios, Departamento de Bioquímica e Biologia Celular, Universidade Federal de
Santa Maria, Prédio 18, Santa Maria, CEP 97105-900, Brasil * Corresponding author: [email protected]
ABSTRACT
Honey is a natural product that has several beneficial properties for health, such as anti-inflammatory, antioxidant and antimicrobial activities, which depend on its composition. In this context, physicochemical properties (colour, pH, ash, moisture, sugars, and total phenolic contents) and antioxidant activity (DPPH radical scavenging ability) of Apis mellifera honeys from Santarém, the main honey production area in the eastern Amazon region, were evaluated. Most samples were dark in colour and acidic. The ash and moisture contents ranged from 0.112 to 0.318 and from 14.751 to 17.514, respectively. The reducing sugars content was 62.873–91.563%. The total amount of phenolic compounds was higher than normally reported, ranging between 15.22 and 16.51 mg g−1 and 17.70 and 18.94 mg g−1, for honey after and before exposure to light, respectively.
Quercetin was found only in honey that had been protected from light, with values ranging from 0.24 to 0.43 mg g-1. The
absence of quercetin in the samples of honey exposed to light suggests that UV radiation has degraded this compound. All samples presented maximum radical scavenging capacity close to 50%. Our results showed inverse correlations between the colour and pH, ash, reducing sugars, and moisture content, and positive correlations between the colour and the concentration of phenolic compounds, and antioxidant activity.
KEYWORDS:Apis mellifera, quercetin, DPPH radical, flavonoids
Atividade antioxidante e características físico-químicas de méis da
Amazônia Oriental, Brasil
RESUMO
O mel é um produto natural que apresenta várias propriedades benéficas para a saúde, tais como atividade antinflamatória, antioxidante e antimicrobiana, as quais dependem de sua composição. Neste contexto, as propriedades físico-químicas (cor, pH, conteúdo de cinzas, umidade, açúcares e compostos fenólicos totais) e a atividade antioxidadente (capacidade de remoção do radical DPPH) de méis de abelhas Apis mellifera de Santarém, na principal região de produção de mel na Amazônia Oriental, Brasil, foram avaliadas. A maioria das amostras teve cor escura e apresentaram-se ácidas. Os teores de cinzas e a umidade variaram de 0,112 a 0,318 e de 14,751 a 17,514, respectivamente. O teor de açúcares redutores vairou entre 62,873 e 91,563%. O teor total de compostos fenólicos foi mais elevado que os já reportados na literatura, variando entre 15,22 e 16,51 mg g−1 e
17,70 e 18,94 mg g−1 para amostras de mel protegidas e expostas à radiação UV, respectivamente. A quercetina foi encontrada
apenas no mel que foi protegido da luz, com teores variando entre 0,24 e 0,43 mg g−1. A ausência de quercetina nas amostras
de mel expostos à luz sugere que a radiação UV pode ter degradado esse composto. Todas as amostras apresentaram máxima capacidade de remover o radical DPPH próxima a 50%. Houve correlação inversa entre a cor e o pH, cinzas, açúcares redutores e teor de umidade, e correlação positiva entre a cor e o teor de composto fenólicos e a atividade antioxidante.
INTRODUCTION
According to the Codex Alimentarius (2001), honey is a sweet and viscous substance having a characteristic but variable odour, which is produced by bees from the nectar of flowers (floral honey) or induced as plant secretions by the action of sucking insects (melato honey). Regulatory bodies in the USA and Brazil define honey as a product from a specific species of bee, Apis mellifera L. (FAO 2015). Honey is a rich source of carbohydrates for humans, and also provides a great variety of minor nutrients such as proteins, minerals, and vitamins. Honey has been part of human diet for centuries, and has found increasing medicinal use due its antibiotic, anti-caries, anti-inflammatory and other properties (Abadio Finco et al. 2010), as well as a supplementary natural food free of synthetic substances. Therefore, it is important to determine the overall composition of honey in order to prove its efficiency as a complete natural food.
The composition of the honey can be evaluated by physicochemical and sensory analyses. Flavour and quality parameters have been used to discriminate between monofloral and polyfloral honeys, as have the identification and counting of pollen grains (Escuredo et al. 2012), but these methods can generate ambiguous results. Therefore, the most-commonly reported parameters to characterize the physicochemical properties of honey are the pH, sugar content, electrical conductivity, enzymatic activity, and water content (Abadio Finco et al. 2010). Other parameters include the colour, speed of crystallization (related to glucose content), and hygroscopicity (related to fructose content) (Venir et al. 2010). Finally, instrumental analytical techniques can be used for compositional analysis; these include high performance liquid chromatography (HPLC), thermal analysis, and molecular and atomic spectroscopic methods (Pulcini et al. 2006).
HPLC has been an important analytical tool in studies involving the determination of the phenolic, flavonoid, and other antioxidant compounds in honeys. This compositional determination is relevant because honey can contain a number of compounds that are also detected in many fresh fruits and vegetables (Gheldof et al. 2002). The presence of this great variety of components characterizes honey as a functional food. For example, the polyphenolic and flavonoid components may contribute to the prevention of cardiovascular diseases (Abadio Finco et al. 2010). The use of honey as an alternative health treatment, known as “apitherapy”, can be associated with beneficial flavonoid-mediated activities (Vit et al. 2008). These and other salutary honey properties are related mainly to the presence of phenolic acids and flavonoids, but also depend on minor constituents such as polyphenols and other phytochemicals, ascorbic acid, amino acids, proteins, vitamins, and essential metals (Silva et al. 2016).
The amount and distribution of phenolic compounds reflect directly on the colour, sensory features, and antioxidant
activity of the honey (Silva et al. 2016). The phenolic content depends on the botanical and geographical origin of the flowers from which the bees collected the nectar (Escuredo et al. 2014). Several studies have attempted to discern the origin of botanical honey, or pure from adulterated honey, using multivariate analysis with spectroscopic data, mainly on FT-IR and Raman techniques (Gok et al. 2015; Corvucci et al. 2015). Natural and artificial honeys are discriminated through the analysis of parameters such as antioxidant activity, pH, colour, and bioactive compounds determined by chemometrics tools (Sant’Ana et al.
2012). Several authors have determined the bioactive compounds in honey through HPLC with diode array detection (HPLC-DAD) (Escuredo et al. 2012; Hayes et al. 2014; Karabagias et al. 2014), but did not make an integrated analysis of the data using multivariate analysis. Thus, the combination of HPLC and multivariate analysis represents an improved way of interpreting the analytical parameters of honey.
Although a number of studies have attempted to classify honeys from some countries such as Italy, Spain and Greek based on their physicochemical parameters and chemical compositions (Pulcini et al. 2006; Escuredo et al. 2012; Karabagias et al. 2014), little work has been carried out with Amazonian honeys.
Beekeeping is very promising in the northern region of Brazil, although it has been maintained as a secondary subsistence activity by most producers (Costa 2009). Santarém is the largest city in the western state of Pará, in the eastern Brazilian Amazon, and is an economic pole for the surrounding municipalities. In the municipality of Santarém honey is the fourth most commercialized natural product, one of the reasons being its use as a popular therapeutic alternative (Gonçalves et al. 2012).
In this context, the aim of this study was to characterize
A. mellifera honeys of Santarém. We analyzed the physicochemical properties and antioxidant activity of honeys from different apiaries. The major phenolic compounds of the honey samples were determined by HPLC-DAD and those compounds were compared in honey stored exposed and protected from UV radiation.
MATERIALS AND METHODS
Honey samples
Soon after the collection, each sample was divided into two sub-samples packed into polyethylene Falcon tubes, one of them exposed to ambient light and the other wrapped in aluminum foil and kept protected from UV radiation. The samples were stored during three months under room temperature (20 to 30 °C) until analysis.
Physicochemical characteristics
The colour of each honey sample was measured according to a modified Pfund classifier (Belay et al. 2015). The honey samples were diluted to 50% (v/v) with deionized water and the resulting solutions were filtered. The absorbance was measured at 635 nm using a Nova 3300 spectrophotometer (Nova Instruments, Piracicaba, Brazil). Measurements were
performed in triplicate for each sample and the quantitative mm Pfund scale was transformed into a qualitative colour value using the approved colour standards of the United States Department of Agriculture (USDA 1985).
The pH, ash and moisture contents of the honeys were measured according to the AOAC method (Horwitz and Latimer 2006) with some modifications. The pH was determined for a sample (10 g) diluted in deionized water (90 mL) using a pH meter (model mPA-210, MS Tecnopon, Piracicaba, Brazil). For ash content a sample (~2 g) was weighed into an ash crucible and dried in an oven at 100 °C for 4 h. After cooling, the ensemble was weighed, incinerated at 600 °C in a muffle furnace for 3 h,
Figure 1.Map depicting the locations of sampled apiaries in the municipality of Santarem, state of Pará, northern Brazil, in the eastern Amazon region. This figure is in colour in the electronic version.
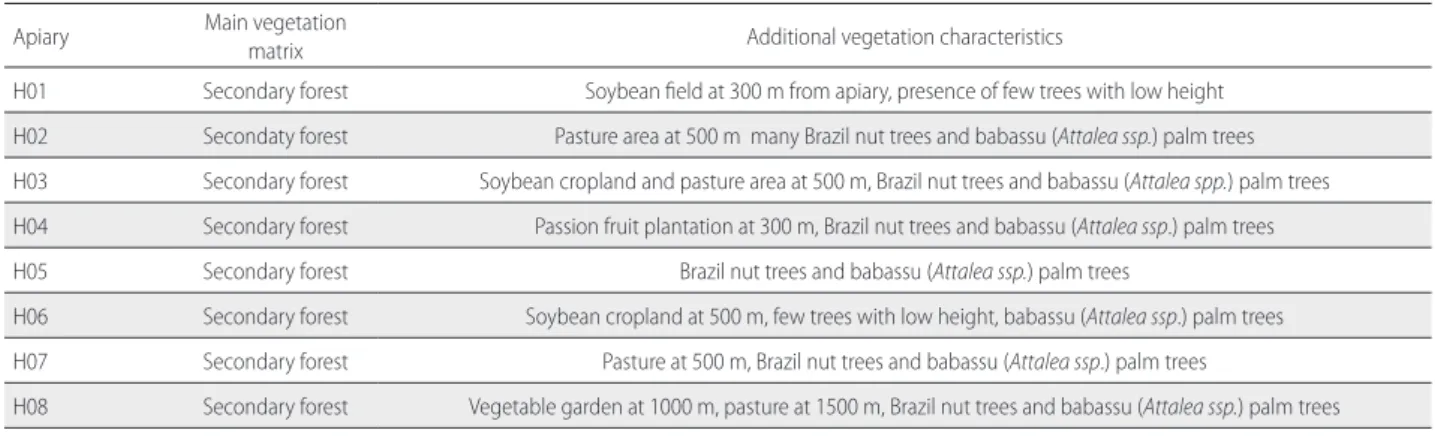
Table 1. Descriptive characteristics of the surrounding area of each apiary sampled for Apis mellifera honey in Santarém (Pará, Brazil). Apiaries are identified by their location codes in Figure 1.
Apiary Main vegetation
matrix Additional vegetation characteristics
H01 Secondary forest Soybean field at 300 m from apiary, presence of few trees with low height H02 Secondaty forest Pasture area at 500 m many Brazil nut trees and babassu (Attalea ssp.) palm trees H03 Secondary forest Soybean cropland and pasture area at 500 m, Brazil nut trees and babassu (Attalea spp.) palm trees H04 Secondary forest Passion fruit plantation at 300 m, Brazil nut trees and babassu (Attalea ssp.) palm trees H05 Secondary forest Brazil nut trees and babassu (Attalea ssp.) palm trees
H06 Secondary forest Soybean cropland at 500 m, few trees with low height, babassu (Attalea ssp.) palm trees H07 Secondary forest Pasture at 500 m, Brazil nut trees and babassu (Attalea ssp.) palm trees
and then reweighed. The ash content was then calculated by subtracting the difference between the initial and post-combustion weights. For the moisture content a sample (~2.5 g) was weighed and heated in an oven at 60 °C until a constant weight was obtained. The moisture content was calculated by subtracting the difference between the initial and post-heating weights (Horwitz and Latimer 2006).
The reducing sugar content analysis was performed using a glucose liquiform solution (2.0 mL, Merck, Darmstadt, Germany) and honey solution (200 μL, 1:2500, v/v). The solutions were mixed, let stand for 30 min at room temperature, and then the absorbance was measured at 555 nm using a Nova 3300 spectrophotometer (Nova Instruments, Piracicaba, Brazil). A five-point calibration curve was obtained using standard glucose solutions with the following concentrations: 0.00, 0.25, 0.50, 0.75, and 1.00 μg mL−1.
HPLC analysis
All chemicals were analytical grade. Methanol, phosphoric acid, gallic acid, caffeic acid, chlorogenic acid, rosmarinic acid, and p-coumaric acid were purchased from Merck (Darmstadt, Germany). Quercetin, kaempferol, apigenin, and chrysin were acquired from Sigma Chemical Co. (St. Louis, MO, USA). HPLC-DAD was performed with a Shimadzu Prominence Autosampler (SIL-20A) HPLC system (Shimadzu, Kyoto, Japan), equipped with Shimadzu LC-20AT reciprocating pumps connected to a DGU 20A5 degasser with a CBM 20A integrator, SPD-M20A diode array detector, and LC solution 1.22 SP1 software. The samples were immediately separated into two fractions upon collection that were either protected from or exposed to ambient light.
HPLC was performed using a Phenomenex C18
analytical column (4.6 mm × 250 mm, 5 μm particle size). Gradients were generated using 0.05% phosphoric acid in water (A) and methanol (B), starting at 95% A; decreasing to 85% A in 10 min, to 70% A in 5 min, to 60% A in 5 min, to 55% A in 10 min, to 40% A in 20 min, and to 20% A in 2 min; and holding for 8 min (Gheldof et al. 2002). The flow rate was 0.6 mL min−1 and the injection volume was
40 μL. The honey samples were prepared as dilute solutions in methanol/water (1:5, v/v) and were filtered prior to use. Stock solutions of standards were prepared in the HPLC mobile phase mixture at concentrations of 0.050–0.500 mg mL−1. Quantification was based on integration of the
peaks using the external standard method, at 254 nm for gallic acid; 327 nm for chlorogenic, caffeic, p-coumaric, and rosmarinic acids; and 366 nm for quercetin, chrysin, apigenin, and kaempferol. The identities of the analytes were confirmed by comparing their retention times with those of the reference standards and their DAD spectra (200 to 500 nm). The calibration curve for each standard is described as follows: gallic acid: Y = 11967x + 1305.9 (r
= 0.9998); chlorogenic acid: Y = 12549x + 1184.2 (r = 0.9995); caffeic acid: Y = 12527x + 1419.3 (r = 0.9999); p-coumaric acid: Y = 13546x + 1093.6 (r = 0.9997); rosmarinic acid: Y = 13067x + 1273.5 (r = 0.9998); chrysin: Y = 11863x + 1127.1 (r = 0.9999); quercetin: Y = 14053x + 1182.3 (r = 0.9994); kaempferol: Y = 13713x + 1258.0 (r = 0.9998); and apigenin: Y = 12357x + 1087.3 (r = 0.9996). All chromatography operations were carried out in triplicate at ambient temperature. The limit of detection (LOD) and limit of quantitation (LOQ) values were calculated based on the standard deviation of the responses and the slope using three independent analytical curves, as defined by Boligon et al. (2015). The LOD and LOQ were calculated as 3.3 and 10
σ/S, respectively, where σ is the standard deviation of the response and S is the slope of the calibration curve.
DPPH free radical scavenging activity
The antioxidant activity of the honeys was tested for DPPH radicals. The assay is a very useful parameter for correlating the phenolic compound content with the antioxidant properties of biological samples. The free radical scavenging activity of the honeys was determined with 1,1-diphenyl-2-picrylhydrazyl (DPPH) (Fluka, Steinheim, Germany) using the method of Escriche et al. (2014) with some modification.
Honey samples (50 μL; 0.12, 0.36, and 0.60 mg) were dissolved in ethanol (200 μL) and mixed with a solution of DPPH in methanol (25 μL, 1.2 mM). For the blank samples, solutions of honey (50 μL; 0.12, 0.36 and 0.60 mg) in ethanol (225 μL) were prepared.
The mixtures were left for 30 min at room temperature; then, the absorbance was measured at 555 nm in an ELISA plate reader. The ability of the honey samples to scavenge DPPH radicals, given by the SADPPH∙value, was calculated using the following equation:
where A0 and Ax are the absorbance of the blank and the sample, respectively.
The antioxidant activity was determined against a standard curve for α-tocopherol (vitamin E, 0–2.50 mg L−1, R2 = 0.992),
and the results were expressed in α-tocopherol equivalents antioxidant (mgTEA.100 g−1).
Statistical analysis
RESULTS
Antioxidant activity was expressed as DPPH inhibition (%) against a blank control. All honey samples had a maximum DPPH radical quenching capacity close to 50%. The maximum inhibitory activity for undiluted honey ranged from 49.394 to 61.061% (Table 2).
Nine phenolic compounds were identified: five phenolic acids (gallic acid, average retention time (tR) = 11.83 min; chlorogenic acid, tR = 18.37 min; caffeic acid, tR = 23.96 min; p-coumaric acid, tR = 34.78 min, and rosmarinic acid, tR = 44.15 min), and four flavonoids (quercetin, tR = 50.11 min; kaempferol, tR = 54.83 min, apigenin, tR = 60.14 min, and chrysin, tR = 67.32 min) (Figure 2). The total amount of phenolic compounds ranged between 15.22 and 16.51 mg g−1, and 17.70 and 18.94
mg g−1 for honeys that were exposed to and protected from light,
respectively (Table 3).
Phenolic acids were the most abundant phenolic derivatives in all samples. In the honey exposed to light the contribution, in descending order, was of p-coumaric acid, gallic acid, apigenin, and chrysin (Table 3). In the honey protected from light, the relative abundance of phenolic acid compounds varied, in decreasing order, from chrysin, p-coumaric acid, apigenin, kaempferol, caffeic acid, to gallic acid (Table 3). It is important to note that the presence of quercetin, in amounts above the detection level of the method, was observed only when the honey samples were not exposed to light (Table 3).
Statistical analysis
The honey’s colour was negatively correlated with pH, ash, reducing sugars, and moisture contents, and positively correlated with the total phenolic compounds and antioxidant activity (Table 4). The low correlations between the colour and antioxidant activity and, between ashes and moisture
Figure 2. Representative chromatograms of one honey sample (H01) from Santarém (Pará, Brazil) exposed to light (A) and protected from light (B). The peaks are indicated as follows: 1 - gallic acid; 2 - chlorogenic acid; 3 - caffeic acid; 4 -p-coumaric acid; 5 - rosmarinic acid; 6 - quercetin, 7 - kaempferol; 8 - apigenin; and 9 - chrysin.
Table 2. Physicochemical parameters and maximum antioxidant activity (results are expressed as the mean ± standard deviation) of honeys samples from Santarém (Pará, Brazil) exposed to UV radiation. Apiaries are identified by their location codes in Figure 1.
Parameters H01 H02 H03 H04 H05 H06 H07 H08
Colour Dark amber Dark amber Amber Dark amber Light amber Amber Light amber Amber
pH 3.653±0.064b 3.686±0.114ab 3.869±0.154ab 3.800±0.071ab 4.264±0.321ab 4.016±0.149ab 4.073±0.187ab 4.316±0.443a
Ash (%) 0.147±0.036a 0.112±0.013a 0.168±0.061a 0.190±0.056a 0.318±0.043a 0.181±0.076a 0.224±0.111a 0.260±0.096a
Moisture (%) 15.401±0.020bc 14.751±0.316c 16.057±0.124abc 16.470±0.402abc 15.526±0.767bc 16.498±0.200abc 16.986±0.615ab 17.514±0.761a
Reducing sugars
(%) 80.936±2.233
abcd 64.274±1.380bcd 62.002±1.070cd 88.570±2.993a 60.866±2.007d 84.582±1.225abc 85.800±1.416ab 79.435±2.176abcd
Antioxidant
activity (%) 61.061±1.481
ab 57.055±2.992abc 50.518±2.992c 58.672±1.647abc 61.624±0.760a 51.212±1.097c 49.183±2.642C 54.795±0.609bc
Antioxidant activity (mgTEA.100 g-1)1
were supported by Pearson coefficients of 0.409 and 0.445, respectively. Colour also had a low positive correlation with total phenolic compounds (0.122).
The pH exhibited high and moderate positive correlations with the ash (0.903) and moisture (0.620) levels, respectively. The reducing sugars had a moderate positive correlation only with the moisture content (0.597).
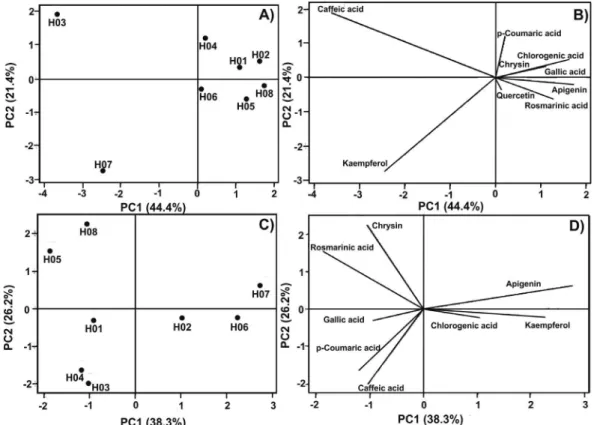
In both PCA analyses the first two axes (PC1 and PC2) explained around 65% of the variance in the data (Figure 3). Honey samples protected from light had a more homogeneus composition, except H03 and H07, which had divergent values of caffeic acid and kaempferol, respectively (Figure 3a,b), while samples exposed to light tended to disperse in the multivariate space, with main loads associated to different bioactive compounds (Figure 3c,d).
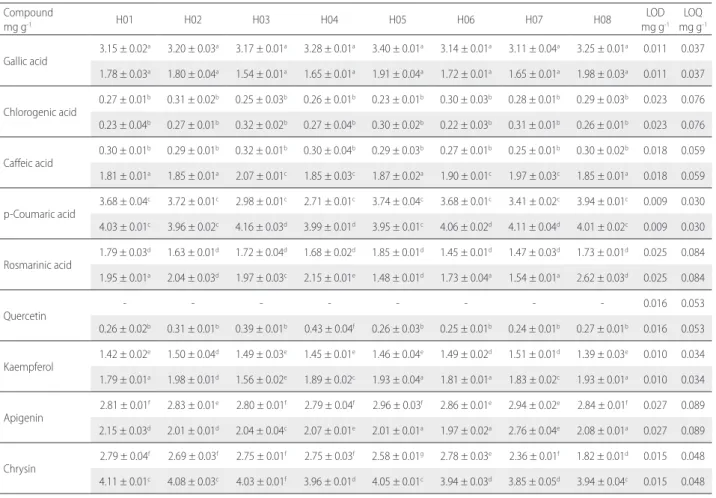
Table 3. Phenolic acid and flavonoid contents (results are expressed as the mean ± standard deviation) of honeys samples from Santarém (Pará, Brazil) exposed and protected from light. Apiaries are identified by their location codes in Figure 1. LOD = limit of detection, LOQ = limit of quantification. Unshaded lines present values for samples exposed to light; shaded lines present values for samples exposed to light.
Compound
mg g-1 H01 H02 H03 H04 H05 H06 H07 H08
LOD mg g-1
LOQ mg g-1
Gallic acid
3.15 ± 0.02a 3.20 ± 0.03a 3.17 ± 0.01a 3.28 ± 0.01a 3.40 ± 0.01a 3.14 ± 0.01a 3.11 ± 0.04a 3.25 ± 0.01a 0.011 0.037
1.78 ± 0.03a 1.80 ± 0.04a 1.54 ± 0.01a 1.65 ± 0.01a 1.91 ± 0.04a 1.72 ± 0.01a 1.65 ± 0.01a 1.98 ± 0.03a 0.011 0.037
Chlorogenic acid
0.27 ± 0.01b 0.31 ± 0.02b 0.25 ± 0.03b 0.26 ± 0.01b 0.23 ± 0.01b 0.30 ± 0.03b 0.28 ± 0.01b 0.29 ± 0.03b 0.023 0.076
0.23 ± 0.04b 0.27 ± 0.01b 0.32 ± 0.02b 0.27 ± 0.04b 0.30 ± 0.02b 0.22 ± 0.03b 0.31 ± 0.01b 0.26 ± 0.01b 0.023 0.076
Caffeic acid
0.30 ± 0.01b 0.29 ± 0.01b 0.32 ± 0.01b 0.30 ± 0.04b 0.29 ± 0.03b 0.27 ± 0.01b 0.25 ± 0.01b 0.30 ± 0.02b 0.018 0.059
1.81 ± 0.01a 1.85 ± 0.01a 2.07 ± 0.01c 1.85 ± 0.03c 1.87 ± 0.02a 1.90 ± 0.01c 1.97 ± 0.03c 1.85 ± 0.01a 0.018 0.059
p-Coumaric acid
3.68 ± 0.04c 3.72 ± 0.01c 2.98 ± 0.01c 2.71 ± 0.01c 3.74 ± 0.04c 3.68 ± 0.01c 3.41 ± 0.02c 3.94 ± 0.01c 0.009 0.030
4.03 ± 0.01c 3.96 ± 0.02c 4.16 ± 0.03d 3.99 ± 0.01d 3.95 ± 0.01c 4.06 ± 0.02d 4.11 ± 0.04d 4.01 ± 0.02c 0.009 0.030
Rosmarinic acid
1.79 ± 0.03d 1.63 ± 0.01d 1.72 ± 0.04d 1.68 ± 0.02d 1.85 ± 0.01d 1.45 ± 0.01d 1.47 ± 0.03d 1.73 ± 0.01d 0.025 0.084
1.95 ± 0.01a 2.04 ± 0.03d 1.97 ± 0.03c 2.15 ± 0.01e 1.48 ± 0.01d 1.73 ± 0.04a 1.54 ± 0.01a 2.62 ± 0.03d 0.025 0.084
Quercetin
- - - 0.016 0.053
0.26 ± 0.02b 0.31 ± 0.01b 0.39 ± 0.01b 0.43 ± 0.04f 0.26 ± 0.03b 0.25 ± 0.01b 0.24 ± 0.01b 0.27 ± 0.01b 0.016 0.053
Kaempferol
1.42 ± 0.02e 1.50 ± 0.04d 1.49 ± 0.03e 1.45 ± 0.01e 1.46 ± 0.04e 1.49 ± 0.02d 1.51 ± 0.01d 1.39 ± 0.03e 0.010 0.034
1.79 ± 0.01a 1.98 ± 0.01d 1.56 ± 0.02e 1.89 ± 0.02c 1.93 ± 0.04a 1.81 ± 0.01a 1.83 ± 0.02c 1.93 ± 0.01a 0.010 0.034
Apigenin
2.81 ± 0.01f 2.83 ± 0.01e 2.80 ± 0.01f 2.79 ± 0.04f 2.96 ± 0.03f 2.86 ± 0.01e 2.94 ± 0.02e 2.84 ± 0.01f 0.027 0.089
2.15 ± 0.03d 2.01 ± 0.01d 2.04 ± 0.04c 2.07 ± 0.01e 2.01 ± 0.01a 1.97 ± 0.02a 2.76 ± 0.04e 2.08 ± 0.01a 0.027 0.089
Chrysin
2.79 ± 0.04f 2.69 ± 0.03f 2.75 ± 0.01f 2.75 ± 0.03f 2.58 ± 0.01g 2.78 ± 0.03e 2.36 ± 0.01f 1.82 ± 0.01d 0.015 0.048
4.11 ± 0.01c 4.08 ± 0.03c 4.03 ± 0.01f 3.96 ± 0.01d 4.05 ± 0.01c 3.94 ± 0.03d 3.85 ± 0.05d 3.94 ± 0.04c 0.015 0.048
Table 4.Pearson’s correlation coefficients for total phenolic compounds and physicochemical parameters for mean values of honey samples from eight apiaries in Santarém (Pará, Brazil).
Ash Reducing sugars Colour pH Moisture Antioxidant activity
Total phenolic
compounds 0.077
e -0.523c 0.122e -0.022e -0.700c 0.569c
Ash - -0.079e -0.796b 0.903a 0.445d 0.041e
Reducing sugars - - -0.090e -0.041e 0.597c -0.244e
Colour - - - -0.828b -0.599c 0.409d
pH - - - - 0.620c -0.326d
Moisture - - - -0.665c
DISCUSSION
Physicochemical characteristics
Colour is the first attractive attribute for a commercial honey, and its intensity depends on its ash content and storage conditions (e.g. temperature, moisture) (Silva et al. 2016). Interestingly, dark honeys have stronger flavours and are more appreciated in countries such as Germany, Austria, and Switzerland (Bogdanov
et al. 2004). The variation in colour found in the honey analysed in this study was also observed by other authors and attributed to several factors. Moreti et al. (2006) evaluated 346 honey samples from six Brazilian states and found a predominant light amber colour in samples from Bahia, Tocantins, and Santa Catarina, and an extra light amber colour in samples from Piauí. The darker colours of our honeys from Santarém may be associated with the presence of high concentrations of minerals and/or carotenoids and flavonoids, which are associated with the botanical origin of the honey (Silva et al. 2016) and its antioxidant activity (Moniruzzaman et al. 2014).
All samples were acidic and within the official standard limits, which indicates that honey samples may have a longer shelf life. Lower acidity may be related to highest antimicrobial activity in the honey, because the optimum pH for growth of most microorganisms lies between 7.2 and 7.4 (Karabagias et al. 2014).
On the other hand, a low pH and low storage temperature favour the growth of fungi and reduce the shelf-life of a honey (Escriche
et al. 2014). An increased pH may also indicate adulteration of pure honey through the addition of fructose corn syrup (Ribeiro
et al. 2014). Honeys from Ceará, in northeaster Brazil, had pH between 3.40 and 5.30 (Moreti et al. 2006). The variation in pH of honeys among regions can be associated with differences in the pH of the nectar of the plants visited by bees in different regions, as well as to variations in the pH of soil, temperature and rainfall, all of which can affect the concentration of different acids and ash content of the honey (Gheldof et al. 2002).
The ash content is an indirect measure of the mineral content of the honey and is related to environmental pollution and the botanical and geographical origin of the honey (Karabagias et al. 2014; Silva et al. 2016). The ash content in our samples was similar to that found in other regions of Brazil (Marchini et al. 2004; Silva et al. 2004; Evangelista-Rodrigues et al. 2005; Araújo et al. 2006; Moreti et al. 2009) and could be related to the generally low nutrient content in Amazonian soils (Sombroek 1966).
The moisture content in the honey samples from Santarém did not exceed 20%, which could prolong the honey’s shelf-life (Codex Alimentarius 2001). Moisture levels of the honey can vary with ambient humidity along seasonal patterns (specially
in regions with rainy and dry seasons), as well as with processing and/or storage conditions (Karabagias et al. 2014).
The most abundant sugars in honey are the monosaccharides fructose and glucose, which comprise, respectively, about 39 and 31% of honey weight, with a small contribution from complex sugars. Generally the fructose/glucose ratio is around 1.2, but is influenced by many factors (Escuredo et al. 2014). The Brazilian Ministry of Agriculture, Livestock, and Supply established minimum reducing sugar contents of 65% and 60% (w/w), respectively, for floral and melato honeys (Brazil 2001). Only our samples H03 and H05 presented levels below this value. Differences in the reducing sugars content may have been associated with the diferent botanical origin and premature harvesting of the honey, so that sucrose was not totally dissociated in glucose and fructose by the action of the enzyme invertase (Vargas 2006; Ajlouni and Sujirapinyokul 2009).
HPLC and antioxidant analysis
In addition to sugars, honey contains enzymes and polyphenols such as caffeic acid, ferulic acid, benzoic acid, gallic acid, quercetin, luteolin, chrysin, myricetin, pinocembrim, and kaempferol (Silva et al. 2013). The total amount and distribution of phenolic compounds depend on the botanical origin and geographic origin of the honey (Karabagias et al. 2014). Phenolic compounds are non-specific markers that can be found in honeys produced from plants of different botanical families (Silva et al. 2016). Other studies have also found higher amounts of polyphenols than flavonoids in honey samples (Khalil et al. 2012; Oliveira et al. 2012; Moniruzzaman et al. 2014).
High phenolic content (in the 17-66 mg g−1 range) was
also found in honey produced by native Melipona (Michmelia) seminigra merrillae (Silva et al. 2013). Honey produced from chestnut (Castanea sp.) has a content of total phenolic compounds about 5.60 mg g-1 (Pulcini et al. 2006), which is consistent with
the concentration of phenolic compounds we found in the honey from Santarém. Our sampled apiaries were located within bee flying distance of a number of Brazil nut (Bertholletia excelsa) trees (see Figure 1 and Table 1), and the main pollinators of Brazil nut are medium to large bee species (Tonini 2011). The honey from our samples was produced during the period of flowering of Brazil nut trees (mainly from December to May, but also extending over other months; Rathcke and Lacey 1985). It is thus possible that Brazil nut has the same effect on phenolic compound content of honeys as chestnut.
The decrease in the flavonoid content in the light-exposed honey samples may be associated with their oxidation and degradation, as these compounds are susceptible to oxidation due to their large number of conjugated double bonds (Meléndez-Martínez et al. 2004). Some samples of chestnut honey analysed by Bertoncelj et al. (2011) did not contain quercetin, although others did; however, no information about protection from light was relayed in their report. It is possible that quercetin would be degraded in honeys exposed to light, since UV radiation
can interact with quercetin (Meléndez-Martínez et al. 2004). Quercetin is the most abundant flavonoid consumed in the human diet, and is thought to function as a potent antioxidant (Behling et al. 2004).
The maximum inhibitory activity for undiluted honey found in this study was in agreement with Estevinho et al. (2008), who found higher values for DPPH inhibition for dark honeys (above 70%) and lower values for light honeys (below 40%).
Statistical analysis
The positive correlation of colour with phenolic compounds reflects the low contribution of these compounds to the colour of honeys, which is directly indicative of the presence of phenolic acids and flavonoids (Belay et al. 2015). Samples with different levels of phenolic compounds and flavonoids likely reflect differences in their botanical composition. For example, H05 and H07 were both classified as “light amber” honeys, but the PCA analysis indicated that they differed in their kaempferol content (Table 3, Figure 3).
Honey protected from light H06, H02 and H01 (Figure 3a,b) have contents of kaempferol, chlorogenic acid and gallic acid responsible to separate them from the others samples. The contents of kaempferol, chlorogenic acid are close each other, Which may indicate similar floral origin in those. The gallic acid content is different, and the three parameters are close to zero in PC2, showing the poor segregation capacity of this PC, therefore, the variability of those parameters is 38.3%, explained mostly by PC1. Samples H07 and H01 presented opposition in eigenvectors showed in loadings plot, this represents antagonistic relationship between these parameters to separate those samples, which may indicate different floral origin.
Likewise, samples H03, H08 and H06 were classified as light amber, but differed with respect to its caffeic acid content. On the other hand, samples H01, H02 and H04, which were classified as dark amber, were grouped in the PCA analysis for samples exposed to light in association with the loadings of p-coumaric, chlorogenic and gallic acid contents. These samples come from apiaries located close together (see Figure 1) and their floristic composition is therefore likely very similar.
Contrary to our results, other authors have reported a negative relationship between the pH and moisture content of honey, and used these variables to discern the botanical origin of the honeys (Silva et al. 2016). The ash content, which represents the fixed mineral residue of the honey, is positively and highly correlated with the pH, most likely because the mineral uptake by plants depends on acidity. The use of neural networks to discriminate the botanical origin of honeys found an 81% variation in ash content among samples (Anjos et al. 2015).
which has a direct relationship with the moisture content in food matrices (Pires et al. 2009).
In addition to the presence-absence of quercitin, the comparison of the PCA results for protected and light-exposed honey showed that the samples light-exposed to light tended to be less homogen in their phenolic and flavonoid compound composition than the samples kept in the dark. This is probably related to a stochastic effect of UV-radiation on the chemical compounds in each sample, and suggests that protecting honey from light may be a simple and cost-effective method to preserve the original chemical composition of the honey for a longer time, and should be further studied.
CONCLUSIONS
The current study showed that all the analysed honey samples from Santarém (Pará, Brazil) presented physicochemical parameters in agreement with the Codex Alimentarius (2001). In addition, all the samples contained higher amounts of total phenolic compounds than most of the studies described in the literature, as well as high antioxidant activity (above 50% for undiluted honey). The phenolic compounds present in the honey samples influenced their colour and antioxidant activity. Honey samples exposed to light did not present noticeable amounts of the flavonoid quercetin in comparison with samples protected from light-exposure. Also, light-protected samples had a more homogen chemical phenolic and flavonoid compound composition Since quercetin is an important flavonoid in the human diet, and it can be degraded by the action of UV radiation, it is recommended that the honey produced in Santarem be stored in dark containers, which will also probably preserve the overall original chemical composition of the honey for a longer time.
ACKNOWLEDGEMENTS
This work was supported by CNPQ (Conselho Nacional de Desenvolvimento Ciêntífico e Tecnológico) and CAPES (Coordenação de Aperfeiçoamento de Pessoal de Nível Superior) from Brazil.
REFERENCES
Abadio Finco, F.D.B.; Moura, L.L.; Silva I.G. 2010. Physical and
chemical properties of Apis mellifera L. honey. Ciência e Tecnologia
de Alimentos, 30: 706–712.
Ajlouni, S.; Sujirapinyokul, P. 2009. Hydroxymehtylfurfuraldehyde
and amylase contents in Australian honey. Food Chemistry, 119,
1000:1005.
Anjos, O.; Iglesias, C.; Peres, F.; Martinez, J.; Garcia, A.; Taboada, J. 2015. Neural networks applied to discriminate botanical origin of
honeys. Food Chemistry, 175: 128–135.
Araújo, D.R.; Silva, R.H.D.; Sousa, J.S. 2006. Avaliação da qualidade físico-química do mel comercializado na cidade de Crato, CE. Revista de Biologia e Ciência da Terra, 6: 51-55.
Behling, E.B.; Sendão, M.C.; Francescato, H.D.C.; Antunes, L.M.G.; Bianchi, M.L.P. 2004. Quercetin flavonoid: General aspects and
biological actions. Alimentos e Nutrição, 15: 285–292.
Belay, A.; Solomon, W.K.; Bultossa, G.; Adgaba, N.; Melaku, S. 2015. Botanical origin, colour, granulation, and sensory properties of
the Harenna forest honey, Bale, Ethiopia. Food Chemistry, 167:
213–219.
Bertoncelj, J.; Polak, T.; Kropf, U.; Korošec, M.; Golob, T. 2011. LC-DAD-ESI/MS analysis of flavonoids and abscisic acid with chemometric approach for the classification of Slovenian honey. Food Chemistry, 127: 296–302.
Bogdanov, S.; Ruoff, K.; Oddo, L.P. 2004. Physico-chemical methods
for the characterization of unifloral honeys: a review. Apidologie,
35: S4–S17.
Boligon, A.A.; Piana, M.; Kubiça, T.F.; Mario, D.N.; Dalmolin, T.V.; Bonez, P.C; et al. 2015. HPLC analysis and antimicrobial,
antimycobacterial and antiviral activities of Tabernaemontana
catharinensis A. DC. Journal of Applied Biomedicine, 13: 7–18.
Brazil Ministry of Agriculture, Livestock, and Supply. 2000. “Legislation
of bee products and derivatives,” Normative Instruction 11, Technical Regulation of Identity and Quality of Honey. (www.engetecno.com. br/port/legislacao/mel_mel_rtfiq.htm). Accessed on 12/01/2015. Codex Alimentarius Commission. 2001. Revised codex standard for honey,
Codex Standards 12-1981, Adopted in 1981, Revision 1 (1987), Revision 2 (2001). p. 1–8.
Corvucci, F.; Nobili, L.; Melucci, D.; Grillenzoni, F.V. 2015. The discrimination of honey origin using melissopalynology and Raman
spectroscopy techniques coupled with multivariate analysis. Food
Chemistry, 169: 297–304.
Costa, A.P. 2009. A interdisciplinaridade como prática educacional
tecnológica em apicultura: estudo de caso da Escola Agrotécnica Federal de Castanhal. Dissertação de Mestrado, Universidade Federal do Rio de Janeiro, Rio de Janeiro. 81p.
Escriche, I.; Kadar, M.; Juan-Borrás, M.; Domenech, E. 2014. Suitability of antioxidant capacity, flavonoids and phenolic acids for floral authentication of honey. Impact of industrial thermal treatment. Food Chemistry, 142: 135–143.
Escuredo, O.; Silva, L.R.; Valentão, P.; Seijo, M.C.; Andrade, P.B. 2012. Assessing Rubus honey value: Pollen and phenolic compounds content and antibacterial capacity. Food Chemistry, 130, 671:678. Escuredo, O.; Dobre, I.; Fernández-González, M.; Seijo, M.C. 2014.
Contribution of botanical origin and sugar composition of honeys
on the crystallization phenomenon. Food Chemistry, 149: 84–90.
Estevinho, L.; Pereira, A.P.; Moreira, L.; Dias, L.G.; Pereira, E. 2008. Antioxidant and antimicrobial effects of phenolic compounds
extracts of Northeast Portugal honey. Food and Chemical Toxicology,
46: 3774–3779.
Evangelista-Rodrigues, A.; Silva, E.M.S.; Beserra, E.M.F.; Rodrigues,
M.L. 2005. Análise físicoquímica dos méis de abelhas Apis mellifera
e Melipona scutellaris produzidos em regiões distintas no Estado da
Paraíba. Ciência Rural, 35: 1166-1171.
FAO. 2005. Food and Agriculture Organization of the United Nations -
FAOSTAT. (www.faostat.fao.org/). Accessed on 22/10/2015. Gheldof, N.; Wang, X-H.; Engeseth, N.J. 2002. Identification and
floral sources. Journal of Agriculture and Food Chemistry, 50: 5870–5877.
Gok, S.; Severcan, M.; Goormaghtigh, E.; Kandemir, I.; Severcan, F. 2015. Differentiation of Anatolian honey samples from different botanical origins by ATR-FTIR spectroscopy using multivariate
analysis. Food Chemistry, 170: 234–240.
Gonçalves, D.C.M.; Gama, J.R.V.; Oliveira, F.A.; Oliveira Junior, R.C.; Araújo, G.C.A.; Almeida, L.S. 2012. Aspectos Mercadológicos dos Produtos não Madeireiros na Economia de Santarém-Pará, Brasil. Floresta e Ambiente, 19, 9:16.
Hayes, R.; Ahmed, A.; Edge, T.; Zhang, H. 2014. Coreshell particles: Preparation, fundamentals and applications in high performance
liquid chromatography. Journal of Chromatography A, 1357, 36:52.
Horwitz, W.; Latimer Jr., G.W. 2006. Official methods of analysis of
AOAC International. 18th ed. AOAC International, Washington D.C, 3172p.
Khalil, M.I.; Moniruzzaman, M.; Boukraâ, L.; Benhanifia, M.; Islam, M.A.; Islam, M.N.; Sulaiman, S.A.; Gan, S.H. 2012. Physicochemical and antioxidant properties of Algerian honey. Molecules, 17: 11199-11215.
Karabagias, I.K.; Badeka, A.; Kontakos, S.; Karabournioti, S.; Kontominas, M.G. 2014. Characterisation and classification of Greek pine honeys according to their geographical origin based
on volatiles, physicochemical parameters and chemometrics. Food
Chemistry, 146: 548–557.
Marchini, L.C.; Sodré, G.S.; Moreti, A.C.C.C.; Otsuk, I.P. 2004.
Composição físico-química de amostras de méis de Apis mellifera
L. Do Estado de Tocantins, Brasil. Boletim de Indústria Animal,
61: 101-114.
Meléndez-Martínez, A.J.; Vicario, I.M.; Heredia, F.J. 2004. Importância
nutricional de los pigmentos carotenóides. Archivos Latino Americano
de Nutrición, Caracas, 54: 149–155.
Moniruzzaman, M.; An, C.Y.; Rao, P.V. 2014. Identification of phenolic acids and flavonoids in monofloral honey from Bangladesh by high performance liquid chromatography: Determination of antioxidant
capacity. BioMed Research International, 2014: 1–11.
Moreti, A.C.C.C.; Sodré, G.S.; Marchini, L.C. 2006. Cor de amostras
de mel de Apis mellifera L. de diferentes Estados Brasileiros. Boletim
de Indústria Animal, 63: 159–164.
Moreti, A.C.C.; Sodre´, G.S.; Marchini, L.C.; Otsuk, I.P. 2009.
Physicochemical characteristics of Apis mellifera L. honey samples
from the state of Ceará, Brazil. Ciência e Agrotecnologia, 33: 191-199.
Oliveira, P.S.; Müller, R.C.S.; Dantas, K.G.F.; Alves, C.N.; Vasconcelos, M.A.M.; Venturieri, G.C. 2012. Phenolic acids, flavonoids and
antioxidant activity in honey of Melipona fasciculata, M. flavolineata
(Apidae, Meliponini) and Apis mellifera (Apidae, Apini) from the
Amazon. Química Nova, 35: 1728-1732.
Pires, J.; Estevinho, M.L.; Cantalapiedra, X.F.J.; Iglesias, A. 2009.
Pollen spectrum and physico-chemical attributes of heather (Erica
sp.) honeys of north Portugal. Journal of the Science of Food and
Agriculture, 89: 1862–1870.
Pulcini, P.; Allegrini, F.; Festuccia, N. 2006. Fast SPE extraction and a LC-ESI-MS-MS analysis of flavonoids and phenolic acids in honey. Apiacta, 41: 21–27.
Rathcke, B.; Lacey, E.P. 1985. Phenological patterns of terrestrial plants. Annual Review of Ecology and Systematics, 16, 179:214.
Ribeiro, R.O.R.; Mársico, E.T.; Carneiro, C.S.; Monteiro, M.L.G.; Conte Júnior, C.; Oliveira de Jesus, E.F. 2014. Detection of honey adulteration of high fructose corn syrup by Low Field Nuclear
Magnetic Resonance (LF 1H NMR). Journal of Food Engineering,
135: 39–43.
Sant’Ana, L. D’O.; Sousa, J.P.L.M.; Salgueiro, F.B.; Lorenzon, M.C.A.; Castro, R.N. 2012. Characterization of monofloral honeys with multivariate analysis of their chemical profile and antioxidant
activity. Journal of Food Science, 71: 135–139.
Silva, C.; Queiroz, A.J.M.; Figueirêdo, R.M.F. 2004. Caracterização físico-química de méis produzidos no Estado do Piauí para diferentes
floradas. Revista Brasileira de Engenharia Agrícola e Ambiental, 8:
260-265.
Silva, A.A.; Silva, T.M.S.; Camara, C.A.; Queiroz, N.; Magnani, M.; Novais, J.S.; Soledade, L.E.B.; Lima, E.O.; Souza, A.L.; Souza, A.G. 2013. Phenolic profile, antioxidant activity and palynological analysis of stingless bee honey from Amazonas, Northern Brazil. Food Chemistry, 141: 3552–3558.
Silva, P.M.; Gauche, C.; Gonzaga, L.V.; Costa, A.C.O.; Fett, R. 2016.
Honey: Chemical composition, stability and authenticity. Food
Chemistry, 196: 309–323.
Sombroek, W.G. 1966. Amazon soils: a reconnaissance of the soils of the Brazilian Amazon Region. Centre for Agriculture Publications and Documentations, Wageningen. 292p.
Tonini, H. 2011. Phenology of Brazil nut (Bertholletia excelsa Humb.
and Bonpl., Lecythidaceae) in south of Roraima state. Cerne, 17,
123:131.
USDA, United States Standards for Grades of Extracted Honey. 1985.
Agricultural Marketing Service, Fruit and Vegetable Division, Processed Products Branch, Washington, DC, USA. (www. natureplica.com/wp-content/uploads/2014/05/United-States-Standards-for-Grades-of-Extracted-Honey.pdf ). Accessed on 19/10/2015.
Vargas, T. 2006. Avaliação da Qualidade do Mel Produzido na Região dos
Campos Gerais do Paraná. Dissertação de Mestrado, Universidade Estadual de Ponta Grossa, Ponta Grossa. 134p.
Venir, E.; Spaziani, M.; Maltini, E. 2010 Crystallization in ‘‘Tarassaco’’
Italian honey studied by DSC. Food Chemistry, 122, 410:415.
Vit, P.; Medina, M.; Enríquez, E. 2008. Quality standards for medicinal uses of Meliponinae honey in Guatemala, Mexico and Venezuela. Bee World, 85, 2:5.
RECEIVED: 31/08/2017 ACCEPTED: 16/12/2017
ASSOCIATE EDITOR: Jorge Maurício David