Biomass flow and water efficiency of cactus pear under different
managements in the Brazilian Semiarid
1Fluxo de biomassa e eficiência hídrica da palma forrageira sob diferentes manejos no
Semiárido Brasileiro
Marcos Neves Lopes2*, Magno José Duarte Cândido3, Ellen da Costa Gomes4, Roberto Cláudio Fernandes Franco Pompeu5 and Rodrigo Gregório da Silva6
ABSTRACT -Balanced fertilization is an important factor in optimizing the growth and productivity of crops. This study aimed to evaluate biomass flow and rain use efficiency in cactus pear cv. Gigante fertilized with combinations of nitrogen (10; 70; 100; 130 and 190 kg ha-1 year-1 N) and phosphorus (10; 70; 100; 130 and 190 kg ha-1 year-1 P
2O5), in two harvest
frequencies (annual and biennal), in the regions of Quixadá and Tejuçuoca, in Ceará. This was a split-plot randomized block design, with four replicates. In Quixadá and Tejuçuoca, the N and P combinations and harvest frequencies influenced the productions rates of different cladode orders and rain use efficiency in cactus pear. In Quixadá, in the annual harvest, the forage production rate (FPR) was 10.3 kg ha-1 day-1 in the N/P
2O5 combination at 190.0/190.0 kg ha-1 year-1 and in the
biennal harvest, the maximum FPR was 4.6 kg ha-1 day-1 in the N/P
2O5 combination at 114.6/136.8 kg ha-1 year-1. In relation
to the annual harvest in the municipality of Tejuçuoca, the maximum FPR was 30.0 kg ha-1 day-1 in the N/P
2O5 combination
at 137.5/190.0 kg ha-1 year-1 and in the biennal harvest, the maximum FPR observed was 38.0 kg ha-1 day-1 with the N/P 2O5
combination of 190.0/33.4 kg ha-1 year-1. The biomass productions rate and rain use efficiency are optimized with the balance
of combined levels of nitrogen and phosphorus.
Key words:Fertilization. Rain use efficiency.Opuntia fícus-indica. Forage production rate.
RESUMO -A adubação balanceada é fator de importância comprovada na otimização do crescimento e produtividade das culturas. Objetivou-se avaliar o fluxo de biomassa e a eficiência de uso da chuva na palma forrageira cv. Gigante, adubada com combinações de doses de nitrogênio (10; 70; 100; 130 e 190 kg ha-1 ano-1 de N) e fósforo (10; 70; 100; 130 e 190 kg ha-1 ano-1 de
P2O5), nas frequências de colheita anual e bianual, nas regiões de Quixadá e Tejuçuoca, no Ceará. Utilizou-se delineamento em blocos casualizados, em arranjo de parcelas subdivididas, com quatro repetições. Em Quixadá e Tejuçuoca, as combinações de N e P e frequências de colheita influenciaram as taxas de produções de diferentes ordens de cladódios e a eficiência de uso da chuva na palma forrageira. Em Quixadá, na colheita anual, verificou-se taxa de produção de forragem (TPF) de 10,3 kg ha-1 dia-1 na combinação N/P
2O5 de 190,0/190,0 kg ha-1 ano-1 e na colheita bianual, observou-se máxima TPF
de 4,6 kg ha-1 dia-1na combinação N/P
2O5 de 114,6/136,8 kg ha-1 ano-1. Em Tejuçuoca, na colheita anual, constatou-se
máxima TPF de 30,0 kg ha-1 dia-1 na combinação N/P
2O5 de 137,5/190,0 kg ha-1 ano-1 e na colheita bianual, registrou-se
maior TPF de 38,0 kg ha-1 dia-1 na combinação N/P
2O5 de 190,0/33,4 kg ha-1 ano-1. As taxas de produções de biomassa e
eficiência de uso da chuva são otimizadas com o balanço de doses combinadas de nitrogênio e fósforo. Palavras-chave: Adubação. Eficiência de uso da chuva.Opuntia fícus-indica. Taxa de produção de forragem.
DOI: 10.5935/1806-6690.20180037 *Author for correspondence
Received for publication on 20/04/2016; approved 31/05/2017
1Parte da Tese do primeiro autor apresentada ao Programa de Doutorado Integrado em Zootecnia/UFC/UFPB/UFRPE. Pesquisa financiada pelo BNB 2Pesquisador Visitante do Departamento de Zootecnia, CCA/UFC, Fortaleza-CE, Brasil, [email protected]
3Departamento de Zootecnia, CCA/UFC, Fortaleza-CE, Brasil, [email protected]
4Programa de Doutorado Integrado em Zootecnia/UFC/UFPB/UFRPE, Fortaleza-CE, Brasil, [email protected] 5Embrapa Caprinos e Ovinos, Sobral-CE, Brasil, [email protected]
6Instituto Federal de Educação, Ciência e Tecnologia do Ceará/IFCE, Campus Limoeiro do Norte, Limoeiro do Norte-CE, Brasil, rodrigogregorio@
INTRODUCTION
Forage production under dryland regime in the semi-arid regions has been shown to be a very important aspect in the livestock exploitation, since under such conditions the cattle rancher faces a serious problem, which is the qualitative-quantitative deficit of the forage produced, since the constant dry periods associated with the consecutive years of low rainfall greatly alter the production and quality of the forage crop. In this sense, cactus pear is an important forage resource for animal feed in semi-arid regions (CAVALCANTIet al., 2008), once it is a crop with high productive potential in these regions, in addition to high tolerance to arid and semi-arid conditions, with CAM photosynthesis and high efficiency in water use (OLIVEIRAet al., 2010; SILVAet al., 2014).
Balanced fertilization is an important factor in optimizing the growth and productivity of forage
plants (LOPESet al., 2011a, b; POMPEUet al., 2010).
The literature contains other studies on the effects of nitrogen and phosphate fertilization on the structural and productive characteristics of cactus pear (ALMEIDA;
PEIXOTO; LEDO, 2012; CUNHAet al., 2012; DUBEUX
JÚNIORet al., 2006). Besides fertilization, other factors including the frequency and intensity of harvests (ALVES et al., 2007; FARIASet al., 2000) and cultivation regions
(DUBEUX JÚNIOR et al., 2006) influence biomass
production of cactus pear.
Studies demonstrated the variation in the magnitude of cactus pear responses to fertilization and, in general, involved one or a few factors. This fact demonstrates the need for comprehensive research on the morphophysiological responses of cactus pear to multiple factors.
The focus of the present research will enable the mapping and quantification of the integrated responses of cactus pear components to environmental and management factors, encompassing different soil and climatic conditions (distinct regions), fertilization (nitrogen and phosphorus combinations) and harvesting frequencies (annual and biennal).
In the light of the above, this study was conducted with the purpose of evaluating the biomass flow characteristics and rain use efficiency in cactus pear cv. Gigante, fertilized with nine combinations of nitrogen and phosphorus under two harvest frequencies, in the semi-arid regions of Quixadá and Tejuçuoca.
MATERIAL AND METHODS
The experiment was conducted in the municipalities of Quixadá and Tejuçuoca, State of Ceará,
Brazil. In Quixadá, the experiment was conducted at Lavoura Seca Farm, belonging to the Agricultural Sciences Center, Universidade Federal do Ceará (UFC). In Tejuçuoca, it was conducted at Quilombo Farm, privately owned. The municipality of Quixadá has BSw’h’ climate, hot semi-arid, and Tejuçuoca, Aw climate, tropical with dry season, according to Köppen classification (1948).
Daily rainfalls were recorded in both regions (Figure 1). The temperature (T) and relative humidity (RH) of the experimental period were also recorded. In Quixadá, mean values of 27.0°C and 58.8% were recorded for T and RH, respectively, during the exprimental period. Data were obtained at the Agroclimatological Station of the Federal University of Ceará (Quixadá) and at the Agroclimatological Station of FUNCEME (Tejuçuoca). In both municipalities, the experiment began in 2011 and followed similarity regarding the evaluated treatments.
At the beginning of the experiment, the soil of both regions was analyzed for physical-chemical characterization at the depth 0.0 - 20.0 cm (Tables 1 and 2).
We analyzed nine combinations of nitrogen (N) and phosphorus (P2O5), consisting of five doses of N (10; 70; 100; 130 and 190 kg ha-1 year-1) as urea and five doses of P2O5 (10; 70; 100; 130 and 190 kg ha-1 year-1) as single superphosphate, according to Plan Puebla II matrix, for two factors (2k + 2k + 1).
The nine combinations were studied in association with two harvesting frequencies (annual and biennal), totaling eighteen treatments, with four replicates, distributed in a split plot randomized complete block design, with combinations of doses of N and P2O5 assigned to the plots and the harvesting frequencies, to the subplots, as follows:
N10P70FC1 and N10P70FC2 (10 kg N and 70 kg P2O5 ha-1 year-1, with annual and biennal harvests, respectively); N70P10FC1 and N70P10FC2 (70 kg N and 10 kg P2O5 ha-1 year-1, with annual and biennal harvests, respectively); N70P70FC1 and N70P70FC2 (70 kg N and 70 kg P2O5ha-1 year-1, with annual and biennal harvests, respectively); N70P130FC1 and N70P130FC2 (70 kg N and 130 kg P2O5 ha-1 year-1, with annual and biennal harvests, respectively); N100P100FC1 and N100P100FC2 (100 kg N and 100 kg P2O5 ha-1 year-1, with annual and biennal harvests, respectively); N130P70FC1 and N130P70FC2 (130 kg N and 70 kg P2O5 ha-1 year-1, with annual and biennal harvests, respectively); N130P130FC1
and N130P130FC2 (130 kg N and 130 kg P2O5 ha-1
Figura 1 - Daily rainfall in the regions of Quixadá and Tejuçuoca, State of Ceará, in the agricultural years of 2011 and 2012
Source: limatological Station of the Federal University of Ceará (Quixadá) and Agroclimatological Station of FUNCEME (Tejuçuoca)
Region P K Na+ Ca2+ Mg2+ Al3+ SB ECEC pH OM
--- mg dm-3--- --- cmol
c dm-3--- H2O g kg-1
Quixadá 5.0 260.0 20.0 3.40 3.40 0.00 7.55 7.55 6.1 5.28
Tejuçuoca 6.0 243.0 7.0 4.00 3.20 0.00 7.85 7.85 6.2 8.17
Region Coarse sand Fine sand Silt Clay Dp Textural classification
--- g kg-1--- g cm-3
Quixadá 513 363 89 35 2.62 Sand
Tejuçuoca 164 590 153 93 2.57 Sandy loam
kg P2O5 ha-1 year-1, with annual and biennal harvests, respectively); N190P130FC1 and N190P130FC2 (190 kg N and 130 kg P2O5 ha-1 year-1, with annual and biennal harvests, respectively).
Soil preparation for planting cactus pear (Opuntia ficus-indica cv. Gigante) included the following steps: stumps removal (whenever necessary), removal of vegetation from the area and harrowing. Subsequently, the plots were marked for delimitation of the respective area. Each plot occupied an area of 24.0 m2 (4.0 x 6.0 m), consisting of 120 plants, distributed in three rows of 4.0 m in length, with the central row used for measurements and the others, as borders.
After harvesting in the field, cladodes were allowed to rest in the shade for fifteen days (LOPES
Table 1 -Chemical characteristics of soils in the experimental areas of Quixadá and Tejuçuoca
Phosphorus (P), potassium (K), sodium (Na+), calcium (Ca2+), magnesium (Mg2+), sum of bases (SB), effective cation exchange capacity (ECEC),
potential of hydrogen (pH) and organic matter of the soil (OM)
Table 2 -Physical characteristics of soils in the experimental areas of Quixadá and Tejuçuoca
Density of particles (Dp)
et al., 2009), to heal injuries caused by harvesting and transportation.
Furrows were manually opened, using cutter mattock, narrow hoe and hoe, obeying the average depth of 30 cm and 2.0 m spacing. Cladodes were planted at the depth that covered 2/3 of them, at 2.0 m x 0.10 m spacing, recommended to meet the density of 50,000 plants ha-1.
calcitic limestone, based on the highest dose of single superphosphate.
The annual dose of nitrogen, as urea, was made available in three fractions, with a 20 day-interval between applications. In all applications, urea was diluted in water, applying 1.0 liter of solution for each 4 m length of the cactus pear row, totalizing 3.0 liters per plot. Dilution was carried out in order to better uniformity, due to the small volume of fertilizer per plot in some doses, making it difficult to apply in solid form.
After the establishment of the cactus pear plantation, crop treatments were carried out, whenever necessary, to maintain the crop in good growth conditions.
With respect to biomass flow, the following variables were determined: production rates of cladodes of the first (PRFOC, kg ha-1 day-1), second (PRSOC, kg ha-1 day-1), third (PRTOC, kg ha-1 day-1), fourth (PRFoOC, kg ha-1 day-1) and fifth order (PRFiOC, kg ha-1 day-1); determined from the division of the pre-dried biomass of cladodes of each order per hectare by the evaluation period; forage production rate (FPR, kg ha-1 day-1), determined from the division of total pre-dried biomass of all orders of cladodes per hectare by the evaluation period; harvested forage production rate (HFPR, kg ha-1 day-1), determined
from the division of the pre-dried harvestable biomass of cladode orders above the cutting height per hectare by the evaluation period. The pre-drying of the cladodes was carried out at 55°C to constant biomass.
Rain use efficiency (RUE) for total forage biomass pre-dried at 55°C (TFB), in kg ha-1 mm-1, was estimated from the division of TFB by the cumulative rainfall (mm) during the cycle.
Data were subjected to analysis of variance, test of comparison of means and multiple regression models. Qualitative factors were compared by the Scott-Knott means comparison test at 5% probability level. Quantitative factors were analyzed in multiple regression models (up to 10% probability level). The statistical genetic analysis system (SAEG 9.1, 2007) was used as a tool to aid analysis.
RESULTS AND DISCUSSION
When analyzing production rates and rain use efficiency in cactus pear, interactions were found between nitrogen and phosphorus combinations and harvest frequencies in Quixadá and Tejuçuoca (Table 3). Thus, the
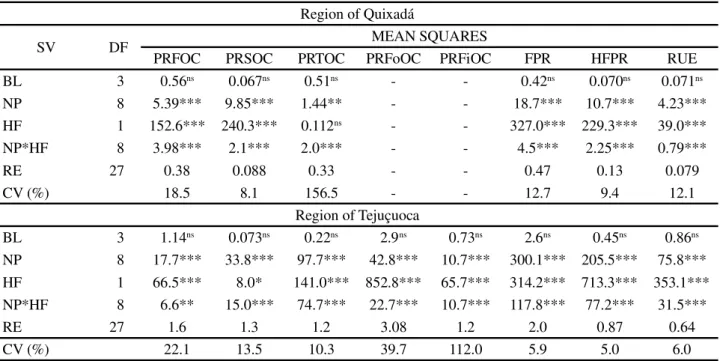
Table 3 - Summary of the analysis of variance of biomass flow and rain use efficiency in cactus pear according to nitrogen and phosphorus combinations under two harvest frequencies, in Quixadá and Tejuçuoca
SV - Source of variation; BL - Block; NP - Combinations of N and P; HF - harvest frequency; RE - Residuals; CV - Coefficient of variation; DF - Degree of freedom; PRFOC - Production rate of first order cladodes; PRSOC - Production rate of second order cladodes; PRTOC - Production rate of third order cladodes; PRFoOC Production rate of fourth order cladodes; PRFiOC Production rate of fifth order cladodes; FPR Forage production rate; HFPR -harvested forage production rate; RUE - Rain use efficiency;ns - non-significant; ***, ** and * - significant at 0.1%, 1% and 5%, respectively, by F-test
Region of Quixadá
SV DF MEAN SQUARES
PRFOC PRSOC PRTOC PRFoOC PRFiOC FPR HFPR RUE
BL 3 0.56ns 0.067ns 0.51ns - - 0.42ns 0.070ns 0.071ns
NP 8 5.39*** 9.85*** 1.44** - - 18.7*** 10.7*** 4.23***
HF 1 152.6*** 240.3*** 0.112ns - - 327.0*** 229.3*** 39.0***
NP*HF 8 3.98*** 2.1*** 2.0*** - - 4.5*** 2.25*** 0.79***
RE 27 0.38 0.088 0.33 - - 0.47 0.13 0.079
CV (%) 18.5 8.1 156.5 - - 12.7 9.4 12.1
Region of Tejuçuoca
BL 3 1.14ns 0.073ns 0.22ns 2.9ns 0.73ns 2.6ns 0.45ns 0.86ns
NP 8 17.7*** 33.8*** 97.7*** 42.8*** 10.7*** 300.1*** 205.5*** 75.8***
HF 1 66.5*** 8.0* 141.0*** 852.8*** 65.7*** 314.2*** 713.3*** 353.1***
NP*HF 8 6.6** 15.0*** 74.7*** 22.7*** 10.7*** 117.8*** 77.2*** 31.5***
RE 27 1.6 1.3 1.2 3.08 1.2 2.0 0.87 0.64
Region HF Model Quixadá Annual PRFOC = 4.84313 + 0.000722646
∆N – 0.0234742*P + 0.000178444**P2; R2 = 0.47
Biennal PRFOC = - 1.09449 + 0.0279673***N - 0.000130477***N2 + 0.0371662***P - 0.000155765***P2; R2 = 0.67
Tejuçuoca Annual PRFOC = 4.41612 + 0.00293841
∆N + 0.0201603**P; R2 = 0.29
Biennal PRFOC = 3.00493 + 0.0424893*N - 0.000151716*N2 – 0.00569146∆P; R2 = 0.33
Quixadá Annual PRSOC = 2.72397 + 0.0317897**N - 0.000161934**N
2 + 0.0162369***P; R2 = 0.47
Biennal PRSOC = -0.722623 + 0.0314237***N - 0.000134865***N2 + 0.0111712***P; R2 = 0.77
Tejuçuoca Annual PRSOC = - 0.125197 + 0.105434***N - 0.000407519***N
2 + 0.0634059**P - 0.000246484**P2; R2 = 0.72
Biennal PRSOC = 2.99822 + 0.0397651∆N + 0.000585153**N2 + 0.0143128∆P + 0.000531075**P2 - 0.00127367**NP; R2 = 0.53
Quixadá Annual PRTOC = 1.01213 - 0.0108578
∆N – 0.000180155∆N2 - 0.00162963∆P - 0.000250351*P2 + 0.000533980*NP; R2 = 0.42
Biennal PRTOC = - 1.15166 + 0.0116643**N + 0.0000869623**N2 + 0.0128903**P + 0.000081579**P2 – 0.000273843***NP; R2 = 0.66
Tejuçuoca Annual PRTOC = - 1.83416 + 0.152784**N - 0.000549447*N
2 + 0.0273561∆P; R2 = 0.42
Biennal PRTOC = - 0.264267 + 0.146886***N + 0.00046194*N2 + 0.0561381*P + 0.000529566**P2 - 0.0018007***NP; R2 = 0.81
Tejuçuoca Annual PRFoOC = -1.34076 + 0.00965625**N + 0.0312191**P - 0.000142632**P
2; R2 = 0.58
Biennal PRFoOC = 0.627711 + 0.116719**N - 0.00139207***N2 + 0.102555**P - 0.00145069***P2 + 0.00183539**NP; R2 = 0.81
Tejuçuoca Biennal PRFiOC = - 3.82582 + 0.0608798**N - 0.00016324∆N2 + 0.0657698**P - 0.000395523***P2; R2 = 0.60
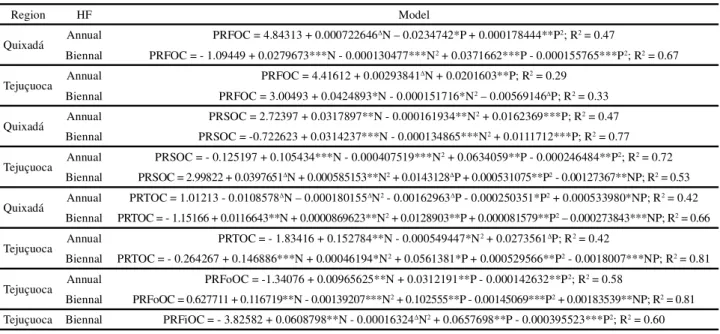
Table 4 -Production rates of different orders of cladodes of cactus pear in response to the combinations of nitrogen and phosphorus, in the regions of Quixadá and Tejuçuoca
Harvest frequency (HF); Production rates of first (PRFOC), second (PRSOC), third (PRTOC), fourth (PRFoOC) and fifth (PRFiOC) order cladodes; significant at 0.1% (***), 1% (**), 5% (*) and 10% (∆) probability
combined effect of N and P on the studied variables was evaluated at the two harvest frequencies. The responses of the cactus pear to harvest frequencies were also analyzed. When analyzing the production rates of cladodes of the first (PRFOC), second (PRSOC), third (PRTOC, Quixadá and Tejuçuoca) (Table 4), fourth (PRFoOC) and fifth order (PRFiOC, Tejuçuoca) (Table 4), of forage (FPR) and harvestable forage (HFPR, Quixadá and Tejuçuoca) (Table 5) of cactus pear, there was effect of N and P combinations, fitting to a multiple regression model.
In Quixadá, considering the annual harvest, maximum efficiency of PRFOC (7.0 kg ha-1 day-1) was observed with the highest doses of N (190.0 kg ha-1 year-1) and P (190.0 kg ha-1 year-1 P
2O5). In the biennal harvest, maximum PRFOC of 2.6 kg ha-1 day-1 was verified in the dose of 107.2 kg ha-1 year-1 N combined with 119.3 kg ha-1 year-1 P
2O5. In the annual harvest, the highest PRSOC (7.4 kg ha-1 day-1) was observed at the dose of 98.2 kg ha-1 year-1 N, associated with the highest dose of 190.0 kg ha-1 P2O5. In the biennal harvest, higher PRSOC (3.2 kg ha-1 day-1) was observed at the dose of 116.5 kg ha-1 year-1 N combined with the highest dose of P (190.0 kg ha-1 year-1 P2O5). In the annual harvest, the highest PRTOC (2.4 kg ha-1 day-1) was observed with the highest dose of N (190.0 kg ha-1 year-1), associated with the highest P dose (190.0 kg ha-1 year-1 P
2O5). In the biennal harvest, maximum efficiency of PRTOC (0.75 kg ha-1 day-1) was found at the highest N dose (190.0 kg ha-1 year-1), combined with 116.7 kg ha-1 year-1 P
2O5.
In Tejuçuoca, in the annual harvest, the maximum PRFOC (8.8 kg ha-1 day-1) was observed at the higher doses of N (190.0 kg ha-1 year-1) and P (190.0 kg ha-1 year-1 P
2O5). In the biennal harvest, the highest PRFOC (5.9 kg ha-1 day-1) was found at the dose of 140.0 kg ha-1 year-1 N combined with the lowest dose of P (10.0 kg ha-1 year-1 P
2O5). In the annual harvest, the maximum PRSOC (10.8 kg ha-1 day-1) was observed at the dose of 129.4 kg ha-1 year-1 N, associated with the dose of 128.6 kg ha-1 year-1 P
2O5. In the biennal harvest, the maximum efficiency of PRSOC (11.1 kg ha-1 day-1) was achieved at the highest dose of N (190.0 kg ha-1 year-1) combined with 130.0 kg ha-1 year-1 P
2O5. In the annual harvest, the maximum PRTOC (14.4 kg ha-1 day-1) was verified with the dose of 139.0 kg ha-1 year-1 N combined with the highest dose of P (190.0 kg ha-1 year-1 P
2O5). In the biennal harvest, the maximum efficiency in PRTOC (16.1 kg ha-1 day-1) was registered with the highest dose of N (190.0 kg ha-1 year-1), combined with 130.0 kg ha-1 year-1 P
2O5. In the annual harvest, maximum PRFoOC
(2.2 kg ha-1 day-1) was reached at the highest dose of N (190.0 kg ha-1 year-1) combined with 109.4 kg ha-1 year-1 P2O5. In the biennal harvest, higher values of PRFoOC (12.6 kg ha-1 day-1) were observed at the dose of 111.9 kg ha-1 year-1 N, combined with 106.1 kg ha-1 year-1 P2O5. In the biennal harvest, the maximum efficiency of PRFiOC (4.6 kg ha-1 day-1) was observed with 186.5 kg ha-1 year-1 N combined with 83.1 kg ha-1 year-1 P
supply for different harvesting frequencies, in Quixadá and Tejuçuoca, resulted from the positive effect of both on plant growth and development, accelerating the biomass increase by increasing the production of new cladodes and biomass gain per cladode as a function of the stimulus to cell division and elongation (VOLENEC; NELSON, 1984), contributing to the three-dimensional increase of each cladode order, with higher density of biomass per cladode, corroborating with the production rates of the whole plant.
In this context, given the importance of the nutrients mentioned for the greater gain of biomass by the forage crop within the same time of growth, it is also worth mentioning, with respect to the beneficial effects of nutrients, that both nitrogen and phosphorus are essential for the development of plants; phosphorus is essential for cell division, reproduction and plant metabolism, and nitrogen is part of all amino acids, which represent the
components of proteins (BISSANI et al., 2008). In the
present study, fertilization, mainly with nitrogen, is an important practice for optimization of the photosynthetic processes of CAM plants (NERD; NOBEL, 1995; NOBEL; BARRERA, 2002), making it a fundamental point for the maximum growth and production of forage biomass under different conditons of environment and management.
In Quixadá, in the annual harvest, FPR was 10.3 kg ha-1 day-1 at the highest dose of N (190.0 kg ha-1 year-1), combined with the highest dose of P (190.0 kg ha-1 year-1 P2O5). In the biennal harvest, the maximum FPR (4.6 kg ha-1 day-1) at 114.6 kg ha-1 year-1 N combined with 136.8 kg ha-1 year-1 P
2O5. In the annual harvest, the maximum HFPR of 7.5 kg ha-1 day-1 was achieved with 103.9 kg ha-1 year-1 N, combined with the highest dose of P (190.0 kg ha-1 year-1 P2O5). In the biennal harvest, the highest HFPR (3.5 kg ha-1 day-1) with the dose of 127.2 kg ha-1 year-1 N combined with the highest dose of P (190.0 kg ha-1 year-1 P
2O5).
In Tejuçuoca, in the annual harvest, the maximum FPR of 30.0 kg ha-1 day-1 was found with the dose of 137.5 kg ha-1 year-1 N combined with the highest dose of P (190.0 kg ha-1 year-1 P
2O5). In the biennal harvest, the highest FPR (38.0 kg ha-1 day-1) was observed with the highest dose of N (190.0 kg ha-1 year-1), combined with 33.4 kg ha-1 year-1 P
2O5. In the annual harvest, the maximum HFPR at 20.0 kg ha-1 day-1 was verified with the dose of 133.6 kg ha-1 year-1 N combined with 142.7 kg ha-1 year-1 P
2O5. In the biennal harvest, the maximum efficiency in HFPR (31.8 kg ha-1 day-1) was reached with the highest dose of N (190.0 kg ha-1 year-1) combined with 65.1 kg ha-1 year-1 P
2O5.
In Quixadá and Tejuçuoca, in annual and biennal harvests, the responses of forage production rate and harvestable forage production rate to the combined N and P supply is the final product resulting from the integration of the responses of the production rates of the different orders of cladodes of cactus pear, with the difference that the final FPR response to the combined N and P doses resulted from the performance of these nutrients on PRFOC, PRSOC and PRTOC in Quixadá, against the occurrence of PRFOC, PRSOC, PRTOC, PRFoOC and PRFiOC in Tejuçuoca. Regarding the HFPR in response to the N and P combinations, there was a combined effect of nutrients on the PRSOC and PRTOC in Quixadá, against their effect on PRSOC, PRTOC, PRFoOC and PRFiOC, in Tejuçuoca.
With regard to the pattern of FPR and HFPR responses in plants fertilized with combined doses of nitrogen and phosphorus, it is explicit that forage production, a reflection of the processes of plant growth and development, can be substantially improved with the use of fertilizers, especially by the supply of N and P, due to the positive effect of both on the biomass flow of cactus pear.
Table 5 - Production rates of forage and harvested forage in cactus pear in response to combinations of nitrogen and phosphorus, in Quixadá and Tejuçuoca
Harvest frequency (HF); forage production rate (FPR) and harvested forage production rate (HFPR); significant at 0.1% (***), 1% (**), 5% (*) and 10% (∆) probability
Region HF Modelo
Quixadá Annual FPR = 4.43216 + 0.00893378∆N + 0.0219405***P; R
2 = 0.55
Biennal FPR = - 1.915 + 0.05118***N - 0.000223316***N2 + 0.0516218***P - 0.000188619***P2; R2 = 0.77
Tejuçuoca Annual FPR = 4.67329 + 0.217335**N - 0.000790254*N
2 + 0.0546151*P; R2 = 0.47
Biennal FPR = 16.296 + 0.11303***N + 0.0135214∆P - 0.000202356∆P2; R2 = 0.84
Quixadá Annual HFPR = 2.65839 + 0.0323217**N - 0.000155616**N
2 + 0.0167201***P; R2 = 0.51
Biennal HFPR = - 0.763216 + 0.0322664***N - 0.000126792***N2 + 0.0117261***P; R2 = 0.78
Tejuçuoca Annual HFPR = - 3.1712 + 0.223967***N - 0.000838105***N
2 + 0.115105*P - 0.000403252*P2; R2 = 0.57
In Quixadá, PRFOC and PRSOC were higher in the annual harvest in all combinations of N and P. The order of superiority in the PRTOC varied between annual and biennal crops, depending on the combination of N and P (Table 6).
Higher values of PRFOC and PRSOC in the annual harvest frequency resulted from the greater productive potential of the plant, with more pronounced gains of biomass in the management with annual harvest compared to the biennal harvest, associated with the shorter growth period in the annual harvest. The variation in PRTOC between harvest frequencies resulted from the balance between biomass accumulation and growth time at each harvest interval.
FPR and HFPR were higher in the annual harvest in all combinations of N and P (Table 6). This response is justified by the higher yield of the crop in terms of growth and accumulation of biomass during the shortest development period, a determining condition for the highest production rates of forage and harvestable forage. In Tejuçuoca, PRFOC was higher in the annual harvesting frequency for most combinations of N and P. The order of superiority in PRSOC varied between annual and biennal harvests, depending on the combination of N and P (Table 7).
The highest PRTOC was observed in the biennal harvest at 77.8% of the N and P combinations. The PRFoOC was higher in the biennal harvest for all N and P combinations. In the N and P combinations that allowed the emergence of fifth order cladodes, higher PRFiOC was verified in the biennal harvest (Table 7).
The highest first order cladode production rate in the management with annual harvest frequency can be attributed to the greater cladode production potential, as a result of the stimulus to the development of buds (areolas) in the matrix cladode, due to the greater incidence of photosynthetically active radiation at the base of the plant throughout the growth period, since the annual harvest provided the removal of the biomass above the primary cladodes each year of cultivation.
The highest production rates of cladodes of higher orders (PRTOC, PRFoOC and PRFiOC) are related to the increase in biomass in the upper stratum of the crop under a longer rest period, since the development time was determinant for the emergence and gain of biomass in the upper parts of the plant.
There were higher FPR and HFPR in the biennal harvest for 66.7% and 88.9% of the N and P combinations, respectively (Table 7). These differences in the harvest frequencies, with predominance of higher values in the
Table 6 - Biomass production rates of cladodes according to harvesting frequencies, for different combinations of nitrogen and phosphorus in cactus pear, in Quixadá
Harvest frequency (HF); means followed by different letters with the same combination of nitrogen and phosphorus are significantly different by Scott-Knott test at 5% probability
Combinations of N and P2O5 (kg ha-1 year-1)
HF 10/70 70/10 70/70 70/130 100/100 130/70 130/130 130/190 190/130
First order cladode production rate (kg ha-1 day-1)
Annual 4.2 A 4.9 A 2.8 A 4.5 A 6.5 A 3.9 A 4.3 A 7.0 A 4.8 A
Biennal 0.65 B 0.94 B 2.0 B 3.1 B 3.0 B 1.4 B 2.2 B 1.5 B 2.1 B
Second order cladode production rate (kg ha-1 day-1)
Annual 3.8 A 3.9 A 6.9 A 5.4 A 7.5 A 3.9 A 5.4 A 7.2 A 5.6 A
Biennal 0.45 B 0.82 B 1.1 B 2.2 B 3.3 B 1.7 B 2.5 B 2.9 B 1.9 B
Third order cladode production rate (kg ha-1 day-1)
Annual 0.04 A 0.0 A 0.0 A 0.06 B 0.0 B 0.0 B 2.58 A 0.0 B 0.97 A
Biennal 0.0 A 0.11 A 0.0 A 0.77 A 0.56 A 0.45 A 0.0 B 0.43 A 0.62 B
Forage production rate (kg ha-1 day-1)
Annual 5.3 A 6.6 A 5.7 A 6.8 A 9.9 A 6.2 A 7.8 A 11.1 A 8.1 A
Biennal 0.95 B 1.5 B 2.7 B 4.8 B 5.4 B 2.8 B 3.9 B 3.7 B 3.7 B
Harvested forage production rate (kg ha-1 day-1)
Annual 3.9 A 3.9 A 6.9 A 5.4 A 7.5 A 3.9 A 6.2 A 7.2 A 5.8 A
Table 7 - Biomass production rates of cladodes according to harvest frequencies, for different combinations of nitrogen and phosphorus in cactus pear, in Tejuçuoca
Harvest frequency (HF); means followed by different letters with the same combination of nitrogen and phosphorus are significantly different by Scott-Knott test at 5% probability
Combinations of N and P2O5 (kg ha-1 year-1)
HF 10/70 70/10 70/70 70/130 100/100 130/70 130/130 130/190 190/130
First order cladode production rate (kg ha-1 day-1)
Annual 6.4 A 4.6 A 6.4 A 5.8 A 4.2 A 7.1 A 11.1 A 8.7 A 6.2 A
Biennal 2.8 B 5.5 A 5.9 B 4.9 B 2.6 B 5.7 B 6.1 B 5.1 B 4.8 B
Second order cladode production rate (kg ha-1 day-1)
Annual 4.6 A 5.5 B 8.1 B 9.6 A 7.5 A 11.9 A 12.4 A 9.8 A 8.4 B
Biennal 5.6 A 7.1 A 9.4 A 7.9 B 4.4 B 10.6 B 6.4 B 9.0 B 11.3 A
Third order cladode production rate (kg ha-1 day-1)
Annual 3.4 B 6.1 B 6.8 B 7.5 B 6.0 B 11.3 B 22.6 A 12.2 A 8.5 B
Biennal 5.6 A 12.7 A 9.2 A 13.9 A 13.9 A 14.6 A 11.4 B 11.1 B 17.2 A
Fourth order cladode production rate (kg ha-1 day-1)
Annual 0.29 B 0.0 B 0.0 B 1.2 B 1.1 B 1.2 B 3.0 B 0.30 B 1.8 B
Biennal 3.2 A 5.4 A 7.5 A 8.3 A 14.3 A 7.7 A 13.8 A 3.7 A 6.7 A
Fifth order cladode production rate (kg ha-1 day-1)
Annual 0.0 A 0.0 B 0.0 B 0.0 A 0.0 B 0.0 B 0.0 B 0.0 A 0.0 B
Biennal 0.0 A 0.22 A 0.88 A 0.0 A 6.6 A 3.7 A 2.2 A 0.0 A 3.6 A
Forage production rate (kg ha-1 day-1)
Annual 13.3 A 14.3 B 19.0 B 21.0 B 16.1 B 26.9 B 40.3 A 26.9 A 20.8 B
Biennal 13.5 A 25.2 A 25.2 A 27.2 A 26.4 A 31.4 A 29.0 B 25.3 B 34.7 A
Harvested forage production rate (kg ha-1 day-1)
Annual 6.9 B 9.7 B 12.6 B 15.2 B 11.9 B 19.8 B 29.2 A 18.1 B 14.6 B
Biennal 10.7 A 19.7 A 19.3 A 22.4 A 23.8 A 25.7 A 22.9 B 20.3 A 29.9 A
biennal harvest, are supported by the pattern of responses of the production rates of the different orders in the two harvesting frequencies.
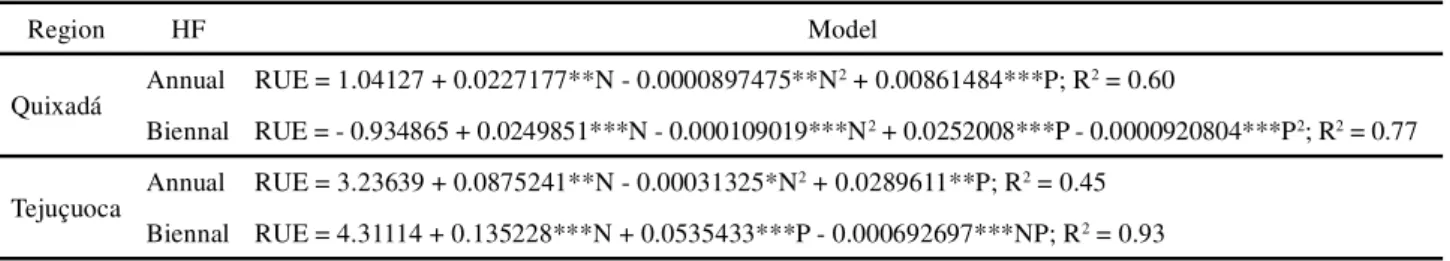
In the analysis of rain use efficiency (RUE) by cactus pear in Quixadá and Tejuçuoca, effects were detected for N and P combinations, fitting to a multiple regression model (Table 8).
In Quixadá, in the annual harvest, the maximum
RUE (4.1 kg ha-1 mm-1) was found with the dose of
126.6 kg ha-1 year-1 N, combined with the highest dose of P (190.0 kg ha-1 year-1 P
2O5). In the biennal harvest,
the maximum RUE (4.1 kg ha-1 mm-1) was observed
with 114.6 kg ha-1 year-1 N, combined with 136.8 kg ha-1 year-1 P
2O5.
In Tejuçuoca, in the annual harvest, the maximum RUE (14.9 kg ha-1 mm-1) was achieved with 139.7 kg ha-1 year-1 N, combined with the highest dose of P (190.0 kg
ha-1 year-1 P
2O5). In the biennal harvest, the highest value of RUE (19.9 kg ha-1 mm-1) was veiifeid with the highest dose of N (190.0 kg ha-1 year-1), combined with 130.0 kg ha-1 year-1 P
2O5.
The increase in RUE with the increase in the combined doses of N and P in the annual and biennal harvesting frequencies for Quixadá and Tejuçuoca, with a higher amount of cactus pear biomass produced per unit of rainfall, can be attributed to the higher final density of plants, compared to the lowest population of plants in the lowest combinations of N and P, by increasing the response potential of the cactus pear in a denser cactus pear plantation, with a better use of
rainfall (RAMOSet al., 2011; SALESet al., 2013). In
(ZÚÑIGA-Region HF Model Quixadá Annual RUE = 1.04127 + 0.0227177**N - 0.0000897475**N
2 + 0.00861484***P; R2 = 0.60
Biennal RUE = - 0.934865 + 0.0249851***N - 0.000109019***N2 + 0.0252008***P - 0.0000920804***P2; R2 = 0.77
Tejuçuoca Annual RUE = 3.23639 + 0.0875241**N - 0.00031325*N
2 + 0.0289611**P; R2 = 0.45
Biennal RUE = 4.31114 + 0.135228***N + 0.0535433***P - 0.000692697***NP; R2 = 0.93
Combinações de N e P2O5 (kg ha-1 year-1)
HF 10/70 70/10 70/70 70/130 100/100 130/70 130/130 130/190 190/130
Rain use efficiency (kg ha-1 mm-1) in Quixadá
Annual 2.1 A 2.6 A 2.2 A 2.7 A 4.4 A 2.7 A 3.5 A 4.4 A 3.2 A
Biennal 0.47 B 0.74 B 1.3 B 2.3 B 2.6 B 1.4 B 1.9 B 1.8 B 1.8 B
Rain use efficiency (kg ha-1 mm-1) in Tejuçuoca
Annual 7.5 A 7.0 B 9.6 B 10.1 B 7.9 B 13.3 B 19.3 A 13.8 B 10.4 B
Biennal 7.9 A 14.7 A 14.7 A 15.9 A 15.4 A 18.3 A 17.0 B 14.8 A 20.2 A
Table 8 - Rain use efficiency by cactus pear in response to combinations of nitrogen and phosphorus, in Quixadá and Tejuçuoca
Harvest frequency (HF); rain use efficiency (RUE); significant at 0.1% (***), 1% (**), 5% (*) and 10% (∆) probability.
TARANGOet al., 2009), which favors the greater use
of water by the crop.
In Quixadá, a higher EUC was observed in the annual harvesting frequency for all combinations of N and P (Table 9). The highest mean plant densities that contributed to the highest yields of fresh and dry biomass recorded in the annual harvest in Quixadá support the highest values of EUC found under such conditions.
In Tejuçuoca, the highest RUE was found for the biennal harvest for most combinations of N and P (Table 9). This is because the highest values found for the said RUE index are responsible for the pattern of responses revealed by the biomass in the biennal harvest management. It is also worth mentioning the better structure of the plant, exploring more efficiently the resources of the environment, such as water and nutrients.
The improvement in rain use efficiency by cactus pear fertilized under semi-arid conditions is a relevant response because it reflects the ability of the crop to tolerate low rainfall and its uneven distribution.
Table 9 - Rain use efficiency by cactus pear according to different harvest frequencies for different combinaitons of nitrogen and phosphorus, in Quixadá and Tejuçuoca
Harvest frequency (HF); means followed by different letters with the same combination of nitrogen and phosphorus are significantly different by Scott-Knott test at 5% probability
CONCLUSIONS
1. The rates of biomass production and rain use efficiency in cactus pear are optimized with the balanced fertilization of combined doses of nitrogen and phosphorus. The combination of nitrogen and phosphorus for maximum biological efficiency of biomass production and rain use efficiency in cactus pear varies according to harvest management and cropping region
2. In Quixadá, aiming at greater persistence and perenniality of cactus pear, it is necessary to adopt a management with biennal harvest and fertilization with 114.6 kg ha-1 year-1 N combined with 136.8 kg ha-1 year-1 P
2O5.
3. In Tejuçuoca, for the maximum biological response of cactus pear as to forage production, with greater persistence and perenniality of cactus pear plantation, it is recommended the management with biennal harvest and fertilization with 190.0 kg ha-1 year-1 N combined with 33.4 kg ha-1 year-1 P
REFERENCES
ALMEIDA, J.; PEIXOTO, C. P.; LEDO, C. A. S. Desempenho vegetativo e produtivo da palma forrageira. Enciclopédia Biosfera, v. 8, n. 15, p. 571-581, 2012.
ALVES, R. N. et al. Produção de forragem pela palma após
19 anos sob diferentes intensidades de corte e espaçamentos. Revista Caatinga, v. 2, n. 4, p. 38-44, 2007.
BISSANI, C. A. et al. Fertilidade dos solos e manejo da adubação de culturas. 2. ed. Porto Alegre: Metrópole, 2008. 344 p.
CAVALCANTI, C. V. A.et al. Palma forrageira enriquecida com
ureia em substituição ao feno de capim tifton 85 em rações para vacas da raça Holandesa em lactação. Revista Brasileira de Zootecnia, v. 37, n. 4, p. 689-693, 2008.
CUNHA, D. N. F. V.et al. Morfometria e acúmulo de biomassa em palma forrageira sob doses de nitrogênio. Revista Brasileira de Saúde e Produção Animal, v. 13, n. 4, p. 1156-1165, 2012.
DUBEUX JÚNIOR, J. C. B.et al. Productivity ofOpuntia fícus-indica (L.) Mill., under different N and P fertilization and plant population in North-east Brazil.Journal of Arid Enviroments, v. 67, n. 3, p. 357-372, 2006.
FARIAS, I.et al. Manejo de colheita e espaçamento da palma forrageira, em consórcio com sorgo granífero, no Agreste de Pernambuco.Pesquisa Agropecuária Brasileira, v. 35, n. 2, p. 341-347, 2000.
KOPPEN, W.Climatologia: con un estudio de los climas de la tierra. Mexico: Fondo de Cultura Economica, 1948. 478 p. LOPES, E. B.et al. Efeito do período de cura de cladódios da
palma gigante na emissão de raízes em Neossolo no Município de Lagoa Seca, Paraíba, Brasil. Revista Engenharia Ambiental, v. 6, n. 1, p. 231-239. 2009.
LOPES, M. N.et al. Biomass components in Massai grass during
establishment and regrowth under five nitrogen fertilization levels.Revista Brasileira de Zootecnia, v. 40, n. 8, p. 1629-1637, 2011a.
LOPES, M. N. et al. Growth index in massai grass under different levels of nitrogen fertilization. Revista Brasileira de Zootecnia, v. 40, n. 12, p. 2666-2672, 2011b.
NERD, A.; NOBEL, P. S. Accumulation, partitioning, and assimilation of nitrate in Opuntia ficus-indica. Journal of Plant Nutrition, v. 18, n. 12, p. 2533-2549, 1995.
NOBEL, P. S.; BARRERA, E. Nitrogen relations for net CO2 uptake by the cultivated hemiepiphytic cactus, Hylocereus undatus.Scientia Horticulturae, v. 96, p. 281-292, 2002. OLIVEIRA, F. T. et al. Palma forrageira: adaptação e
importância para os ecossistemas áridos e semiáridos.Revista Verde, v. 5, n. 4, p. 27-37, 2010.
POMPEU, R. C. F. F. et al. Características morfofisiológicas do capim-aruana sob diferentes doses de nitrogênio. Revista Brasileira de Saúde e Produção Animal, v. 11, n. 4, p. 1187-1210, 2010.
RAMOS, J. P. F. et al. Crescimento vegetativo de Opuntia ficus-indica em diferentes espaçamentos de plantio.Revista Caatinga, v. 24, n. 3, p. 41-48, 2011.
SAEG: sistema para análises estatísticas, Versão 9.1. Viçosa, MG: Fundação Arthur Bernardes: UFV, 2007.
SALES, A. T.et al. Crescimento vegetativo de palma forrageira
em diferentes densidades de plantio no Curimatú Paraibano. Tecnologia & Ciência Agropecuária, v. 7, n. 1, p. 19-24, 2013. SILVA, L. M. et al. Produtividade da palma forrageira
cultivada em diferentes densidades de plantio. Ciência Rural, v. 44, n. 11, p. 2064-2071, 2014.
VOLENEC, J. J.; NELSON, C. J. Carbohydrate metabolism in leaf meristems of tall fescue. II. Relationship to leaf elongation rates modified by nitrogen fertilization. Plant Physiology, v. 74, p. 595-600, 1984.
ZÚÑIGA-TARANGO, R.et al. Desarrollo radical, rendimiento y concentración mineral en nopal Opuntia ficus-indica (L.)
Mill. en diferentes tratamientos de fertilización. Journal of the Professional Association for Cactus Development, v. 11, p. 53-68, 2009.