Ciência Rural, v.48, n.12, 2018.
Production and characterization of alginate microparticles obtained by ionic gelation
and electrostatic adsorption of concentrated soy protein
Produção e caracterização de micropartículas de alginato obtidas por gelificação iônica e adsorção eletrostática de concentrado proteico de soja
Gabriela Barros Silverio1 Lyssa Setsuko Sakanaka1 Izabela Dutra Alvim2 Marianne Ayumi Shirai1
Carlos Raimundo Ferreira Grosso1*
ISSNe 1678-4596
Received 08.08.18 Approved 10.22.18 Returned by the author 11.06.18
INTRODUCTION
Microencapsulation is a coating process that, allows controlled release of the encapsulated materials at a desired location and time after applying a
specific stimulus. These materials have applications in
pharmaceutical, food, agricultural, livestock industries,
and several other such fields (JAFARI, et al., 2008).
In addition to controlling the release of the encapsulated materials, encapsulation can also protect materials from the variations in pH, light, oxygen, conditions of passage through the gastrointestinal tract, and evaporation of encapsulated active material,
thereby increasing their shelf-life. Furthermore, this process allows the masking of undesirable flavors and
odors and facilitates the handling of active materials
1Programa de Pós-graduação em Tecnologia de Alimentos, Universidade Tecnológica Federal do Paraná (UTFPR), 86036-370, Londrina, PR,
Brasil. E-mail: [email protected]. *Corresponding author.
2Centro de Tecnologia de Cereias e Chocolates, Instituto de Tecnologia de Alimentos (ITAL), Campinas, PR, Brasil.
ABSTRACT: Microencapsulation is used for protection and release of bioactive compounds. Combination of encapsulation methods allows the production of matrices with better technological properties compared to the application of one of the methods alone. Use of ionic gelation produces porous microparticles, and coating it with a protein, by electrostatic interaction, may contribute to a better protection of the active compound. The objective of the research was to produce alginate microparticles (AG) through ionic gelation and to coat them with soluble protein from soy protein concentrate. Two factors were studied, calcium concentration during ionic gelation (0.8, 1.6 and 2.4% w/w) and pH (3.5 and 7.0) of the protein solution for electrostatic interaction. Zeta potential (ZP) of biopolymers and microparticles were determined. Microparticles were characterized according to its morphology, average size and size distribution, as well as protein adsorption. Microparticles presented (154-334μm) multinuclear distribution of active compound, continuous and smooth surface, with a great standard deviation considering average size. The calcium concentration did not influence the protein adsorption on microparticles.The pH used in protein adsorption showed significant effect, with higher adsorption occurring at pH 3.5 (6.5 to 6.7% w/w, dry basis,db, of adsorbed protein) compared to pH 7.0 (<2.0% w/w, db, of adsorbed protein) indicating that electrostatic interaction was determinant for the protein coating. At this situation, ionic gelation microparticles and proteins presented ZP with opposite charges (pH>pKa AG<Isoelectric point, IP).
Key words: Microencapsulation, ionic gelation, electrostatic interaction, alginate, soy protein.
RESUMO: A microencapsulação é utilizada para a proteção de compostos bioativos e controle de sua liberação. A combinação de métodos de encapsulação permite a obtenção de matrizes com melhores propriedades tecnológicas em relação às técnicas utilizadas individualmente. Na gelificação iônica são produzidas micropartículas porosas, e o recobrimento por interação eletrostática com uma proteína permite a obtenção de micropartículas mais protetivas. O objetivo do trabalho foi produzir micropartículas de alginato (AG) através da gelificação iônica e recobri-las com proteínas solúveis de concentrado proteico de soja. Dois fatores foram estudados, o teor de cálcio utilizado na gelificação iônica (0,8,1,6 e 2,4% m/m) e o pH (3,5 e 7,0) para o recobrimento eletrostático com uma camada proteica. Os potenciais zeta (PZ) dos biopolímeros e das micropartículas foram determinados. As micropartículas foram caracterizadas quanto a morfologia, tamanho médio e sua distribuição e quanto ao teor de proteína adsorvida nas situações estudadas. As micropartículas obtidas apresentaram-se (154-334μm) com recheio distribuído de forma multinuclear, com superfície continua e visualmente lisas, porém com variação grande no tamanho médio. A variação do teor de cálcio não foi significativa na adsorção proteica. O pH utilizado na adsorção proteica foi significativo, com adsorções muito maiores em pH 3,5 (6,5 - 6,7% m/m de proteína adsorvida, base seca) comparado ao pH 7,0 (<2,0% m/m de adsorção proteica, base seca), indicando que a interação eletrostática foi determinante no recobrimento proteico. Nesta situação, micropartículas AG e a proteína apresentam PZ com cargas opostas (pH>pKa AG<ponto isoeletrico, PI).
Palavras-chave: Microencapsulação, gelificação iônica, interação eletrostática, alginato, proteína de soja.
(DESAI & PARK, 2005). Different compounds are
often encapsulated, including (but not limited to)
antioxidants, bioactive compounds, essential fatty
acids, enzymes, and microorganisms (CHAMPAGNE & FUSTIER, 2007).
Ionic gelation occurs through the interaction of an anionic polymer solution with ions
such as calcium (BUREY et al., 2008). Mechanism of
ionic gelation is described using an egg box model in which the carboxylic acid groups in polysaccharides,
especially sequences of guluronic acid (G) in the case
of alginate, interact with calcium ions at pH levels that
exceed the pKa of the polysaccharide (MESTDAGH & AXELOS, 1998). Ionic gelation is a simple, cheap, and fast method that uses non-toxic polysaccharides, requires mild temperatures, and does not require
organic solvents (SCHOUBBEN et al., 2010). The gel matrix that is obtained by
ionic gelation is characterized by low mechanical resistance and high porosity and some strategies, such as the coating of microparticles with a polyelectrolyte having an opposite charge to that possessed by the gel, have been proposed to improve this functionality through electrostatic interactions (WANDREY et
al., 2010). Generally, proteins and polysaccharides
are used as positive and negative polyelectrolytes,
respectively (KRASAEKOOPT et al., 2003, GOUIN, 2004, FARRIS et al., 2009).
Alginate is a linear hydrocolloid that
is obtained from brown marine algae such as
Laminariadigitata and Macrocystispyrifera. This
biomaterial contains β-D-mannuronic acid (M) and α-L-guluronic acid (G) in the form of sodium salts, which is bound together by α1-4 glycosidicbonds
in homopolymer blocks (MM and GG) that are
interspersed by heteropolymeric blocks (MG) in the polysaccharide chain (DRAGET et al., 2006).
Soybean (Glycine max (L.) Merrill) has an average protein and oil content of 40% and 20%,
respectively (EMBRAPA, 2004). Soy proteins are classified as globular and are insoluble in aqueous media at their isoelectric point (IP: 4.5). However,
these proteins are soluble in water or in dilute saline solutions at pH values that are lower than or higher
than their IP values (SGARBIERI, 1996). The predominant soybean proteins are β-conglycinins and glycinines, which exhibit sedimentation coefficients
of 7S and 11S for proteins of molar masses 180–
210 and 350 kDa, respectively (VELASQUEZ & BHATHENA, 2007).
The majority of the literature related to the
electrostatic adsorption of proteins onto microparticles focussed on globular proteins specially using whey
proteins (β-lactoglobulin ~65% of whey total proteins, 18.4KDa) according to DOHERTHY et al. (2011). The
7S and 11S protein fractions of CPS presents large molar
mass compared to β-lactoglobulin and can produce
different effects on the porosity of microparticles obtained by ionic gelation after adsorption of protein
on the microparticles (WANDREY et al., 2010). The identification of new plant protein materials besides animal globular protein as whey protein, that can be applied to produce an adsorbed layer on microparticles could expand their functionalities and applications.
Hence, the objective of the present study is to
develop microparticles from sodium alginate using ionic gelation and to coat them with globular soluble proteins that are extracted from CPS using electrostatic
interactions. We further evaluate the adsorption of these
soybean proteins on the microparticles in addition to comparing the physico-chemical and morphological properties of alginate microparticles with and without
adsorbed proteins. Although, the core material is very important, in the present work one oily emulsified material was used (oleoresin: sunflower oil) as a
model core material with the purpose to confer color to the microparticles during morphological evaluation and this oily material can be useful especially to carrier hydrophobic active compounds or hydrophilic
compounds and emulsifiers; however, the protection of
the core model material and its release were not the aim of this research.
MATERIALS AND METHODS
The materials used in this study included a
high molar mass sodium alginate with a high content
of guluronic acid (lot GA 1006403, PROTANAL RF
6650 and a viscosity of between 400 and 600mPas,
1%, 20°C; FMC Biopolymer, Campinas-SP, Brazil); a soy protein concentrate (Bremil, Arroio do Meio-RS, Brazil); paprika oleoresin (Citromax, Guarulhos, São Paulo, Brazil); Coomassie Brilliant Blue (Sigma Aldrich, St. Louis MO, USA); commercial sunflower oil; and calcium chloride (lot 205338, Synth, Diadema-SP, Brazil). Reagents provided by Alphatec, São Jose
dos Pinhais, PR, Brazil included 0.1N hydrochloric
acid (lot 20905G), 50% sodium hydroxide (lot 22816), concentrate sulfuric acid, and sodium citrate (lot 23739). Solutions, emulsions, and microparticles
were prepared using distilled and deionized water. All the reagents that were used were of analytical grade.
Physico-chemical characterization of biopolymers The CPS and alginate were characterized
contents (AOAC, 2006). The moisture content was
determined using an oven at 105°C until constant weight was observed via gravimetric analysis. The
ash content was determined by incinerating the
samples in a muffle for 5h. The amount of protein was determined using the Kjeldahl method with a
conversion factor of 6.25.
Production of soluble proteins from soy protein concentrate
Solutions were prepared with CPS at a
concentration of 2.5% (w/w) and were stirred at 40°C (MAGHS7S32, IKA, Works do Brasil, RJ, RJ, Brazil). The pH was adjusted to 11 with 0.1N NaOH while agitating the system for 30min. Further, the pH values of the solution were adjusted to 3.5 and 7.0 with
0.1N hydrochloric acid or 0.5N sodium hydroxide, respectively. Both the solutions were stirred at room temperature for 30min and were then refrigerated for 24h to allow phase separation. Supernatant that contained soluble proteins was removed for use in the
protein adsorption experiments. The total amount of
protein in the supernatant was determined based on
the Kjeldahl method (AOAC, 2006).
Production of alginate microparticles using ionic gelation
A 2%w/w alginate solution was emulsified with 2% w/w oleoresin (1:9 oleoresin/sunflower oil) over a period of 3min at 14,000rpm using a Turrax mixer (T-18, IKA Works do Brasil, RJ, Brazil),
resulting in yellow-red colored emulsion, which was further atomized over a 0.8, 1.6, or 2.4% w/w calcium chloride solution, with continuous agitation, using a
double fluid atomizer (LAB MAQ, RibeirãoPreto, SP, Brazil) under the following conditions to produce
spherical microparticles: Ø 0.7mm, a 12-cm distance between the double fluid atomizer and the calcium chloride solution, an air pressure of 15kgf/cm2, and
an atomization speed of 160mL/h, provided by a
peristaltic pump (MUKAI-CORÊA, 2004). After
production, microparticles were agitated in a calcium chloride solution for 30min to complete the ionic gelation process. Microparticles were further washed with water and separated using a steel sieve (Ø
53μm; Bertel, Caieiras-SP, Brazil). Two independent
repetitions were performed at varying calcium
concentrations (0.8, 1.6, and 2.4% w/v).
Electrostatic adsorption of proteins on the alginate microparticles
The moist alginate microparticles (50g)
were transferred to into soluble protein solutions at
pH 3.5 and 7.0 (200mL) and agitated for 30min at room temperature. The recovered microparticles (Ø 53μm steel sieve) were washed with water (pH 3.5 or 7.0) to remove non-adsorbed proteins. Adsorption
procedure was repeated thrice at each pH.
Composition of the micropartícles
The moisture, ash, and protein contents
of the microparticles were measured as per the characterization of biopolymers, which has been described above.
Quantification of the microparticles’ calcium content
The calcium content of microparticles
obtained by ionic gelation was determined using an
atomic absorption spectrophotometer (Analytic Jena AG-NOVAA300, Jena, Alemanha, flame AAS mode, Central Analitica, IQ, Unicamp). Samples of the same
independent treatments were mixed and microparticles were dissolved in 3% w/w sodium citrate before
analysis (SRIAMORNSAK e KENNEDY, 2008), and a standard solution of calcium (1000μg/mL, SCP Science, lot S120221015, Quebec, Canada) was used for absolute quantification. Preliminary evaluation
depicted that sodium citrate did not interfere in the calcium content determination. The measurements were performed in triplicate.
Zeta potential of the solutions and alginate micropar-ticles with or without covered protein
Zeta potentials (ZPs) of the diluted solutions (0.2% w/w) of soluble proteins at pH 3.5
and 7.0, of 2% alginate solutions/emulsions, and of microparticles with and without adsorbed proteins
were determined using a Zetasizer Nano-Z (Malvern Instruments, Worcestershire, U.K.). Samples of
the same independent treatment were mixed before
performing ZP determinations, the diluted samples
containing the microparticles were homogenized at
15,000rpm/5min using a Turrax mixer (T-18, IKA, Works do Brasil, RJ, RJ, Brazil) in accordance with DOHERTHY et al. (2011). The ZP determinations were repeated five times. Preliminary evaluations of the polysaccharide solutions or emulsions did not exhibit any differences in the zeta values.
Average size, size distribution, and polydispersity index The average size (D0.5) and size distribution
of microparticles without or with adsorbed proteins
the microparticle size below which 90% of the
distribution existed, D0.5 was the average diameter, and D0.1 was the microparticle diameter below which 10% of the distribution existed. The D0.5 corresponds
to averages of two independent repetions for the production of microparticles at each calcium level and three independent repetitions for adsorption of
protein at each pH value.The means size of each sample was measured six times. The same procedure
was used to calculate the polydispersity index.
Morphology of the moist microparticles
The morphology of the moist
microparticles with or without the adsorbed proteins
was observed using optical microscopy (BX4,
Olympus, Tokyo, Japan) using a 10× objective
lens. Images were acquired using a digital camera
(Q - Color 3, Olympus, Tokyo, Japan). Two light
sources were used, which included a conventional transmitted light source and an incident external
source produced using an optical fiber (model LGPS, light optical fiber, Olympus 9095, Tokyo, Japan) that
was directly focused onto the sample without contact
with manually adjusted height of 1 to 3cm, to allow the best focus. The latter strategy allows for a
three-dimensional depth discrimination in images, which improves the morphological evaluations.
Morphological evaluation of protein adsorption using Coomassie blue
Microparticles produced using 0.8, 1.6, and 2.4% w/w calcium solution, without or with ad-sorbed protein at pH 3.5 and 7.0, were stained for protein using Coomassie Brilliant Blue, according
to LAEMMLI (1970). Imaging of stained and after
discolored microparticles was performed using the operational conditions described above.
Statistical analyses
Results were evaluated by analysis of
variance (ANOVA) and the Tukey Test, with a 5% significance level, using the SAS program (Cary, NC, USA). With the exception of the morphological
evaluations, all the determinations were performed
using n ≥3 measurements.
RESULTS AND DISCUSSION
Physico-chemical characterization of biopolymers The CPS comprised 70.5±0.1% protein,
5.7±0.5% moisture, and 3.6±0.1% ash. The alginate
contained 10.8±0.2% moisture and 28.0±2.2% ash. The CPS protein content complied with Anvisa
RDC 268, de 23/09/2005, which stipulated that CPS should contain at least 68% protein (BRASIL, 2005). The high ash content can be justified by the usage of sodium alginate that was produced from alginic acid
(KELCO, 1987).
Production of soluble proteins from concentrated soy protein
Protein extraction from CPS was achieved
after preliminary studies involving filtration,
centrifugation, and decantation exhibited that
decantation alone was sufficient for separation of soluble protein; therefore, decantation was used to
extract proteins at pH 3.5 and 7.0.
The CPS solution was initially adjusted to pH
11 to maximize the protein solubility and the extraction based on a previously determined pH-dependent
solubility curve for soy proteins (SGARBIERI, 1996). Samples of this extract were further adjusted to either
pH 3.5 or 7.0 before protein adsorption on alginate
particles; 51.0±0.9% and 61.8±1.8% of the proteins
were soluble at pH 3.5 and 7.0, respectively.
Quantification of calcium in microparticles
The calcium content was highest (162.0mg/L) in microparticles that were processed
at the highest concentration, which was followed by the microparticles processed in 1.6% and 0.8%
solutions (142.7 and 137.3mg/L, respectively). These
results indicated that an increase in the calcium chloride concentration increased the calcium content of microparticles. Microparticles calcium content
did not differ significantly between the samples prepared in 0.8% and 1.6% w/w calcium solutions;
however, calcium levels differed between the samples prepared in 0.8% and 2.4% as well as 1.6%
and 2.4% w/w calcium. According to PATHAK et al. (2010), the higher the concentration of the calcium
chloride solution, the greater the gel surface packed arrangment, reducing the porosity and the intrusion volume of the microparticle.
ZPs of solutions and alginate microparticles with or without covered protein
The zeta potential of the alginate solution was negative (−79.6mV, pH 6.7) and similar to that observed in previous studies (−68mV at pH 7.0, ZHANG et al., 2016). This negative zeta value is
attributed to the dissociated carboxyl groups of guluronic and mannuronic acids that are present
respectively, which was also close to the previously
reported data (SANTIAGO et al., 2008).
The ZPs of alginate microparticles
were also measured at three different calcium
concentrations (0.8, 1.6, and 2.4% w/w) to evaluate
whether this factor is important for determining its
influence on the microparticle zeta potentials, and
the subsequent amount of protein adsorbed on the
microparticles at pH 3.5 and 7.0 (Table 1).
Microparticles without adsorbed proteins
exhibited ZPs of −18.6±0.3mV, -25.0±2.2mV, and −21.0±1.9mV at ~pH 6 in 0.8, 1.6, and 2.4% w/w calcium solutions, respectively, with significant differences between 0.8 and 1.6% of calcium (Table 1). YEUNG et al. (2016) obtained ZPs varying from −4.2 to −9.4mV for alginate microparticles encapsulating B.
infantis and from −2.6 to −4.4mV for microparticles
containing B. Longum. ZEEB et al. (2015) encapsulated one triglyceride (MIGLYOL® 812) using alginate
microparticles and a non-ionic surfactant (Tween 60) to
obtain zeta values of approximately −2.5, −10, −18, and −37 at pH 2, 5, 6, and 11, respectively. Our comparisons between the ZPs of uncoated microparticles in varying
concentrations of calcium (Table 1) demonstrated a substantial decrease in particle charge compared to the charge of polysaccharide solution, which indicated the ionic associations between the alginate carboxyl groups and calcium ions that have also been previously
reported (MAESTRELLI et al., 2008).
Although, microparticle without protein ZPs were much lower than those of the alginate solution (Table 1), there was no proportional change in the ZPs with an increase in the calcium concentrations.
It is possible that the calcium amount used was too
small to produce a significant proportional change in ZP of microparticles without the presence of adsorbed protein. In general, majority of the literature examples
have used calcium ion concentrations between 1 and 5% and alginate concentrations between 1 and 3%.
However, for the production of microparticles by ionic gelation, much higher concentrations have been used such as between 0.5 and 1.0% alginate and 10% Ca2 + (ZHANG et al., 2016).
At pH 7.0 (Table 1), the results of ZP
obtained for microparticles with protein were negative as obtained for samples without protein coating, as a consequence of negative charge presented by
soy protein at pH above the IP. Although, all the
microparticles coated with protein at pH 7.0 exhibited
negative ZP values and significant difference between 0.8; 1.6 and 2.4% of calcium, a proportional variation in the ZP values was not observed with increasing
concentrations of calcium ions.
Microparticles coated with protein at pH 3.5
(Table 1) had the lowest ZPs: 7.3±0.2mV, −9.6±0.7mV, and −17.4±1.2mV for the 2.4%, 0.8%, and 1.6%
Ca2+ solutions, respectively, showing significant differences. Only at the highest amount of calcium the ZP of microparticles was positive. At this pH value we expected to observe positive ZP values after coating (pH<IP). The negative values at lower calcium
concentrations could indicate that the concentration of
protein that was used was too low to allow sufficient
protein adsorption to overcome the remaining negative charges on the alginate microparticles.
Determination of the ZPs for large
microparticles can present problems while using electrophoretic measurements because the microparticles have to be in a colloidal state to ensure
mobility in the electric field during measurement. According to the manufacturer of the instrument that is used in this study (Zetasizer Nano-Z, Malvern
Instruments), the recommended microparticle size
limit is 10μm, which is much smaller than that of
the microparticles that are obtained in the present
study. Despite this restriction, previous studies have performed measurements for microparticle sizes having a same or greater order of magnitude using
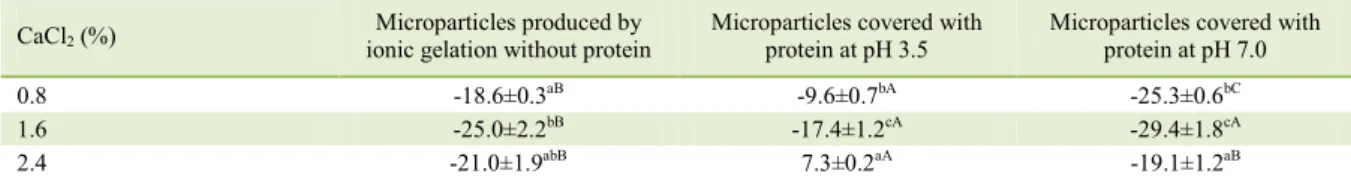
Table 1 – Zeta potencial of microparticles produced at different concentrations of calcium in solution.
CaCl2 (%) Microparticles produced by ionic gelation without protein
Microparticles covered with protein at pH 3.5
Microparticles covered with protein at pH 7.0
0.8 -18.6±0.3aB -9.6±0.7bA -25.3±0.6bC
1.6 -25.0±2.2bB -17.4±1.2cA -29.4±1.8cA
2.4 -21.0±1.9abB 7.3±0.2aA -19.1±1.2aB
Means followed by the same letter, lower cases in the column and capital letters in the same row do not differ statistically from each other
this instrument without performing any additional
treatments (ZHANG et al., 2016; ZEEB et al., 2015). As an alternative, we adopted the strategy used by DOHERTY et al. (2011), following the reduction of particle size after protein adsorption and before ZP determination. Although, deviations in measurements
that are obtained for microparticles with or without adsorbed protein are observed to be low, it is possible that the conditions used to disintegrate the microparticles did not allow a complete homogenization of the sample. Hence, this method requires further optimization for future investigations.
Composition of micropartícles covered with protein
The amount of protein adsorbed onto particles at pH 3.5 and 7.0, moisture content, and ash
content are presented in table 2. The particle moisture
contents were similar for all treatments, ranging
from 95 to 96%, without any significant differences for solutions of the same pH. The high microparticle water content can be justified by the high water
retention capacity of the alginate polysaccharide, which is structured in three-dimensional hydrophilic
networks (LIU et al., 2007). Particles had low ash
content, ranging from 0.26 to 0.49% at pH 7.0 and from 0.38 to 0.41% at pH 3.5.
The protein adsorption at different pH
3.5 or 7.0, relative to the amount of calcium in
microparticles (0.8; 1.6 and 2.4%, Table 2), is
practically constant and independent of the calcium
concentration in the solution, without significant
differences. However, the amount of calcium present in the microparticles increased as the amount of calcium in solution increased during the production of the microparticles.
Protein adsorption is a phenomenon that involves the chemical properties of the protein molecule and its different surface forces, including van
der Waals forces, hydrogen bonds, and, in particular, electrostatic and hydrophobic interactions (ROACH et al., 2005). CPS protein adsorption to alginate
microparticles was investigated as a function of the
solution pH (Table 2), and it was observed that protein
content at pH 3.5 was approximately 3.5 times higher than that obtained at pH 7.0, with values varying from 6.5 to 6.7% of adsorbed protein on microparticles,
db. These results demonstrated that the pH of the
medium at pH 3.5, at which the protein and alginate microparticles are positively and negatively charged,
respectively, favors the protein adsorption. Our results
indicated that electrostatic interactions are the most important factors for determining the total adsorbed protein. However, higher protein adsorption values have been obtained for globular animal proteins,
including egg albumin, ovalbumin/whey protein (1:1) and whey protein, which resulted in ~15%, ~16%, and ~20% of adsorption (w/w of microparticles, db) using more concentrated protein solutions (TELLO, 2015).
Results presented in table 2 exhibit that, even at pH 7, microparticles had approximately 2% of protein adsorption by weight when both proteins and microparticles exhibited a net negative charge.
MOLINA-ORTIZ al. (2004) studied the interactions
between soy protein and carrageenan and observed that complexes between proteins and polysaccharide were formed at both high and low pH values.
According to the authors, hydrophobic interactions
are the dominant interactions in complexes at high pH, whereas electrostatic interactions dominate at
low pH. Associations at high pH values, where both
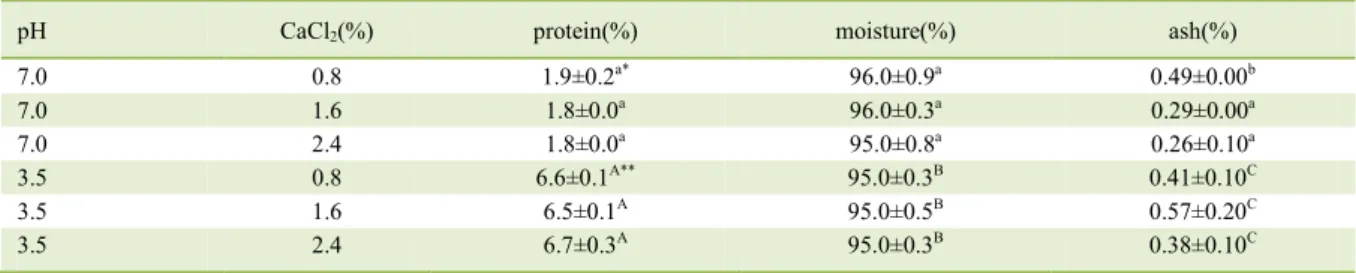
Table 2 - Content of moisture, protein and ash in the microparticles produced with different calcium concentration in solution and at
different pH values.
pH CaCl2(%) protein(%) moisture(%) ash(%)
7.0 0.8 1.9±0.2a* 96.0±0.9a 0.49±0.00b
7.0 1.6 1.8±0.0a 96.0±0.3a 0.29±0.00a
7.0 2.4 1.8±0.0a 95.0±0.8a 0.26±0.10a
3.5 0.8 6.6±0.1A** 95.0±0.3B 0.41±0.10C
3.5 1.6 6.5±0.1A 95.0±0.5B 0.57±0.20C
3.5 2.4 6.7±0.3A 95.0±0.3B 0.38±0.10C
*Means followed by different letters, lowercase letters in the same column, differ statistically from each other by the Tukey test at 5%
significance at pH 7.0 (P<0.05). **Means followed by different letters, capital letters in the same column, differ statistically from each
biopolymers exhibit negative charges, may occur via electrostatic interactions between positive fragments presented by proteins even in pH conditions above
their IP (KAYITMAZER et al., 2013).
Average size and size distribution and polydispersity index
The average sizes of alginate
microparticles with and without protein coating and an evaluation of the differences between their mean size and span index are presented in table 3. Notably, standard deviations are high for all the measurements due to the type of atomizer that is used. The use of
a double fluid atomizer allows for a decrease in the
average size of microparticles obtained by ionic gelation as compared to that obtained by formatting using syringes and needles of varied diameters. However, its design presents a high polydispersity
in drop formation; consequently, it also presents
a high polydispersity in the average sizes of the microparticles. Many parameters of the ionic gelation technique could interfere with the average size of microparticles such as the concentration and structure of polysaccharides, the diameter of the atomizer needle, and the distance of the needle to the calcium
chloride solution (SMRDEL et al., 2008).
The statistical analysis shown significant and non significant differences when calcium level was increased (Table 3). As the standard deviation was very high because the use of the double fluid atomizer, it is difficult to clearly observe the effect
of increase of calcium amount and the average size
produced. The same effect was observed with respect
to microparticles size with adsorbed protein compared
with microparticles without protein. Although, the
average size of microparticles increased with protein
adsorption, significant and no significant differences
were obtained. The treatment 2.4% Ca2+ solution at
pH 3.5 resulted in particles with a greater average diameter as compared to the other treatments.
Previous studies have reported similar sizes to those that are observed in this study using a double
fluid atomizer and similar conditions. Alginate-pectin
and alginate-egg protein microparticles produced by
ionic gelation at pH 3.5 had mean sizes of 261±19 and 287±10μm, respectively. Similarly, at pH 3.75,
uncoated and whey protein-coated microparticles
of 259±22 and 283±6μm have been observed (AGUILAR et al., 2015).
The polydispersity index (span index) (Table 3) were high and varied from 1.67 to 2.07,
1.82 to 2.16, and 1.72 to 2.16 for uncoated particles, coated particles at pH 3.5, and coated particles at 7.0, respectively.
Morphology of the moist microparticles and morphological evaluation of protein adsorption using Coomassie blue
Morphologies of the microparticles produced in solutions with varying calcium
concentrations (Figure 1), with and without protein
coating at pH 3.5 and 7.0 were visualized using Coomassie blue to identify if the protein was
adsorbed (Figure 2) and optical microscopy. These
images depicted that the microparticles obtained using different treatments were morphologically similar, with many microparticles possessing a
spherical or an oval shape. The interiors of the
particles were multinucleated, with the lipid material being homogeneously distributed throughout the microparticle’s length. It was also possible to observe
the presence of different microparticle sizes (large, medium, and small) in all the samples, corroborating
the high standard deviations obtained in case of the mean particle size and span index. In addition to analyzing the external structure of microparticles,
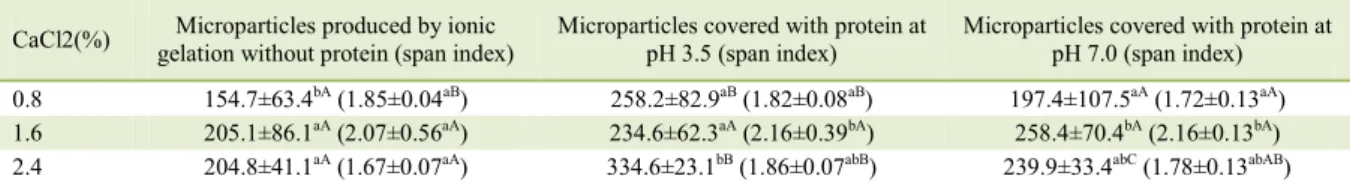
Table 3 - Average size (D0.5µm) and (span index) of microparticles without and with proteins produced with different calcium
concentration in solution and at different pH values.
CaCl2(%) gelation Microparticles produced by ionic without protein (span index) Microparticles covered with protein at pH 3.5 (span index) Microparticles covered with protein at pH 7.0 (span index)
0.8 154.7±63.4bA(1.85±0.04aB) 258.2±82.9aB(1.82±0.08aB) 197.4±107.5aA(1.72±0.13aA)
1.6 205.1±86.1aA(2.07±0.56aA) 234.6±62.3aA(2.16±0.39bA) 258.4±70.4bA(2.16±0.13bA)
2.4 204.8±41.1aA(1.67±0.07aA) 334.6±23.1bB(1.86±0.07abB) 239.9±33.4abC(1.78±0.13abAB)
Means followed by different letters, lower case letters in the same column and capital letters in the same row differ statistically from each
evaluation of the distribution of active materials encapsulated in their interior is important because
this may influence functional characteristics
such as permeability, integrity, microparticle digestibility, and active compound release (JONES &
MCCLEMENTS, 2010). Visually, the surfaces of all
the microparticles were smooth with no porosity or apparent discontinuity. Hence, the protein adsorption
(Figure 2) did not modify the characteristic sphericity
of the particle.
The light microscopy results clearly demonstrated a significant improvement in the quality
of the morphological observations while using the
light generated by an optical fiber as compared to that
observed while using the transmitted light generated
by a conventional light source. This approach also
allowed us to observe samples with a depth resolution similar to that achieved using scanning electron
microscopy (SEM). However, unlike SEM, which
requires sample dehydration and can, therefore, produce undesirable changes in microparticle morphology, which is followed by conductive coating prior to observation, our method can be performed using wet microparticles without any additional preparation using a conventional optical microscope.
Changes in microparticle morphology may occur as a function of the strength and intensity of electrostatic interactions between biopolymer solutions, which affects the microparticle swelling
(JONES &McCLEMENTS, 2010). In the present
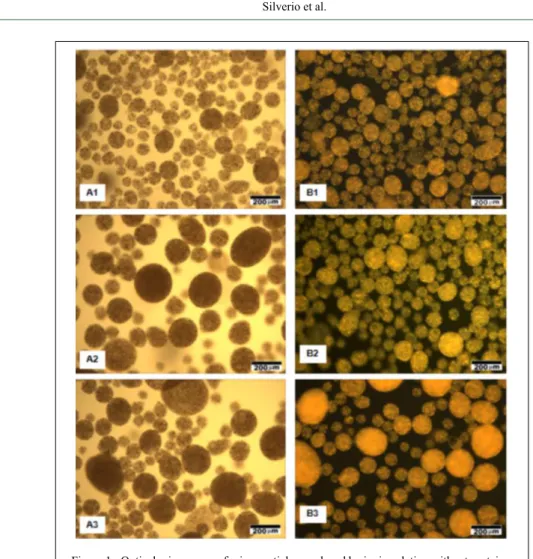
study, microparticles remained intact in all the assays, which are evident from their retained smooth Figure 1 - Optical microscopy of microparticles produced by ionic gelation without protein.
surfaces, even after incorporation of the soybean
protein layer (Figure 2). Optical micrographs were similar to those presented by DOHERTY et al. (2012), who obtained microparticles with
a continuous and visually smooth surface while producing alginate microcapsules with subsequent electrostatic deposition of a whey protein layer.
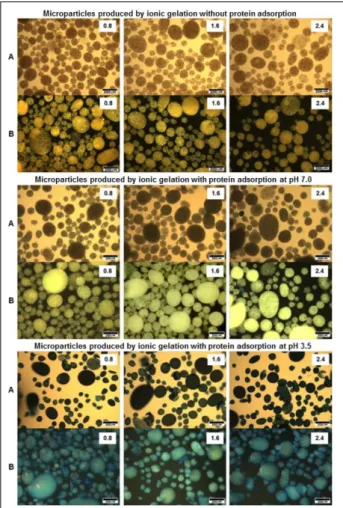
Protein adsorption onto microparticles, indicated by Coomassie Blue staining, can be clearly
observed in figure 2. Using conventional light
microscopy, we observed uncoated microparticles with typical orange coloration after destaining due to paprika oleoresin. It is possible to observe the distribution of droplets in the emulsion due to the low opacity of
particles (Figure 2 microparticles without protein adsorption, A). Protein coating at pH 7.0 resulted in low
protein adsorption, shown an increase of opacity making
it difficult to observe the distribution of the encapsulated material (Figure 2 with protein adsorption at pH 7, A).
Protein coating at pH 3.5 at which the highest protein adsorption was observed exhibited a marked increase of opacity and an more intense blue color on the surface
of particles (Figure 2, protein adsortion at pH 3.5, A). These effects can also be observed at a higher resolution
and with an increase in image depth when an optical
fiber is used as the light source (Figure 2 without protein
adsorption B, with protein adsorption at pH 7.0 B and
with protein adsorption at pH 3.5 B).
Figure 2 - Micrographs of microparticles stained with coomassie
blue and discolored according LAEMMLI, (1970).
Optical microscopy: A - using conventional light
transmitted source and B - using an incident light
source produced by an optical fiber at different
CONCLUSION
Protein adsorption caused an increase
in the mean microparticle size; however, without significant differences compared with microparticles without protein adsorption. Alginate microparticles
and microparticles with adsorbed protein, showed a multinuclear distribution along the length of the microparticles. Microparticles coated with soy protein
exhibited continuous and visually smooth walls. A
high microparticle protein adsorption was observed at pH 3.5 at which the microparticle produced by ionic gelation and protein exhibited opposite charges.
This effect was minimized when the adsorption pH
was 7.0 at which both the microparticles produced by ionic gelation and proteins exhibited negative charges, which prevented electrostatic interactions as a mechanism of protein adsorption. Concentrations of the calcium ions varied while producing the
microparticles; however, an increase in the calcium
ion concentration during ionic gelation had no effect
on protein adsorption. The use of Coomassie staining
for qualitative observations allowed us to quickly
verify whether protein adsorption occurred. A fiber optic light source was used to detect a significant
improvement in the quality of morphological observations, and it is possible to couple this method with several different types of optical microscopes.
DECLARATION OF CONFLITING INTERESTS
The authors declare no conflict of interest. The founding sponsors had no role in the design of the study; in the collection, analyses, or interpretation of data; in the writing of the
manuscript, and in the decision to publish the results.
ACKNOWLEDGMENTS
The authors are grateful to FMC Biopolymers (Campinas, SP, Brazil) for the alginate PROTANAL RF 6650 and to Bremil (Arroio do Meio-RS, Brazil) for the soy protein
concentrated.
AUTHORS’ CONTRIBUTIONS
Gabriela Barros Silverio did the experiments and Izabela Dutra Alvim did the size measurements of the microparticles and the morphological evaluations. All authors contributed equally for the conception and writing of the manuscript. All authors critically revised the manuscript and approved of the final version.
REFERENCES
AGUILAR, K. C. et al. Protein adsorption onto alginate-pectin
microparticles and films produced by ionic gelation. Journal of
Food Engineering, v. 154, p. 17–24, 2015. Available from: <http:// linkinghub.elsevier.com/retrieve/pii/S0260877414005494>.
Accessed: Jul. 25, 2018. doi: 10.1016/j.jfoodeng.2014.12.020.
AOAC. Association of Official Analytical Chemists.Official
methods of analysis. 18th Ed.,Maryland, MD, USA, 2006.
BAJPAI, S.K.; TANKHIWALE, R. Preparation, characterization and preliminary calcium release study of floating sodium alginate/
dextran-based hydrogel beads: part I. Polymer International, v.57, p.57-65, 2008. doi: 10.1002/pi.2311.
BRASIL. Resolução RDC ANVISA/MS no 268, de 22 de
setembro de 2005. Regulamento técnico para produtos proteicos de origem vegetal, 2005. Available from:
<http://pesquisa.in.gov.br/imprensa/jsp/visualiza/index. jsp?jornal=1&pagina=371&data=23/09/2005>. Accessed: Jul.
25, 2018.
BUREY, P. et al. Hydrocolloid gel particles: formation,
characterization, and application. Critical Reviews in Food Science and Nutrition, v.48, n.5, p.361–377, 2008. Available
from: <https://doi.org/10.1080/10408390701347801>. Accessed: Jul. 26, 2018. doi: 10.1080/10408390701347801.
CHAMPAGNE, C. P.; FUSTIER, P. Microencapsulation for
the improved delivery of bioactive compounds into foods. Current Opinion in Biotechnology, v.18, n.2, p.184–190,
2007. Available from: <https://www.sciencedirect.com/science/ article/pii/S0958166907000328>. Accessed: Jul. 25, 2018. doi: 10.1016/j.copbio.2007.03.001.
DESAI, K. G. H.; PARK, J. H. Recent developments in
microencapsulation of food ingredients. Drying Technology, v.23,
n.7, p.1361–1394, 2005. Available from: <https://doi.org/10.1081/ DRT-200063478>. Accessed: Jul. 25, 2018. doi:
10.1081/drt-200063478.
DOHERTY, S. B. et al. Development and characterisation of
whey protein micro-beads as potential matrices for probiotic protection. Food Hydrocolloids, v. 25, n. 6, p. 1604–1617, 2011.
Available from: <https://www.sciencedirect.com/science/article/pii/ S0268005X1000295X>. Accessed: Jul. 25, 2018. doi: 10.1016/j.
foodhyd.2010.12.012.
DOHERTY, S. B. et al. Application of whey protein
micro-bead coatings for enhanced strength and probiotic protection
during fruit juice storage and gastric incubation. Journal of
Microencapsulation, v.29, n.8, p.713–728, 2012. Available from:
<https://doi.org/10.3109/02652048.2011.638994>. Accessed: Jul.
25, 2018. doi: 10.3109/02652048.2011.638994.
DRAGET, K.I. et al. Alginates.In: STEPHEN, A.M., PHILLIPS,
G.O., WILLIAMS, P.A. Food polysaccharides and their
applications, Boca Raton, CRC Press, 2006. Chapter 9, p.289-334.
EMBRAPA. A soja no Brasil. 2004. Available from: <http://www.
cnpso.embrapa.br/producaosoja/SojanoBrasil.htm>. Accessed:
Sep.14,2016.
FARRIS, S. et al. Development of polyion-complex hydrogels as an
alternative approach for the production of bio-based polymers for food packaging applications: a review. Trends in Food Science & Technology, v.20, n.8, p.316–332, 2009. Available from: <https://www. sciencedirect.com/science/article/abs/pii/S0924224409001538>.
GOUIN, S. Microencapsulation: industrial appraisal of existing
technologies and trends. Trends in Food Science & Technology,
v.15, n.7–8, p.330–347, 2004. Available from: <https://www.
sciencedirect.com/science/article/abs/pii/S0924224403002723>.
Accessed: Jul. 25, 2018. doi: 10.1016/j.tifs.2003.10.005.
JAFARI, S. M. et al. Encapsulation efficiency of food flavours and oils
during spray drying. Drying Technology, v.26, n.7, p.816–835, 2008.
Available from: <https://doi.org/10.1080/07373930802135972>. Accessed: Jul. 26, 2018. doi: 10.1080/07373930802135972.
JONES, O. G.; McCLEMENTS, D. J. Functional
biopolymer particles: design, fabrication, and applications. Comprehensive Reviews in Food Science and Food Safety,
v.9, n.4, p.374–397, 2010. Available from: <https://doi.org/10. 1111/j.1541-4337.2010.00118.x>. Accessed: Jul. 26, 2018. doi: 10.1111/j.1541-4337.2010.00118.x.
KAYITMAZER, A. B. et al. Protein–polyelectrolyte interactions.
Soft Matter, v.9, n.9, p.2553–2583, 2013. Available from: <http://
dx.doi.org/10.1039/C2SM27002A>. Accessed: Jul. 26, 2018. doi:
10.1039/c2sm27002a.
KELCO. Alginate products for scientific water control, San
Diego: Kelco, 1987. 35p.
KRASAEKOOPT, W et al. Evaluation of encapsulation techniques
of probiotics for yoghurt. International Dairy Journal, v.13, n.1,
p.3–13, 2003. Available from: <https://www.sciencedirect.com/ science/article/pii/S0958694602001553?via%3Dihub>. Accessed: Jul. 26, 2018. doi: 10.1016/s0958-6946(02)00155-3.
LAEMMLI, U. K. Cleavage of structural proteins during the assembly
of the head of bacteriophage T4. Nature, v.227, n.5259, p.680–685,
1970. Available from: <http://dx.doi.org/10.1038/227680a0>. Accessed: Jul. 26, 2018. doi: 10.1038/227680a0.
LIU, L. et al. Pectin in controlled drug delivery – a review.
Cellulose, v.14, n.1, p.15–24, 2007. Available from: <https://doi.
org/10.1007/s10570-006-9095-7>. Accessed: Jul. 26, 2018. doi:
10.1007/s10570-006-9095-7.
MAESTRELLI, F. et al. Development of enteric-coated calcium
pectinate microspheres intended for colonic drug delivery. European Journal of Pharmaceutics and Biopharmaceutics,
v.69, n.2, p.508–518, 2008. Available from: <https://www.
sciencedirect.com/science/article/abs/pii/S0939641107004055>.
Accessed: Jul. 26, 2018. doi: 10.1016/j.ejpb.2007.12.004.
MESTDAGH, M.M; AXELOS, M.S.V. Physico-chemical
properties of polycarboxylate gel phase and their incidence on the retention/release of solutes. Biopolymer Science: Food and Non-food Applications, Montpellier, p.303-314, 1998.
MOLINA-ORTIZ et al. Relationship between structural changes
and functional properties of soy protein isolates–carrageenan systems. Food Hydrocolloids, v.18, n.6, p.1045–1053, 2004.
Available from: <https://www.sciencedirect.com/science/article/ pii/S0268005X04000505>. Accessed: Jul. 26, 2018. doi: 10.1016/j.
foodhyd.2004.04.011.
MUKAI-CORREA, R. et al. Controlled release of protein from
hydrocolloid gel microbeads before and after drying. Current Drug Delivery, v.1, n.3, p.265–273, 2004. Available from: <http://
www.eurekaselect.com/node/62733/article>. Accessed: Jul. 25,
2018. doi: 10.2174/1567201043334803.
PATHAK, T. S. et al. Effect of calcium ion (cross-linker)
concentration on porosity, surface morphology and thermal
behavior of calcium alginates prepared from algae (Undaria
pinnatifida). Carbohydrate Polymers, v.81, n.3, p.633–639,
2010. Available from: <http://www.sciencedirect.com/science/ article/pii/S0144861710001943>. Accessed: Jul. 27, 2018. doi:
10.1016/j.carbpol.2010.03.025.
ROACH, P et al. Interpretation of protein adsorption:
surface-induced conformational changes. Journal of the American Chemical Society, v.127, n.22, p.8168–8173, 2005. Available
from: <https://doi.org/10.1021/ja042898o>. Accessed: Jul. 27, 2018. doi: 10.1021/ja042898o.
SANTIAGO, L. G. et al. Adsorption of soy protein isolate at
air–water and oil–water interfaces. Colloids and Surfaces A: Physicochemical and Engineering Aspects, v.323, n.1–3, p.155–
162, 2008. Available from: <https://www.sciencedirect.com/ science/article/pii/S0927775707009648>. Accessed: Jul. 26, 2018. doi: 10.1016/j.colsurfa.2007.11.001.
SCHOUBBEN, A. et al. Development of a scalable procedure for
fine calcium alginate particle preparation. Chemical Engineering
Journal, v.160, n.1, p.363–369, 2010. Available from: <https:// www.sciencedirect.com/science/article/pii/S1385894710002068>.
Accessed: Jul. 26, 2018. doi: 10.1016/j.cej.2010.02.062.
SGARBIERI, V. C. Proteínas em alimentos proteicos:
propriedades, degradações, modificações. São Paulo: Varela,
517p., 1996.
SMRDEL, P. et al. The influence of selected parameters on the
size and shape of alginate beads prepared by ionotropic gelation. Scientia Pharmaceutica, v.76, n.1, p.77–89, 2008. doi: 10.3797/ scipharm.0611-07.
SRIAMORNSAK, P.; KENNEDY, R. A. Swelling and diffusion studies of calcium polysaccharide gels intended for film coating.
International Journal of Pharmaceutics, v.358, n.1–2, p.205–
213, 2008. Available from: <https://www.sciencedirect.com/ science/article/pii/S0378517308002093>. Accessed: Jul. 26, 2018. doi: 10.1016/j.ijpharm.2008.03.009.
TELLO, F. et al. Alginate and pectin-based particles coated
with globular proteins: production, characterization and anti-oxidative properties. Food Hydrocolloids, v.43, p.670–678,
2015. Available from: <https://www.sciencedirect.com/science/ article/pii/S0268005X14002720>. Accessed: Jul. 26, 2018. doi: 10.1016/j.foodhyd.2014.07.029.
VELASQUEZ, M. T.; BHATHENA, S. J. Role of dietary
soy protein in obesity. International Journal of Medical Sciences, v.4, n.2, p.72–82, 2007. Available from: <http://
www.ncbi.nlm.nih.gov/pubmed/17396158>. Accessed: Jul.
26, 2018.
WANDREY, C. et al. Materials for encapsulation. In: ZUIDAN,
N.J., NEDOVIC, V.A. Encapsulation technologies for active
food ingredients and food processing. New York: Springer,
2010. Chapter 3, p31-100. Available from: <http://link.springer. com/10.1007/978-1-4419-1008-0>. Accessed: Jul. 26, 2018. doi:
10.1007/978-1-4419-1008-0.
YEUNG, T. W. et al. Microencapsulation in alginate and
chitosan microgels to enhance viability of Bifidobacterium
2016. Available from: <http://www.ncbi.nlm.nih.gov/pmc/ articles/PMC4835488/>. Accessed: Jul. 26, 2018. doi: 10.3389/
fmicb.2016.00494.
ZEEB, B. et al. Retention and release of oil-in-water emulsions from filled hydrogel beads composed of calcium alginate:
impact of emulsifier type and pH. Soft Matter, v.11, n.11,
p.2228–2236, 2015. Available from: <http://dx.doi.org/10.1039/
C4SM02791D>. Accessed: Jul. 26, 2018. doi: 10.1039/
c4sm02791d.
ZHANG, Z. et al. Protein encapsulation in alginate hydrogel beads:
Effect of pH on microgel stability, protein retention and protein release. Food Hydrocolloids, v.58, p.308–315, 2016. Available from: <http://
www.sciencedirect.com/science/article/pii/S0268005X16300935>.