Development and Evaluation of a Controlled Release System of TBH Herbicide Using
Alginate Microparticles
Daniela Macedo Fariaa, Sidney Macias Dourado Júniora, João Pedro Lopes do Nascimentoa, Eloiza
da Silva Nunesa, Renata Pereira Marquesb, Luciana Sgarbi Rossinoc,d, Jéferson Aparecido Moretoa,e*
Received: June 10, 2016; Revised: October 17, 2016; Accepted: November 21, 2016
The development of controlled delivery system formulations has received increasing interest in the agriculture area. Tebuthiuron (TBH) is the most commonly used herbicide for weed control in sugar cane and cotton crops. The TBH and some of its metabolites are detected in surface water by leaching
process, evidencing contamination and the need for an eicient process to decrease pesticide residues.
The development of a controlled system release appears as a good solution. The present investigation aimed to study the development and evaluation of alginate microparticles as a delivery system for the TBH. The calcium alginate microparticles were prepared from the crosslinking of sodium alginate by Ca++ containing varied amounts of TBH supplied in CaCl
2 aqueous solution. The particle size and morphological analysis of microparticles were determined by optical microscopy (OM) and by ield emission gun scanning electron microscopy (FEG-SEM). The encapsulation eiciency and release of
TBH studies was accessed by UV-vis spectroscopy. The results show that the polymeric microparticles containing TBH can be obtained successfully through a simple method and is suitable as a controlled
release carrier system for herbicides and can be efective for controlling weeds.
Keywords: Biodegradable Polymer, Weed control, Microencapsulation, Controlled release
* e-mail: [email protected]
1. Introduction
Agrochemicals have become the product class most widely encountered in surface and subterranean hydrological systems worldwide, due to their extensive use in agriculture and in urban areas1. Currently, there is a great concern for
environmental preservation, where the contamination of water is one of the major problems of the degradation of the environment by human activity in the world2. Several
technologies have been proposed in order to minimize the spread of agrochemicals in the environment, among them are nanoparticulate3 and microparticulate4 systems designed
to provide controlled release such class of compounds. Tebuthiuron (TBH) is one of herbicides most used on sugar cane in the states of São Paulo5 and Goiás in Brazil
for weed control. TBH is a substituted urea herbicide with chemical name N-[5-1,1-dimethylethyl)-1,3,4-thiadizol-2yl]-NN’ dimethylurea and molecular structure show in Figure 1. This herbicide is selective recommended for the weed control
in the sugar cane crop and applied in pre-emergence. Some of its metabolites were detected in surface water in the city of Ribeirão Preto, São Paulo, evidencing contamination and
the need for an eicient process to remove pesticide residues
from the environment6.
Controlled release systems have also been applied extensively in the food and pharmaceutical industries for the release of active substances such as nutrients, drugs and aromas4,7. Thus, polymeric microparticles have emerged
among the new technologies under study as a potential alternative for the development of release system in agriculture. Silva et al.1 studied the paraquat-loaded alginate/chitosan
nanoparticles for soil sorption. The results of this survey showed new perspectives for using biopolymer membranes (particularly alginate and chitosan/alginate) for remediation of areas contaminated with herbicides2.
According to MIGNON et al.8, alginate is a linear copolymer
composed of mannuronic and guluronic acid, covalently linked in varying sequences and blocks and is commercially available as a sodium salt (Na-Alg). Interestingly, when
a Federal Institute Goiano – IF Goiano, Rodovia Sul Goiana Km 01, Zona Rural, Zip code 75.901-970,
Rio Verde, GO, Brazil
b Rede Arco Norte, Federal Institute Goiano – IF Goiano, Rodovia Sul Goiana Km 01, Zona Rural, Zip
code 75.901-970, Rio Verde, GO, Brazil
c Sorocaba Technological College – FATEC, Av. Engenheiro Carlos Reinaldo Mendes, 2015, Alto da
Boa Vista, Zip code 18013-280, Sorocaba, SP, Brazil
d Federal University of São Carlos – UFSCar, Rodovia João Leme dos Santos, Km 110, Bairro do
Itinga, Zip code 18.052-780, Sorocaba, SP, Brazil
e Institute of Exact Sciences, Naturals and Education, Federal University of Triângulo Mineiro – UFTM,
In the present work the commercial herbicide (Combine®), whose formulation has 500 g.L-1 of TBH were used for the
encapsulation in the alginate microparticles. One of its main features is its long persistence in soil and its high solubility in water 2.500 mg.L-1 to 20 °C. The herbicide analytical
grade used was the TBH (PESTANAL® Sigma-Aldrich) with molecular mass 228.31 g.mol-1, whose KOW is 6.17
X 1001 at pH 7 to 20ºC, registered under CAS 34014-18-1.
All other materials were at least of analytical grade and used
without previous puriication.
2.2. Preparation of bare- and TBH- loaded
alginate microparticles
The apparatus used in this work was built on the basis a scheme presented by Dias et al.10 and Shi et al.11.
Previously, solutions of sodium alginate (1, 2 and 3% m/v) and concentrations of 0.1, 0.3 and 0.5 mol·L-1 of CaCl
2 were
prepared. Subsequently, sodium alginate solution was dropped in CaCl2 solution, resulting in a total of 100 microparticles for each concentration used. After, the microparticles were
iltered using a Buchner funnel and cleaned with distilled
water. The obtained microparticles were divided in two portions, one was stored in deionized water and the other was dried in oven at 35 °C for 24 h. The number of microparticles
was obtained by counting the number of drops of alginate solution deposited into the CaCl2 solution. Each drop acts as a reactor originating one single microparticle.
In order to improve the texture and roundness of the microparticles the alginate solutions was adjusted to 0.1 mol·L-1 of sodium chloride and new batches of microparticles
were prepared by using the same set of conditions (alginate, CaCl2 concentrations and storage) as described above. The microparticles stored in deionized water passed through a process of water exchange for a period of 3 days. This procedure was adopted in order to withdraw the greatest possible quantity of NaCl at the calcium alginate microparticles. For TBH encapsulation into alginate microparticles, desired amounts of combine (4 g·L-1, 6 g·L-1 and 8 g·L-1)
were added to a freshly prepared 3 % (m/v) alginate solution. The TBH-loaded microparticles were obtained by dropping this solution in 0.1 mol·L-1 CaCl
2 and isolated as described above. The encapsulation eiciency of TBH was measured
by the amount of herbicide remaining in the supernatant.
2.3. Characterization of the alginate microparticles
The dried microparticles of calcium alginate were photographed using a scanner (MFP HP Deskjet Ink Advantage 1516). This procedure can be used to decrease the image distortion as cited by Mendoza-Muñoz et al.12.
The dried microparticles of alginate were analyzed by optical microscopy (OM) and scanning electron microscopy Figure 1: Molecular structure for the THB herbicide.
Figure 2: Representation of Na+ and Ca2+ ions interacting with
alginate chais (a) Na-Alg and (b) Ca-Alg.
NaAlg is combined with multivalent cations such as calcium (originating from salts such as calcium chloride, CaCl2), a physically cross-linked network is formed, which becomes insoluble in water. Figure 2present the chemical structures of Na-Alg and Ca-Alg. Sodium alginate is natural polymer, non-toxic, biodegradable, biocompatible and pH sensitive9.
Several works used sodium alginate as encapsulant of protein and living cells due to its good biocompatibility, gelation in mild conditions and a relatively inert matrix. The aim of this work is to prepare and characterize a new delivery system for TBH herbicide using polymeric microparticles of alginate.
2. Experimental
2.1. Materials
The biopolymer sodium alginate were purchased from Sigma -Aldrich with molecular weight (M/W) of 100.000 g.mol-1, viscosity of 15-20 cP, 61% of mannuronic acid and
(SEM). The methodology used to prepare the samples to OM and SEM comprises classic methodologies in the material science area. For SEM analysis the microparticles were
aixed on the stub and the sputtering was carried out with Au.
The average diameter of the dried calcium alginate microparticles was measured by digital image analysis and the polydispersity distribution curves were obtained using ImageJ
software. A number of 800 calcium alginate microparticles were used to make the polydispersity distribution.
2.4. TBH release experiments
Prior to encapsulating the TBH herbicide in the alginate
microparticles it was veriied by ultraviolet–visible spectroscopy
(UV-Vis) technique the absorbance of Combine® herbicide when compared to the active ingredient. Following the same procedure was adopted for combined solution of the commercial herbicide and sodium alginate. For this, we used a spectrophotometer PerkinElmer Lambda 750 in the range
200 – 800 nm. The determination of TBH concentration to calculate the encapsulation eiciency and the release
experiments was performed by monitoring the absorbance of TBH at 253 nm.
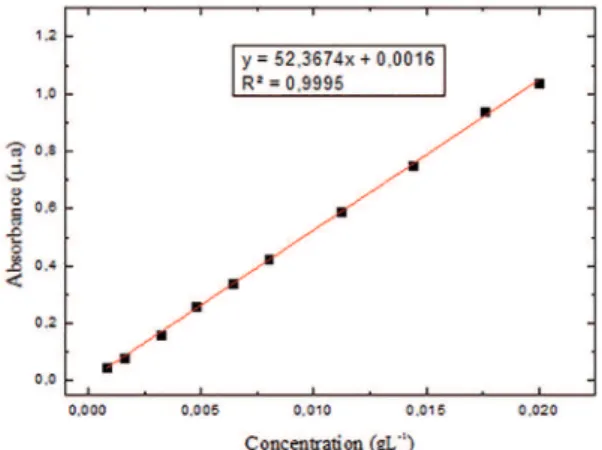
The TBH analytical curve was obtained by preparing aqueous solutions of TBH analytical grade varying the herbicide concentration from 0.0008 g.L-1 to 0.02 g.L-1 and
then measuring the absorbance at 253 nm. The absorbance
versus concentration data was adjusted using a
minimum-square method to obtainment of the best it as can be seen
in Figure 3.
homogenized at diferent time intervals: 5, 10, 15, 20, 30, 60, 120 min and after the irst hour the removal was realized
once per hour. After each removal, the same volume was replaced with deionized water.
All release assays was performed in dilution conditions.
The encapsulation eiciency (% EE) was evaluated by the diference of the amount of herbicide added in the alginate
+ TBH solution and the unentrapped amount of TBH remaining in the supernatant after the removal of the formed microparticles, following the equation:
Figure 3: Analytical curve obtained by preparing aqueous solutions of TBH herbicide.
For the controlled release experiment, 40 mg of dried TBH-loaded alginate microparticles were mixed with 20 mL of deionized water in an Erlenmeyer and let stand at room temperature. The initial pH was 5.5 and did not change
signiicantly during the course of the experiment. Aliquots
of 2 mL were withdrawn from the solution previously
%
/ * % ( ) EE encapsulation efficiency
TBH added free unentrapped TBH THB added 100 1 =
-Q R W V
" %
2.5. Mathematical models
To understand the agrochemical release system, mathematical models were used in the present work. To analyze the controlled release behavior of the TBH herbicide from the alginate microparticles the Korsmeyer-Peppas, Higuchi,
Baker –Lonsdale, Weibull and Hopfenberg models were
performed. Follows a brief description of each mathematical models used in this study:
- Korsmeyer-Peppas model: The Korsmeyer-Peppas model13 is described by:
( )
M M
Kt 2
t = n
3
Where, Mt/M∞ is the proportion of compound released in the time t, K is the kinetic constant, and n is the exponent
which relects the type of release mechanism. The
Korsmeyer-Peppas proposed that values of n ≤ 0.43 are indicative of
release mechanisms that follow Fick’s law. The Fick’s law, which were developed by Adolf Fick in the 19th century relates that the molar lux due to difusion is proportional to
the concentration gradient (First law) and the rate of change of concentration at a point in space is proportional to the second derivate of concentration with space (second law).
The irst law in a modern mathematical form can be write as:
( )
N
i=-
D C
d
i3
Where for species i, Ni is the molar lux (mol.m2.s-1), D i is the difusion coeicient (m2.s-1), and C
i is the concentration (mol.m -3).
The Fick’s second law can be represented as:
( )
c
D
C
4
t i i i 2
2
2
d
=
In this case, we can assume that Di is a constant, which is only true for dilute solution. While, n > 0.85 (equation 1) indicates that the mechanism are governed by relaxation
processes of the polymeric matrix, deined as case II type transport. Intermediate values 0.43 ≤ n ≤ 0.85 suggest
anomalous behavior with non-Fickian release (combination
- Higuchi Model: The Higuchi Model is based on the
quantiication of drug release derived from a very simple
equation as described below:
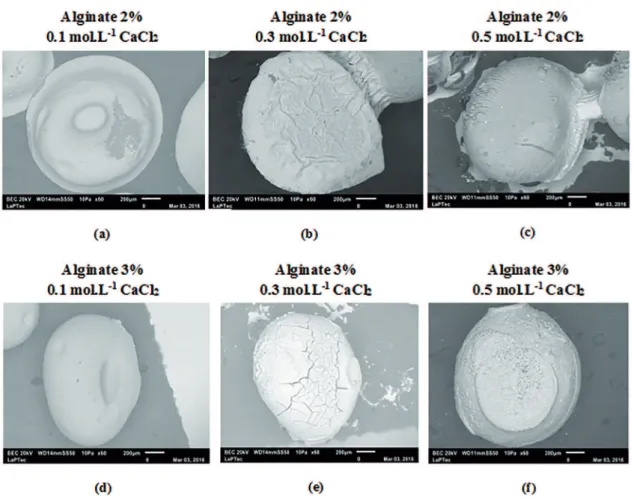
alginate. It is important to mention that the 1% (m/v) concentration of sodium alginate did not lead to obtaining of microspheres. As can be seen by optical microscopy the best results were obtained at 3% alginate using 0.1 mol.L-1
CaCl2 concentration, since, there was no tail formation. The results obtained in this work corroborate with the studies carried out by Strand et al.16 and Burey et al.17. According to
the authors the best microspheres are obtained with higher sodium alginate concentrations 13,17.
Figure 5 presents OM images of calcium alginate microparticles with sodium chloride. According MCCONAUGHY
et al.18 and STRAND et al.16 the presence of NaCl promotes a signiicant increase of the ionic force, leading to lowering values of zeta potential. In order, to verify the inluence of NaCl
on the alginate microparticles the last procedure was carried out in 3% (m/v) of alginate using 0.1 mol.L-1 CaCl
2. It was
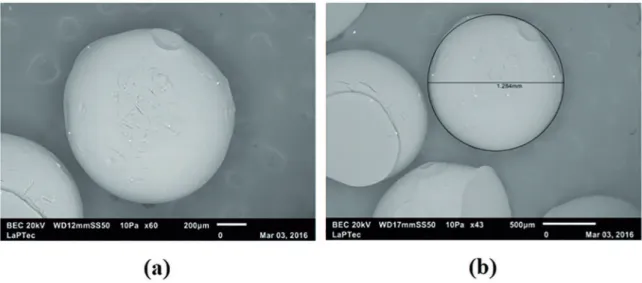
observed that the addition of NaCl promoted the formation of regular microparticles and suitable distribution of sizes. In addition, it was observed that the presence of NaCl promoted an increase in the diameter of the microparticles. Probably the drop sphericity is caused by increased interfacial tension. Figure 6 presents the polydispersity curve of dried alginate microparticles (3% m/v of alginate) with and without NaCl (0.1 % m/v) using 0.1 mol·L-1 CaCl
2. As can
be seen, the alginate microparticles with NaCl showed a narrow polydispersive curve when compared to alginate microparticles without NaCl. The medium radius of the alginate microparticles with NaCl presented 4.75 % higher than alginate microparticles without NaCl. On the other hand, the medium circumference of alginate microparticles with NaCl showed about 8% better results when compared to microparticles without NaCl. Thus, the addition of NaCl during the alginate microparticles preparation appears as a critical parameter that should be considered to improve the uniformity of the microparticles. SEM micrographs of calcium alginate microparticles for 2 and 3% (m/v) concentrations
of sodium alginate in diferent concentrations of CaCl2
are shown in Figure 7. The SEM micrographs of calcium alginate microparticles for 3% (m/v) + 0.1 mol.L-1 CaCl
2 +
NaCl are present in Figure 8.
Figure 9show images obtained by optical microscope of the alginate microparticles prepared in the presence of
NaCl and diferent concentrations of herbicide, named
as: 4, 6 and 8 g.L-1. Figure 10presents the polydispersity
curves of dried alginate microparticles prepared with NaCl
for diferent concentration of herbicide. The analysis of the polydispersity curves for the diferent concentrations of herbicide showed the inluence of concentration in the
quality of the microparticles. The medium circumferences of dried alginate microparticles + herbicide + NaCl were (e.g. 0.8299 mm for 4 g.L-1, 0.8395 mm for 6 g.L-1 and
0.8137 mm for 8 g.L-1.
The SEM micrographs were analyzed to determine and
compare the size distribution proiles of the diferent calcium
( )
f
K
t
/5
t h 1 2
=
Q
V
Q
V
As can be seen, Higuchi Model describes the release of the TBH herbicide as the square root of time based on the
Fickian difusion. Where KH is the constant relecting the
design variable of the system 14.
- Baker –Lonsdale Model: This model was developed
by Baker and Lonsdale (1974) from the Higuchi model and described the drug release from spherical matrices 15.
Equation 6 has been used to the linearization of release data from several formulations of microcapsules or microspheres.
( )
M
M
M
M
K
2
3 1 1
t / t6
t 2 3
-
-
=
3 3 T Y#
&
Where:Mt is the drug release amount at time t
M∞ is the amount of drug released at an ininite time K is the release constant which corresponds to the slope of the graph when plotted as [d(Mt / M∞)] / dt with respect to the root of time inverse.
- Weibull Model: This model has been described for
diferent dissolution processes as described by the equation 7.
Weibull model also has two constants, a (time factor) and b (related to the shape of the release curve). The constant b can be correlated to the exponent n of Korsmeyer-Peppas model.
( )
M
M
1
e
a7
t T
0
b
=
"
-
-Q- V%
In this equation, M is the amount of drug dissolved as a function of time t, M0 is total amount of drug being released and T accounts for the lag time measured as a result of the dissolution process.
- Hopfenberg model: The mathematical model developed by Hopfenberg correlates the release of active compound from surface-eroding devices with several geometries as
lat, cylindrical and spherical. The Hopfenberg model can
be described by equation 8.
/
( )
M
M
t1
1
k t C a
8
Ln
0
= -
-3
!
$
According to SUVAKANTA et al.15, k
0 is the zero order
rate constant describing the polymer degradation (surface erosion) process, CL is the initial drug loading throughout the system, a is the systems half thickness and n is an exponent that varies with geometry.
3. Results and discussion
Figure 4: Images obtained by optical microscopy of dried alginate microparticles at diferent concentrations of CaCl2.
Figure 5: Images obtained by optical microscopy of dried alginate microparticles at 3% alginate + 0.1 mol.L-1 CaCl
2 + NaCl.
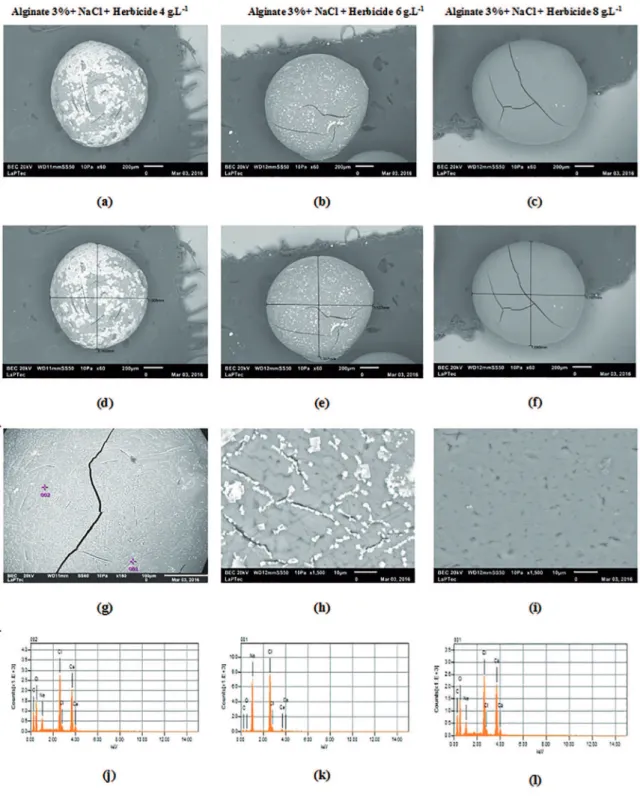
alginate microparticles. Figure 11shows representative SEM images used for determining the size distribution of the calcium alginate with and without TBH herbicide. It can
be noted that the microparticles are spherical with rough surfaces. According to AGRAWAL et al.19 spherical with
rough surfaces are typical characteristics of microparticles consisting of sodium alginate. According to LACERDA
et al.9 the ionic gelation method produces microparticles with large radius from 550 to 650 μm. In this study, the
medium radius of the dried alginate microparticles with
NaCl in diferent concentrations of TBH herbicide were 504 μm for 4 g/L, 561 μm for 6 g/L and 599 μm for 8 g/L.
The results of EDX analysis at the point Z1 and Z2 for the alginate microparticles in Figure 10 show the presence of C, O, Na, Cl and Ca.
The encapsulation eiciency (%) was evaluated by the diference of the amount of herbicide initially present
in the alginate + TBH solution and the remaining amount of TBH in the supernatant after the removal of the formed microparticles. The concentration of TBH was determined by UV-Vis spectroscopy. The encapsulation percentages were: 92% for the 4 gL-1, 89% for 6 gL-1 and 86% for 8
Figure 6: Polydispersity curve of dried alginate microparticles (a) without and (b) with NaCl.
Figure 7: SEM micrographs of calcium alginate microparticles for diferent concentrations of CaCl2 and alginate.
The electronic spectra of TBH analytical standard with Combine® solution at the same concentration of TBH were compared. As result, the two spectra superimposed in the whole range analyzed and exhibit a single band with maximum absorbance at 253 nm as can be seen in (Figure
12 (a)). This band can be attributed to a π → π* transition in
organic compounds with conjugated doubled bonds 20 and
was used to monitor the TBH concentration in Combine®
Figure 8: SEM micrographs of calcium alginate microparticles for 3% (m/v) of alginate +0.1 mol.L-1 CaCl
2+ NaCl. (a) Overview and
(b) measurement of the diameter.
Figure 9: Images obtained by optical microscopy of dried alginate microparticles at diferent concentrations of herbicide (a) Alginate 3% + NaCl + Herbicide 4 g.L-1 (b) Alginate 3% + NaCl + Herbicide 6 g.L-1 (c) Alginate 3% + NaCl + Herbicide 8 g.L-1.
As can be seen in Figure 12 (b)the remaining concentration of alginate in solution in contact with the microparticles do
not inluenced in the electronic spectra in the range considered
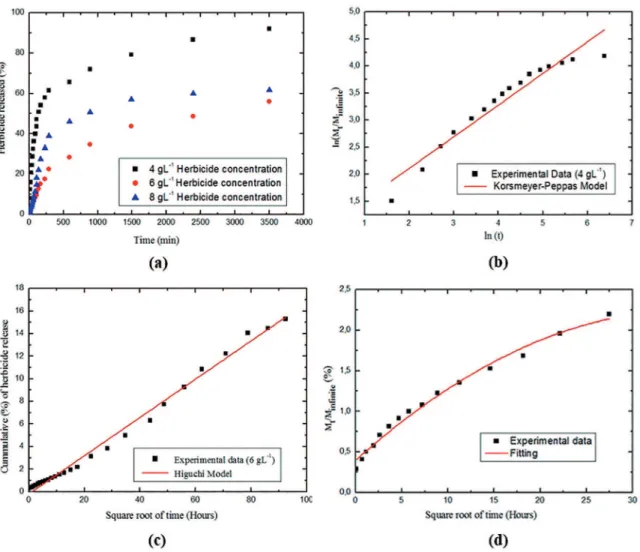
for TBH and Combine® analysis. Figure 13 (a) presents the results of release assays, comparing the kinetic proiles
of encapsulated TBH in calcium alginate microparticles
at ambient temperature for diferent concentrations of
herbicide. Analysis of the release kinetics curves indicated that Combine® was released much more rapidly for 4 gL-1 herbicide concentration (50% of release during the irst 140 min). Thus, the diference observed between the release proiles of encapsulated herbicide could be explained by the
structural characteristics of the microparticles 7.
As reported by GRILLO et al.7 the herbicide release proile curves were analyzed to obtain information on the
possible mechanisms governing the release process. In this work we found that the alginate microparticles showed a
slow and sustained release proile. The results of the analyses
of calcium alginate microparticles containing Combine®
were compared by diferent mathematical models. The
criteria used to determine the best model was based on the
correlation coeicient (R2). To deine the best model it was
necessary to analyze each sample dissolution results using various mathematical equations and linear regression. The mathematical model to present higher value of “R2” is the
most suitable for each sample.
The results showed that only 4 g.L-1 herbicide concentration
was adjusted by Korsmeyer-Peppas model. The rate as a function of time (tn-1), the release constant K = 0.41 min-1, correlation coeicient R2 = 0.97 and difusion exponent n
= 0.49 were found for the 4 g.L-1 herbicide concentration,
see Figure 13 (b). According to CARBINATTO et al.21,
the correlation between release exponent (n) values for the
Korsmeyer–Peppas equation and drug release mechanisms
depending on the geometry shape and for the sphere particle form 0.43< n< 0.85.
The release of TBH from alginate microparticles followed anomalous behavior with non-Fickian release,
where the release is controlled by combination of difusion
Figure 10: Polydispersity curves of dried alginate microparticles with NaCl for diferent concentration of herbicide. (a) 4 g.L-1 herbicide
concentration (b) 6 g.L-1 herbicide concentration and (c) 8 g.L-1 herbicide concentration.
CAHYANINGRUM; HERDYASTUTI and QOMARIAH22
this indicate that the release mechanism of drug is through
mechanism combination of erosion and difusion.
For the 6 g.L-1 herbicide concentration the best result
was obtained using Higuchi model. The Higuchi model
suggests that the agrochemical release by difusion. A graph
is plotted between the square root of time taken on x-axis and the cumulative percentage of drug release on y-axis and
it gives a straight line. Correlation coeicient (R2 > 0.99)
indicates that the herbicide release followed the Higuchi equation. The data obtained were plotted as cumulative percentage herbicide release versus square root of time as can be seen in Figure 13 (c).
All the models used before were not suicient to describe
the behavior of the 8 g.L-1 herbicide concentration. However,
the release mechanism can be described by Mt/Mininite = (2/3) x t0.2 equation for the irst 20 % of herbicide released as can be seen in Figure 13 (d). The correlation coeicient is R2
= 0.96. It is very important to note the results obtained in this survey show the new carrier system has the potential
to reduce detrimental efects of the herbicide and can be
used for weed control. Table 1 presents all the parameters
obtained from each model for the diferent concentrations
of herbicide.
4. Conclusions
In this work we studied the controlled system release of TBH herbicide using microparticles of alginate. The conclusions of this study are:
- Polymeric microparticles containing TBH were obtained successfully through a simple method. Based on the performed tests, it was found that the drip is suitable for the formation of alginate microparticles;
- The OM and SEM techniques demonstrated the
strong inluence of sodium chloride on the alginate
microparticles morphology;
- The addition of NaCl promoted an increase in
the diameter of the microparticles conirming the
formation of regular microparticles and suitable distribution of sizes;
- The Korsmeyer-Peppas mathematical modeling revealed anomalous behavior with non-Fickian
release (combination of difusion and relaxation
of the polymeric matrix) for the 4 g.L-1 TBH
concentration;
- The Higuchi equation was used to describe the release mechanism for the 6 g.L-1 herbicide concentration;
- The alginate microparticles presented high
encapsulation eiciency of TBH herbicide and are
potential candidates for controlled release platforms in agricultural applications;
- These results demonstrate that the structure of kinetic properties of alginate microparticles is suitable as a controlled release carrier system for herbicides
and can be efective for controlling weeds.
- The release of the Combine® herbicide occurred
Figure 11: SEM micrographs and EDX spectra of calcium alginate microparticles for 4 g.L-1 herbicide concentration, 6 g.L-1 herbicide
concentration and 8 g.L-1 herbicide concentration.
5. Acknowledgements
The authors gratefully acknowledge the Federal Institute Goiano (IF Goiano), Laboratory of Plasma Technology (LaPTec), State University of São Paulo (UNESP) for providing
the laboratories facilities and Institute of Exact Sciences, Naturals and Education, Federal University of Triângulo
Mineiro (UFTM). The research was inancially supported
Figure 12: (a) Spectra of tebuthiuron (TBH) analytical standard and a Combine® (500 g.L-1 of TBH) solutions and (b) spectra of alginate in diferent concentrations.
Figure 13: (a). Release assays, comparing the kinetic proiles of encapsulated Combine® in calcium alginate microparticles at ambient
temperature for diferent concentrations of herbicide. (b). Mechanism of herbicide release by Korsmeyer-Peppas model for the 4 g.L-1
herbicide concentration. (c). Mechanism of herbicide release by Higuchi model for the 6 g.L-1 herbicide concentration. (d). Mechanism
Table 1: Parameters obtained from each model for the diferent concentrations of herbicide.
Concentration of Herbicide Korsmayers-Peppas Model Higuchi Model Baker-Londsdale Model Weibull Model
4 g.L-1 R2=0.97 R2=0.87 R2=0.94 R2=0.96
6 g.L-1 R2=0.90 R2>0.99 R2=0.95 R2=0.87
8 g.L-1 - - -
-6. References
1. Silva Mdos S, Cocenza DS, Grillo R, de Melo NFS, Tonello PS, de Oliveira LC, et al. Paraquat-loaded alginate/chitosan nanoparticles: Preparation, characterization and soil sorption studies. Journal of Hazardous Materials. 2011;190(1-3):366-374. DOI: http://dx.doi.org/10.1016/j.jhazmat.2011.03.057
2. Agostini de Moraes M, Cocenza DS, da Cruz Vasconcellos F, Fraceto LF, Beppu MM. Chitosan and alginate biopolymer membranes for remediation of contaminated water with herbicides. Journal of Environmental Management. 2013;131:222-227. DOI: http://dx.doi.org/10.1016/j.jenvman.2013.09.028
3. Sharma R, Bajpai J, Bajpai AK, Acharya S, Shrivastava RB, Shukla SK. Designing slow water-releasing alginate nanoreserviors for sustained irrigation in scanty rainfall areas. Carbohydrate Polymers. 2014;102:513-520. DOI: http://dx.doi.org/10.1016/j. carbpol.2013.11.059
4. El Bahri Z, Taverdet JL. Elaboration and characterisation of microparticles loaded by pesticide model. Powder Technology. 2007;172(1):3-40. DOI: http://dx.doi.org/10.1016/j. powtec.2006.10.036
5. Souza ELC, Foloni LL, Mantovani EC, Teixeira Filho J. Comportamento do tebuthiuron em solo de cultivo de cana-de-açúcar utilizando
lisímetro de drenagem modiicado. Planta Daninha.
2008;26(1):157-163. DOI: http://dx.doi.org/10.1590/S0100-83582008000100016
6. Silva MRA, Trovó AG, Nogueira RFP. Degradation of the herbicide tebuthiuron using solar photo-Fenton process and ferric citrate complex at circumneutral pH. Journal of Photochemistry and Photobiology A: Chemistry. 2007;191(2-3):187-192. DOI: http://dx.doi.org/10.1016/j.jphotochem.2007.04.022
7. Grillo R, Pereira AdoES, de Melo NFS, Porto RM, Feitosa LO, Tonello PS, et al. Controlled release system for ametryn using polymer microspheres: Preparation, characterization and release kinetics in water. Journal of Hazardous Materials. 2011;186(2-3):1645-1651. DOI: http://dx.doi.org/10.1016/j. jhazmat.2010.12.044
8. Mignon A, Snoeck D, D’Halluin K, Balcaen L, Vanhaecke F, Dubruel P, et al. Alginate biopolymers: Counteracting the impact of superabsorbent polymers on mortar strength. Construction and Building Materials. 2016;110:169-174. DOI: http://dx.doi. org/10.1016/j.conbuildmat.2016.02.033
9. Lacerda L, Parize AL, Fávere V, Laranjeira MCM, Stulzer HK. Development and evaluation of pH-sensitive sodium alginate/ chitosan microparticles containing the antituberculosis drug rifampicin. Materials Science and Engineering: C. 2014;39:161-167. DOI: http://dx.doi.org/10.1016/j.msec.2014.01.054
10. Dias FS, Queiroz DC, Nascimento RF, Lima MB. Um sistema simples para preparação de microesferas de quitosana. Química Nova. 2008;31(1):160-163. DOI: http://dx.doi.org/10.1590/ S0100-40422008000100028
11. Shi LES, Chen M, Xinf LY, Guo XF, Zhao LM. Chitosan nanoparticles as drug delivery carriers for biomedical engineering. Journal of the Chemical Society of Pakistan. 2011;33(6):929-934.
12. Mendoza-Muñoz N, Piñón-Segundo E, Ganem-Quintanar A, Quintanar-Guerrero D. Preparación y evaluación in vitro de nanopartículas poliméricas biodegradables como agente de contraste para ultrasonido. Tip Revista Especializada en Ciencias Químico-Biológicas. 2007;10(1):14-20.
13. Silva MDS, Cocenza DS, De Melo NFS, Grillo R, Rosa AH, Fraceto LF. Nanopartículas de alginato como sistema de liberação para o herbicida clomazone. Química Nova. 2010;33(9):1868-1873. DOI: http://dx.doi.org/10.1590/S0100-40422010000900009
14. Jose S, Fangueiro JF, Smitha J, Cinu TA, Chacko AJ, Premaletha
K, et al. Predictive modeling on insulin release proile from
cross-linked chitosan microspheres. European Journal of Medicinal Chemistry. 2013;60:249-253. DOI: http://dx.doi. org/10.1016/j.ejmech.2012.12.011
15. Dash S, Murthy PN, Nath L, Chowdhury P. Kinetic modeling on drug release from controlled drug delivery systems. Acta Poloniae Pharmaceutica. 2010;67(3):217-223.
16. Strand KA, Boee A, Dalberg PS, Sikkeland T, Smidsroed O. Dynamic and static light scattering on aqueous solutions of sodium alginate. Macromolecules. 1982;15(2):570-579. DOI: http://dx.doi.org/10.1021/ma00230a070
17. Burey P, Bhandari BR, Howes T, Gidley MJ. Hydrocolloid gel particles: formation, characterization, and application. Critical Reviews in Food Science and Nutrition. 2008;48(5):361-377. DOI: http://dx.doi.org/10.1080/10408390701347801
18. McConaughy SD, Stroud PA, Boudreaux B, Hester RD, McCormick CL. Structural characterization and solution properties of a galacturonate polysaccharide derived from Aloe vera capable of in situ gelation. Biomacromolecules. 2008;9(2):472-480. DOI: 10.1021/bm7009653
19. Agrawal S, Ashokraj Y, Bharatam PV, Pillai O, Panchagnula R. Solid-state characterization of rifampicin samples and its biopharmaceutic relevance. European Journal of Pharmaceutical Sciences. 2004;22(2-3):127-144. DOI: http://dx.doi.org/10.1016/j. ejps.2004.02.011
20. Antonietti M, Landfester K. Polyreactions in miniemulsions. Progress in Polymer Science. 2002;27(4):689-757. DOI: http:// dx.doi.org/10.1016/S0079-6700(01)00051-X
21. Carbinatto FM, de Castro AD, Evangelista RC, Cury BSF. Insights into the swelling process and drug release mechanisms from cross-linked pectin/high amylose starch matrices. Asian Journal of Pharmaceutical Sciences. 2014;9(1):27-34. DOI: http://dx.doi.org/10.1016/j.ajps.2013.12.002