Universidade do Minho Escola de Engenharia Departamento de Informática
Mário Nelson Araujo Santos
Energy Analysis
in the CodeCompass system
Universidade do Minho Escola de Engenharia Departamento de Informática
Mário Nelson Araujo Santos
Energy Analysis
in the CodeCompass system
Master dissertation
Master Degree in Computer Science
Dissertation supervised by Prof. João Saraiva Dr. Zoltan Porkolab
A C K N O W L E D G E M E N T S
First of all, I would like to express my deep gratitude to Professor João Saraiva for believing in my abilities, joining me early in the Green Software Lab (GSL) team and together with Dr. Zoltan Porkolab giving me the opportunity to make my thesis in the Erasmus+ Placement program, in Budapest and in a big company like Ericsson. In addition, I would particularly like to thank Dr. Zoltan for having received me in Budapest, getting me a scholarship and a good and cheap accommodation compared to the rest of students, and for having helped me in everything I needed to feel good and safe. In the same subject, I would also like to thank Professor Paulo Azevedo and the International Relations Services (SRI) of the University of Minho for having financed my Erasmus with an Erasmus+ Placement scholarship, without this huge help this partnership would be impossible.
I would particularly like to thank Dániel Kupp, one of Ericsson’s members and one of the CodeCompass developers. He was the person who had the most enthusiasm and curiosity to help without any prior knowledge of energy efficiency or RAPL framework. Without his logical thinking and active participation, this project would not have gone so well. I would like to thank Dr. Zoltan, again, for helping me when I had doubts about Clang, for giving me the opportunity to submit an article to a conference (Software Quality Analysis, Monitoring, Improvement, and Applications (SQAMIA)) and for going there to introduce it.
Lastly, I would like to thank Rui Pereira and Marco Couto, members of GSL, for making me aware of the work already done on Green Computing and the best ways to go during the development of this project.
A B S T R A C T
Green computing has an increasing importance in software engineering. Unfortunately, there are lack of tools on this field to help developers to understand and fix issues related to unwanted energy consumption.
The thesis project will provideSoftware (sw)eng. with information about energy consump-tion of funcconsump-tions and methods. The CodeCompass system helps software developers to understand their source code, and it was developed by the Hungarian team members of Ericsson.
Thus, I will locate hot spots in the software’s source code responsible for abnormal energy consumption, and I will do a plug-in to extend the CodeCompass tool so that it can au-tomatically locate such energy faults, helping software developers to optimize the energy consumption of their software.
R E S U M O
Computação verde tem uma importância crescente em engenharia de software. Infeliz-mente, há falta de ferramentas neste campo para ajudar os eng. de software a entender e corrigir problemas relacionados ao consumo de energia indesejados.
O projecto desta tese fornecerá aos desenvolvedores de software informações sobre o con-sumo de energia de funções e métodos. A ferramenta CodeCompass ajuda os engenheiros de software a entender o código-fonte e foi desenvolvida pelos membros da equipa hún-gara da Ericsson.
Por fim, localizarei zonas "quentes" no código fonte do software responsáveis pelo consumo anormal de energia e irei construir um plug-in para estender a ferramenta CodeCompass para que ela possa localizar automaticamente essas falhas de energia, ajudando os engen-heiros de software na otimização do consumo de energia de seus programas.
C O N T E N T S
1 i n t r o d u c t i o n 1
1.1 Context and Motivation 1
1.2 Objectives 2
1.3 Research Group Context 3
2 b a c k g r o u n d 5
2.1 Ericsson 5
2.1.1 Research and Development 5
2.2 Green Computing 6
2.2.1 Origins 6
2.2.2 Hardware 7
2.2.3 Software 7
2.2.4 Techniques for software development 8
2.3 State of the Art 9
2.3.1 Energy Aware Software Tools 9
2.3.2 Techniques for Green Software Analysis 13 3 e n e r g y i n t h e c o d e c o m pa s s s y s t e m 21 3.1 Why does Ericsson needs Green Computing? 21
3.2 CodeCompass 22
3.2.1 Architecture 23
3.2.2 Web User Interface 25
3.2.3 Functionality 25
3.2.4 Perfomance 27
3.2.5 User Acceptance in Real Production 27
3.3 Green CodeCompass Plug-in 28
3.3.1 Decisions 28 3.3.2 Implementation 32 3.3.3 Plug-in Outcomes 39 4 c a s e s t u d i e s / experiments 42 4.1 Experiment setup 42 4.1.1 Hardware Prerequisites 42
4.1.2 Software Prerequisites and Configuration 43
4.2 Results 45
4.2.1 TinyXml 45
4.2.2 Xerces-c-3.1.4 47
Contents v
4.3 Discussion 48
4.3.1 Validating the Measurements 48
5 c o n c l u s i o n 50
5.1 Conclusions 50
L I S T O F F I G U R E S
Figure 1 Energy Star GHG (greenhouse gas) Reductions Since 2000 6 Figure 2 The behavior of the monitoring framework 10 Figure 3 Power domains for which power monitoring/control is available. 11 Figure 4 Sunflow: energy behaviors under different data precision choices 14
Figure 5 List results for population of 25k 15
Figure 6 Sometimes Faster doesn’t mean Greener 16 Figure 7 The 13 Benchmarks available in Computer Language Benchmark Game
(CLBG) 17
Figure 8 Normalized global results for Energy and Time 17 Figure 9 Language ranking considering all combinations of energy, time and memory (inPereira et al.(2017b)) 18
Figure 10 Generic formulation of a SFL Matrix 19
Figure 11 The Jaccard similarity coefficient 19
Figure 12 Static Model Formalization 19
Figure 13 SPELL embedded Gzoltar graphic visualization tool 20
Figure 14 CodeCompass architecture 23
Figure 15 User Interface 25
Figure 16 CodeBites example 26
Figure 17 CodeCompass usage distribution per task 28
Figure 18 System architecture 29
Figure 19 Visualization of Profiling Data in Kcachegrind (Weidendorfer and
Zenith) 31
Figure 20 Example of an Abstract Syntax Tree (AST) with the nodes to be read. 33
Figure 21 How CRAPL works. 36
Figure 22 How energy measurement values are saved 37 Figure 23 All functions measurement with overhead (pp0) 41 Figure 24 All functions measurement without overhead (pp0) 41 Figure 25 x86 Intel Architectures that have RAPL interface(Weaver,2015). 43
Figure 26 Tinyxml results without overhead 46
Figure 27 Tinyxml results with overhead 46
L I S T O F TA B L E S
Table 1 Perfomance of CodeCompass v4 27
Table 2 Energy Consumption of functions executed in some tests 47 Table 3 Detailed energy consumption from DTest 48 Table 4 Validation of results in TinyXml (values represented in mJ) 49
A C R O N Y M S
A
AST Abstract Syntax Tree.
C
CLBG Computer Language Benchmark Game. CSR Corporate social responsibility.
D
DGC Distributed Green Compiler. DSL Domain-specific languages.
E
EPA Environmental Protection Agency.
F
FCT Fundação para a Ciência e Technologia.
G
GPU Graphics Processing Unit.
GREENSSCM Green Software for Space Control Mission. GSL Green Software Lab.
I
ICSE International Conference on Software Engineering. ICT Information and Communication Technology. IDE Integrating Developing Environments.
L
Acronyms ix
LLVM Low Level Virtual Machine.
M
MSR Machine Specific Records.
R
RAPL Running Average Power Limit.
S
SFL Spetrum-based Fault Localization.
SPELL Spectrum-based Energy Leak Localization.
SQAMIA Software Quality Analysis, Monitoring, Improvement, and Applications. SW Software.
1
I N T R O D U C T I O N
1.1 c o n t e x t a n d m o t i vat i o n
In the field of software engineering, recent studies have defined powerful techniques to in-crease software developers’ productivity by supplying, for example, integrating developing environmentsIntegrating Developing Environments (IDE), testing and debugging frameworks and tools, advanced type and modular systems, etc. Furthermore, to improve the execu-tion time of our software, compiler construcexecu-tion techniques were developed, namely by using partial and/or runtime compilation, parallel execution, advanced garbage collectors, etc. All of these engineering tools and techniques are designed to help software develop-ers quickly specify correct programs with the ideal execution time. Unfortunately, none of these techniques or tools have been adapted to support green software development. In fact, there is no software engineering discipline that provides techniques and tools to help software developers understand, analyze, and optimize the power consumption of their software! As a consequence, if a developer realizes that his software is responsible for a large battery leak, he does not receive support from the language/compiler he is using.
In this thesis, I aim to study, develop, and apply methods to statically analyze abnormal energy consumption in software source code. Thus, the focus of the thesis is to reason about energy consumption at the software level more specifically in functions or methods of the given program written in the widely used C++ programming language. This is an innovative approach to analyze power consumption, since most of the research done on reducing the energy consumed by computers was done at the hardware level, not the soft-ware.
In this context, Pereira et al. (2017a) characterize an abnormal or excessive power con-sumption by a software system as an energy leak (inefficient energy concon-sumption).
I would also like to evaluate the validity of these techniques in real-world, industrial-size software applications. The Ericsson research team in Budapest is involved in the
1.2. Objectives 2
ment of the CodeCompass framework. This framework is an extensible static analysis tool for analyzing and visualizing the program’s source code written in different languages.
I will develop an energy-aware plug-in to locate abnormal energy consumption in the pro-gram’s source code moreover, the located abnormal spots will be visualized and presented them to the software developers in the CodeCompass framework. Because CodeCompass is being used at Ericsson to analyze several of its software systems, I will validate my tool in the example systems where developers tested their plugins. Ericsson has just made Code-Compass open-source, and thus, the results of this thesis will be freely available for the green sw community and in the end, I plan to publish an article in top conferences and journals in the area of green software and sustainable computing, that have been created in recent years1
.
1.2 o b j e c t i v e s
While in the previous century software developers and computer manufacturers’ primary goal was to produce very fast software systems and computers, in this century this has changed: the widespread use of non wired but powerful computer devices is making bat-tery consumption/lifetime the bottleneck for both manufacturers and software developers.
The hardware manufacturers are already aware of this concern and a lot of work in terms of optimizing energy consumption by optimizing the hardware has being done. Unfortu-nately, the programming language and software engineering communities have not fully understood this bottleneck, and as a result there is little support for software developers to discuss the power consumption of their software. Although the hardware is the one that consumes energy, the software can greatly influence this consumption, such like a driver who operates a car influences its fuel consumption.
Furthermore, I will extend the CodeCompass tool to identify such programming factors in the source code of software systems. This tool uses static analysis techniques to analyze programs written in C/C++, Java and Phyton. It computes multiple software metrics and presents an user-friendly visualization of such metrics and source code. In this thesis, I will implement an energy conscious plug-in for CodeCompass so that those identified factors are presented to the software developers in the source code they are developing in C or C++, the main two programming languages that Ericsson Budapest usually works on their projects and test on this tool. In the end, I plan to use industrial-size software systems from
1 See for example the GREENS workshop - http://greens.cs.vu.nl/ - that is now part of the top conf. on sw engineeringInternational Conference on Software Engineering (ICSE)
1.3. Research Group Context 3
Ericsson Budapest as case examples to test the plug-in. This thesis aims at answering the following three research questions:
• RQ1: Can we instrument a all C or C++ software system to add theRunning Average Power Limit (RAPL)interface without compromise the execution of the programme? • RQ2: Can we measure the energy of all the functions/methods of a project to easily
check which ones are wasting more energy?
• RQ3: Can such techniques be implemented as a plugin of the CodeCompass tool? How efficient and effective are such techniques when handling industrial-size sw applications?
The results of this thesis will allow programmers to become energy aware during pro-gramming and with the appropriate tools they finally have ways to support green decision making.
1.3 r e s e a r c h g r o u p c o n t e x t
The University of Minho and the Faculty of Informatics of Eötvös Loránd University, Bu-dapest have a history of scientific cooperation in the framework of the Erasmus project since 2007. The cooperation consists in students exchange, guest lectures and cooperation on teaching at summer schools. University of Minho has strong experiences on energy aware computing. In 2015, the coordinator of this thesis presented his ongoing research work on the analysis of software energy consumption in an invited talk at Ericsson in Budapest. The feedback of this talk was very positive and they discussed possible collabo-rations by implementing static analysis techniques in Ericsson software. So, in this context of Minho/Etvos Erasmus agreement, I was granted an Erasmus Placement Scholarship to do part of my MSc work at Ericsson, co-supervised by Prof. Zoltan Porkolab.
The static analysis research group at Eötvös Loránd University has been working on var-ious static analysis tools for industrial applications for the last five years. Among other achievements, they implemented CodeChecker, an open source static analysis framework for theLow Level Virtual Machine (LLVM)2
/Clang3
compiler infrastructure to detect program-ming anti-patterns, code smells and other issues applying both the analysis of theASTand using symbolic execution. Another achievement is CodeCompass – a code comprehension tool for C, C++, Java and Python languages. With CodeCompass, the developers are able to locate, browse and visualize large code bases where a certain feature is implemented. The
2 LLVM is a collection of modular and reusable compiler and toolchain technologies.
1.3. Research Group Context 4
plugin-able structure of the CodeCompass tool makes it possible to extend the framework with new modules, in our case the visualization of energy aware information among the source code. The role of the Hungarian partner is to define the best methods to present the information about energy leaks and other issues in the system and extend CodeCompass with the necessary parsers and plug-ins.
Four years ago, the researchers of Minho started the Green Software Lab (GSL) to study and develop techniques and tools for green software. In the scholar year 2013/14, João Saraiva included the study of techniques for green software in the MSc and PhD courses that he teachs at the MSc in Informatics Engineering and the MAPi doctoral program. This hot topic already attracted several young researchers, like Rui Pereira and Marco Couto.
The GSLis also actively applying the research in industrial settings. Last year the team started applying energy consumption estimation techniques to aerospace software in the context of the project Green Software for Space Control Mission (GreenSSCM). Moreover, the team is also active applying for research project funding. Prof. João Saraiva is the principal investigator of a project on green software funded by Fundação para a Ciência e Technologia (FCT). He is also the coordinator of a FCT/Slovakia bilateral project4
on green computing (2016-2017).
2
B A C K G R O U N D
In this chapter I will present a study about the background of the project. Firstly, I will describe in detail the main topic of this thesis, namely Green Computing. In general, I will talk about the history, why it was created such concept and the importance it has in the Information and Communication Technology (ICT)sector.
Then I will introduce technologies\innovations to reduce energy consumption, both hard-ware and softhard-ware level. Finally, I start in the next section by introducing Ericsson where the main part of the MSc thesis was conducted.
2.1 e r i c s s o n
Founded in 1876 by Lars Magnus Ericsson, Ericsson is one of the world’s largest telecom-munication network and equipment companies. Headquartered in Sweden, the company offers various services such as software and infrastructures in information and communi-cation technology, traditional telecommunicommuni-cations and Internet Protocol (IP), mobile and fixed broadband, cable television, video systems, and operations and business support ser-vices. Worldwide, it operates in about 180 countries and it employs around 98.000 people, according toEricsson(2016).
2.1.1 Research and Development
The research and development team is part of Group Function Technology, which includes several universities and research institutions, such as: Lund University (Sweden), Eötvös Loránd University (Hungary) and Beijing Institute of Technology (China). Group Func-tion Technology focuses primarily on wireless access networks, broadband technologies, packet technologies, multimedia technologies, radio access technologies, software, security and global services. This dissertation will be done under the context of the CodeCompass comprehension tool, one of the projects developed between Ericsson and Eötvös Loránd University, which aims to help programmers understand large-scale software systems from
2.2. Green Computing 6
mainly static analysis of code.
2.2 g r e e n c o m p u t i n g
While in the early days of computing, when developing hardware\software the primary goal was to get systems to run as fast as possible, in recent years we have seen a significant increase in research of the development and production of hardware and software compo-nents with low levels of energy consumption. Sustainability is currently one of the world’s most important issues, making energy consumption one of the most critical headaches in ICT.
2.2.1 Origins
Although the sustainability of our planet starts several decades ago, the first steps of Green Computing came in 1992 with the appearance of the Energy Star (ENERGY(2011)), a vol-untary certification program created by the United States Environmental Protection Agency (EPA). The Energy Star was designed to identify and promote energy-efficient products so anyone could save money spent on light bills and reduce greenhouse gas emissions (Figure 1). Monitors, temperature control equipment and television sets were the first products to receive certification.
Figure 1: Energy Star GHG (greenhouse gas) Reductions Since 2000
According toScheild(2011), the first important, yet very simple result of Green Comput-ing was the creation of the suspend mode function on computer monitors. Over the years, the concept has been developed from other solutions, such as thin client1
, cost accounting, virtualization practices and eWaste (recycling of electronic products).
2.2. Green Computing 7
2.2.2 Hardware
According toCalero and Piattini(2015), one of the important steps for sustainability passes through the day-to-day of the individual person. Learning how to recycle used materials and reducing carbon dioxide emissions in our routine (using energy-efficient computers or using public transports more often, for example).
At hardware level there are some curious ideas\technologies (Statham et al.(2012)): • The RITI printer - printer that uses coffee grounds as a substitute for ink;
• Green hard drives - they use less energy when running and conserve energy when not being used;
• Solar Computing - Intel has developed a low-power processor capable of running on solar-cell PCs based on solar cell technology, i.e, a seal-sized electronic component that converts sunlight into electricity.
2.2.3 Software
Bener et al. (2014) said that most of the spending on Green ICTcomes from the effects of hardware on the environment. People have little consideration for the impact of software products. Although software systems do not directly consume power, they affect the use of hardware components.
Efficiency in energy consumption, efficient allocation of space, efficiency in memory ca-pacity, usability, availability and storage of data and information, and efficiency in the use of planning time (parallelism) are some aspects that may be important when developing energetically efficient Software. In fact there are several technologies that can significantly reduce energy consumption ofswsystems, namely:
• Virtualization - directly reduces the use of hardware required for multiple systems. On a server or desktop, virtualization allows multiple operating systems or applica-tions to run on a single computer -Turban et al.(2008);
• Terminal servers - users connect to a central server and all real computing is done on the server. They can be combined with thin clients that only use 1/8 the amount of power of a normal workstation -Bener et al.(2014);
• Power management - allows the operating system to control the power management features connected to the hardware. The system can automatically shut down compo-nents such as hard drives or the monitor if they are inactive after a certain period of time -Star;
2.2. Green Computing 8 • Cloud computing - according toMines:
1. Automation software, maximizing consolidation and utilization to drive efficien-cies;
2. Pay-per-use and self-service, encouraging more efficient behavior and life-cycle management;
3. Multi-tenancy2, delivering efficiencies of scale to benefit many organizations or business units.
2.2.4 Techniques for software development
During the software development cycle energy consumption can be reduced, starting with the analysis up to design and implementation. In the design we can take into account some energy-efficient structures for the project. In the implementation there are some parameters that we can take into account, according to Fakhar et al.(2012):
1. Use of green IDE & compiler - use of compilers capable of reshaping the source code by applying various Green optimizations during code transformation. Green Hill compiler for C and C++, encc energy aware compiler for C++, are some examples. 2. Recursion vs. Iteration - Recursion uses stacks. At the beginning of each function,
the arguments have to be pushed in the stack and at the end of the function they have to be popped, which leads to more execution time, thus also leading to more power consumption. Therefore, we should avoid recursion and use iterations. Recursion elimination is a key optimization automatically performed by compiler.
3. Less running time - Normally, any reduction in run time may be useful to reduce energy consumption. Therefore, always try to use algorithms with linear complexity. 4. Use of energy aware data structure - data structures have a significant effect on the
conservation of energy and in the execution of a program. For example a study made by Couto et al.(2017), in a marge sort an array of arrays consumes less energy compared to a link list.
5. Algorithmic efficiency - programmers must write efficient algorithms by writing a code-specific design and data structures based on the application, programming lan-guage and hardware architecture.
6. Sacrificing performance above a limit for energy efficiency - sometimes it is better to be greener than faster.
2.3. State of the Art 9
7. Code written for energy allocation purposes - you can route traffic to locations with lower energy costs or less hot climates.
8. Define IT Resource and Quality Metrics - in the analysis phase it may be important to define some metrics to measure (Mahmoud and Ahmad,2013):
• Total life-cycle costs of the process - take into account parameters such as pro-grammer experience, complexity of the operation, integration and reuse rates, and required stability;
• Power consumption and efficiency - measure the amount of power supply, mate-rials consumed, CO2 emissions and other energy-related factors released by the air.
• Infrastructure costs, human efforts, material outputs and compliance with envi-ronmental laws.
2.3 s tat e o f t h e a r t
In this section I will present studies conducted by some researchers. Some techniques and measures concluded by them that can significantly reduce energy consumption when developing a certain application, as well as tools designed to help developers to save energy or to reach certain conclusions in their studies on energy efficiency.
2.3.1 Energy Aware Software Tools
Software can also play an active role in saving energy by providing feedback on how soft-ware components consume resources, thereby enabling programmers to create greener pro-cesses. Here are some examples:
Distributed Green Compiler (DGC)
DGC reshape the source code during intermediate code conversion by applying various green techniques to produce an energy efficient executable program. A green compiler requires more time to compile the source code compared to normal compilers. It applies ecological strategies in the compilation.
According to Fakhar et al. (2012), it also provides green suggestions to programmers, highlighting areas of source code that can not be transformed by the compiler for energy optimization during intermediate code conversion. DGC gives program energy consump-tion statistics after compilaconsump-tion, telling the programmer how much energy can be saved in a produced executable. Loop optimization, use of energy optimized data structure, dead
2.3. State of the Art 10
code elimination, software pipelining, recursion elimination, cloud aware task mapping, un-optimized code blocks identification and energy cost statistics are some of the sugges-tions\transformations that the compiler offers.
GreenDroid
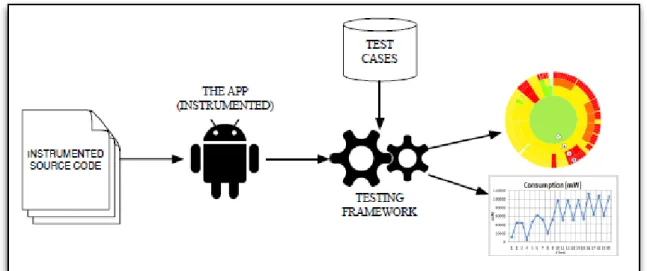
GreenDroid is a framework that profiles the energy consumption on the Android ecosystem (Couto et al.,2014). The tool can be used to determine the methods of an Android applica-tion that are likely to be associated with abnormal energy consumpapplica-tion. Greendroid uses the Android sw test framework to execute the program and monitor the energy consumed by the executed methods. Once the source code and application tests are ready, the tool performs a set of sequential steps to present the desired results.
Figure 2: The behavior of the monitoring framework
As shown in Figure2, the steps are:
1. Execute the tests - the tests run twice, once to get the list of methods invoked and another to measure power consumption. The result will be stored in files containing a list of the invoked methods, as well as the number of times it was invoked, the test execution time and the energy consumed, in mW (Milliwatts).
2. Merge the results - after all tests have been executed, the tool will generate a set of files corresponding to the number of tests. Then the they will be gathered into a single file to be read and analyzed to extract the information.
3. Classify the methods - in this step, the tool will read the file values and sort them according to green-aware metric values.
2.3. State of the Art 11
4. Generate the results - in the end it will generate graphical representations of the components of the source code, giving it different colors according to the classification specified in the previous step.
RAPL
In this section I overview how one can measure the energy consumption of a processor using the Intel’sRAPLinterface.
Figure 3: Power domains for which power monitoring/control is available.
According to Dimitrov et al. (2015), RAPL was designed by Intel as a set of low-level interfaces with the ability to monitor, control, and get notifications of energy consumption of different hardware levels. It is supported in today’s Intel architectures, like i5 and i7 CPUs. The architectures, that support RAPL, monitor energy consumption information and store it inMachine Specific Records (MSR)3
. TheseMSRcan be accessed by the Operating System.
As shown in Figure 3, RAPL allows energy consumption to be reported in a practical way, by monitoring:
• Package (PKG): entire socket (pp0+pp1);
• Power Plane 0 (PP0): all of the CPU cores in the package;
3 A model-specific register (MSR) is any of various control registers in the x86 instruction set used for debugging, program execution tracing, computer performance monitoring, and toggling certain CPU features.
2.3. State of the Art 12 • Power Plane 1 (PP1): uncore. Often provides info for the integratedGraphics
Process-ing Unit (GPU);
• DRAM: DRAM in the system.
Rapl Interfaces
RAPLinterfaces consist of non-architectural MSR. According to Intel(64) the following set of capabilities are supported by eachRAPLdomain:
• Power limit -MSRinterfaces to specify power limit and time window;
• Energy Status - Power metering interface providing energy consumption information; • (Optional) Perf Status - Interface providing information on the performance effect
due to power limits;
• (Optional) Power Info - It is an interface that provides information on the set of parameters for a given domain, maximum power, minimum power, etc;
• (Optional) Policy - 4-bit priority information that is a hardware tip for dividing the budget between sub-domains in a parent domain.
Each of the above features needs specific units to describe them. Time is expressed in sec-onds, power is expressed in Watts and energy is expressed in joules. The scaling factors are provided to each unit to make the information presented significantly in a finite number of bits. Units for power, energy, and time are exposed in the read-only MSR_RAPL _POWER _UNIT MSR.
There are several implementations/libraries in differente programming languages to ac-cess RAPL measurements. Next I briefly show the Java binding of RAPL, called jRAPL.
jRAPL
According tojRA, jRAPL is a framework for profiling Java programs running on CPUs with RAPLsupport.
double beginning = EnergyCheck.statCheck(); doWork();
double end = EnergyCheck.statCheck();
As one can see with the example above, it can be viewed as a software wrapper to access theMSR.
2.3. State of the Art 13
Trepn Power Profiler
A RAPL equivalent for mobile devices, developed by Qualcomm Technologies. ( Qual-comm Technologies) TrepnTM Profiler is an on-target power and performance profiling application for mobile devices. With this tool, programmers can understand the impact of their programming choices on both performance and energy. Some features provided by Trepn:
• Six fast-loading profiling presets;
• Overlays appear on screen on top of applications that are being profiled; • Profile a single app, or your device;
• Displays battery power on supported devices; • View CPU andGPUutilization and frequency; • Display network usage (Wi-Fi and cellular);
• Advanced mode to manually select data points and save data for later analysis.
SEEP
Developed byHönig et al.(2011), SEEP is designed to aid program development by analyz-ing source code and obtainanalyz-ing accurate platform-dependent power profiles, per function, using pre-existing knowledge about the energy consumption of the underlying instructions. The source code must be compiled into an intermediate representation and provided as in-put to the SEEP program in order to obtain a high degree of code coverage and therefore high precision. Subsequent results need to be combined with code models in the source code and the process repeated in case of updates to the code base.
2.3.2 Techniques for Green Software Analysis
This section presents studies about energy efficiency in programming. It will be shown some green rankings and some techniques to understand where power failures (or energy leaks) are located, in which component a program may be spending a lot of energy. Most of these studies were conducted by members of the GSL group where this thesis is integrated.
2.3. State of the Art 14
Data-Oriented Characterization of Application-Level Energy Optimization
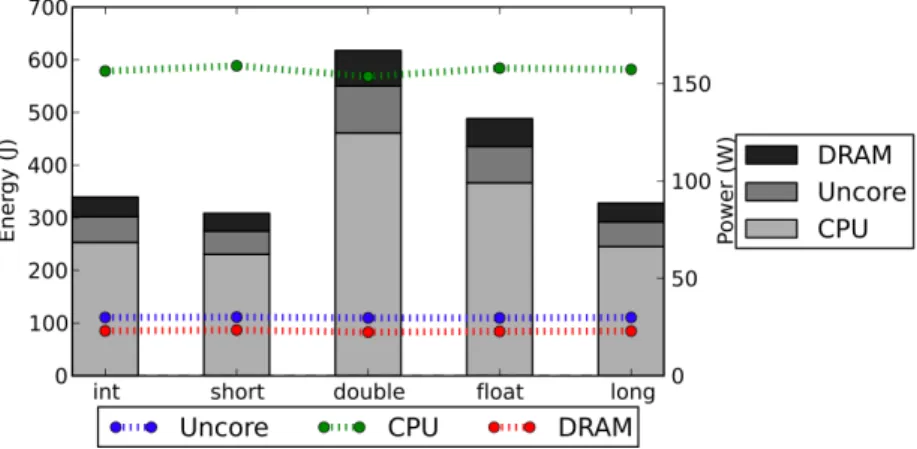
To show how jRapl works,Liu et al.(2015) used Sunflow4. The program represents render-ing data in type double, so they changed and tested the program usrender-ing other primitive data types such as short, int, float and long.
Figure 4: Sunflow: energy behaviors under different data precision choices
As shown in Figure 4, the short type is the one that uses less energy compared to the rest.
Although Sunflow is a complex application, with more than 20,000 lines of code we can notice that a simple modification in the usage of data types in a method can have a big impact on the energy consumption of the application.
Ranking of Java Data Structures
Researchers have studied the energy consumption of the Java Collections FrameworkPereira et al.(2016). In this study, the authors considered all of the collections within the framework and grouped each collection by their implemented interface, as shown in the following list:
• JCF Data structures:
SetsConcurrentSkipListSet, CopyOnWriteArraySet, HashSet, LinkedHashSet, TreeSet Lists ArrayList, AttributeList, CopyOnWriteArrayList, LinkedList, RoleList, RoleUn-resolvedList, Stack, Vector
MapsConcurrentHashMap, ConcurrentSkipListMap, HashMap, Hashtable,
Identity-HashMap, LinkedIdentity-HashMap, Properties, SimpleBindings, TreeMap, UIDefaults, WeakHashMap
2.3. State of the Art 15
Using varying population sizes of 25,000, 250,000, and 1,000,00 elements, they mea-sured the energy consumption, by using jRAPL jRA, of each method within their specific API list. Below is the complete list of the analyzed methods.
• Methods:
Sets add, addAll, clear, contains, containsAll, iterateAll, iterator, remove, removeAll, retainAll, toArray
Lists add, addAll, add (at an index), addAll (at an index), clear, contains, contain-sAll, get, indexOf, iterator, lastIndexOf, listIterator, listIterator (at an index), remove, removeAll, remove (at an index), retainAll, set, sublist, and toArray
Maps clear, containsKey, containsValue, entrySet, get, iterateAll, keySet, put, putAll, remove, and values
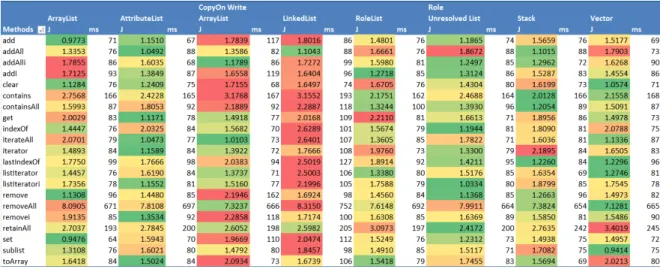
By applying this design, the authors were able to achieve an energy efficiency ranking of the collections based off of each method’s energy consumption. Additionally, these rankings are grouped by different combinations of the implemented interfaces, Sets, Lists, and Maps, and the different population sizes. All of this allows a developer to have a better understanding of which data structure would be best suited for a given scenario. Below, in Figure 5, is an example of one of the data tables for the List collections using a population of 25,000.
Figure 5: List results for population of 25k
From the data presented in Figure5, for Lists with a size of 25,000, we can see that Role-UnresolvedList and AttributeList are the collections which have the tendency to consume the least amount of energy, while LinkedList is the least efficient implementation. Addi-tionally, the energy measurements are colored with a varying spectrum of colors from red to green, depicting a method to be inefficient or efficient respectively.
2.3. State of the Art 16
Figure 6: Sometimes Faster doesn’t mean Greener
This study also supports the statement that a faster implementation does not always mean a more energy efficient one. As shown in Figure 6, the containsKey method in Prop-erties is slower than in SimpleBindings, yet it consumes less energy.
Finally, using a very simple methodology to choose a more efficient collection, the au-thors were able to optimize Java projects by an average of 6.2%.
In another similar study to this one,Lima et al.(2016) have studied the energy consump-tion of different data structures in Haskell.
Towards a Green Ranking for Programming Languages
In order to better understand how the choosing of a particular programming languages can influence the energy consumption of a software solution, researchers have conducted stud-ies that use implementations of the same problems in different languages aim to compare them. An example of such study is the one conducted by Couto et al.(2017): the authors used a set of computational problems, written in several languages, to check which of the considered programming language are more energy efficient.
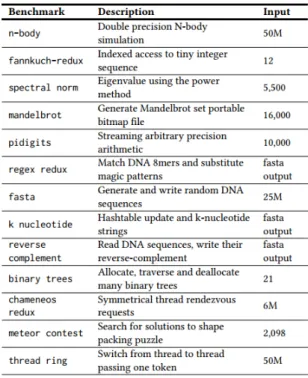
The case study considered for the study was obtained from the repository available in the CLBG project. This repository contains solutions for 13 different problems, each one implemented in almost 27 programming languages. Figure 7 presents a brief description of the 13CLBGproblems.
This study compared 10 of the 27 languages: C, Java, Octran, Fortran, C#, Go, Racket, Moon, Jruby, an Perl, and only the first 10 problems were considered in this study, since there was
2.3. State of the Art 17
Figure 7: The 13 Benchmarks available inCLBG
no solution of the last 3 in all the languages they wanted to test. The results of this study are presented in Figure8.
Figure 8: Normalized global results for Energy and Time
As it can be verified, it was concluded that the C language is the fastest and the most energy efficient in relation to all the others, being in second Java that energetically costs 1.69x more compared to C. They also concluded that not always fast means energetically efficient.
2.3. State of the Art 18
This study was extended afterwards Pereira et al. (2017b), in order to include the re-maining 17 languages and to offer a more thorough comparison between the languages. While the first study focused mainly on comparing the energy consumption with the exe-cution time in and between languages, the second study also presented a discussion about the memory consumption and its relation with the solutions’ energy consumption, and a comparison considering not only languages but also programming paradigms.
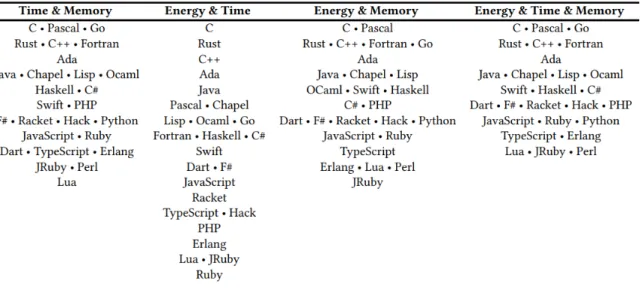
Moreover, the authors verified that if they tried to rank the languages according to energy consumption, execution time and memory usage of the solutions, the rankings would be different. Given that, they aimed at creating a general language ranking, considering the 3 referred factors, and proposed such ranking as one of the main contributions of their study. The resulting ranking is presented in Figure9.
Figure 9: Language ranking considering all combinations of energy, time and memory (in Pereira et al.(2017b))
Spectrum-based Energy Leak Localization (SPELL)
SPELL is a language independent technique to detect energy inefficient fragments in the source code of a software system. It is based off of Spetrum-based Fault Localization (SFL), a statistical analysis technique typically used to locate bugs or program faults based off of several test executions.
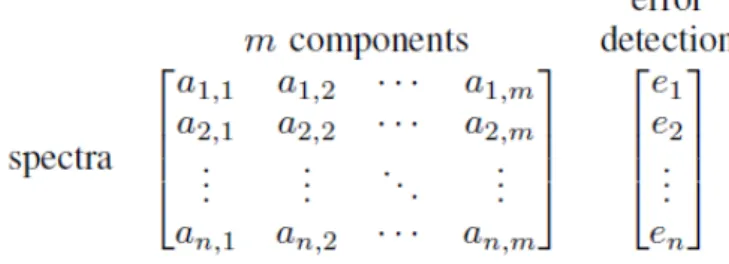
More specifically,SFLuses a set of flags which reflect whether or not a concrete compo-nent is used in a particular execution of the software and set up an n x m (Figure10) matrix (m different components and n different executed tests cases).
2.3. State of the Art 19
Each position of the matrix (aij) can either have the value of 0, if the component was not
executed or the value 1 if it was. Finally, an error vector is constructed to state if an error occurred (1), or not (0) during a specific test execution.
Figure 10: Generic formulation of a SFL Matrix
Figure 11: The Jaccard similarity coefficient
Using the Jaccard similarity coefficient (as shown in Figure11),SFLcalculates how prob-able a certain component contains a fault. The variprob-ables of the coefficient function are as follows:
M11represents the total number of attributes where A and B both have a value of 1. M01 represents the total number of attributes where the attribute of A is 0 and the attribute of B is 1.
M10 represents the total number of attributes where the attribute of A is 1 and the attribute of B is 0.
M00represents the total number of attributes where A and B both have a value of 0. As one can not relate energy consumption to simple binary values of high (1) or low (0) consumption, the authors of SPELL adapted the SFLtechnique to allow it to be used for energy leak localization.
First they adapted the hit spectrum to a static energy model. Similar to the prior tech-nique, it also uses an n x m matrix. But unlikeSFL, the elements of the matrix are triples, as shown in the Figure12:
2.3. State of the Art 20
E- for energy consumption (Joules);
N- for the number of executions (cardinality); T- for runtime (milliseconds).
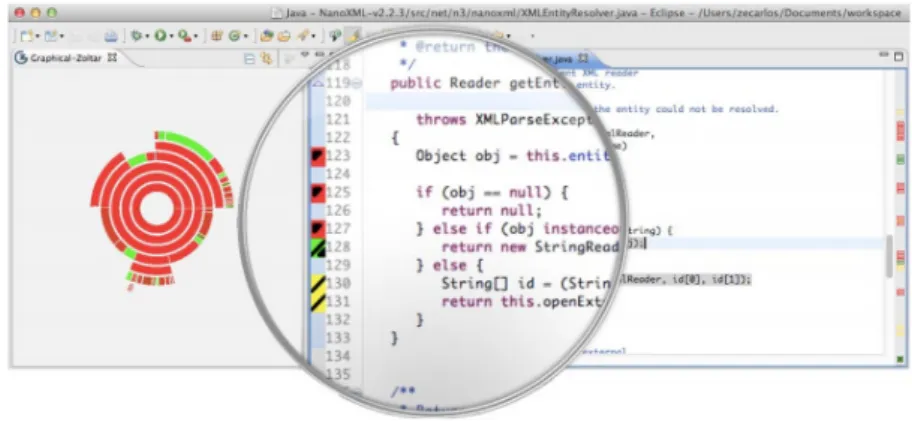
Finally, using an adapted similarity function, the technique uses a statistical method to relate energy consumption to different different source code components of a system, thus directing the developer’s attention on the most critical "red" points in his code (as shown in Figure13).
Figure 13: SPELL embedded Gzoltar graphic visualization tool
The main difference between SPELL and other static approaches is that instead of using a binary decision, the error vector is calculated by this technique giving it two different perspectives, Component Category Similarity and Global Similarity, to calculate the oracle and similarity. The first one is an analysis in a specific category (for example, considering only the energy consumption) and the second one is a global analysis considering the three.
Energy Consumption in Data Warehouses
In the database systems field, where the computational resources required during the pro-cessing of large volumes of data are enormous, caused the need to look for new imple-mentations arose and from a study carried out byGuimarães et al.(2016) a new technique was created so that it was possible to categorize and evaluate the energy consumption in data warehouse settlement systems and thus to have the necessary information so that it is possible to build new settlement systems with lower energy costs. Very closely, the imple-mentation consists in evaluating the energy consumption of all the components used in the settlement process from a conventional tool.
3
E N E R G Y I N T H E C O D E C O M PA S S S Y S T E M
This chapter presents the design and the implementation of the Green CodeCompass plug-in. First, I will explain why companies like Ericsson need to be aware about energy effi-ciency. I will show the environment where this dissertation is developed. I will describe in detail about the tool where I will implement the green plug-in I propose and at the same time I will analyze the importance of it for large-scale projects in Ericsson’s development teams. Then I will explain about the decisions that I had to make to be possible the mea-surement of the energy consumption of the industrial projects. I will also explain in detail the architecture of the system and the implementation of all the essential components of the whole tool. Finally, I will show an example of what the tool generates after running on a project.
3.1 w h y d o e s e r i c s s o n n e e d s g r e e n c o m p u t i n g?
According toCalero and Piattini (2015), a company can receive huge public criticism and subsequently lose market legitimacy if it does not have sustainable in its top priorities. 47% of institutions began modernizing their sustainability-based business models, conducting sustainable development as a new source of innovation, a new mechanism to gain compet-itive advantage and a new opportunity to cut costs. Most people claim that they will pay more for a environmentally friendly product.
The ISO 26000 standard for Corporate social responsibility (CSR) was published, in early 2010. It provides executive guidelines and measures to demonstrate social responsibilities. The goal of this standard is to encourage the adoption of environmentally friendly infor-mation technologies and to promote greater environmental responsibility through business practices. Companies should take a precautionary approach to protect the environment.
For example, according to Alves et al. (2012), the environmental impact of datacenters (clusters, grids or clouds) is enormous, and studies have found that carbon dioxide (CO2) emissions from multiple data centers are bigger then many countries. Therefore, it is pos-sible to affirm that the power consumption of these large-scale and distributed equipment is enormous. With a huge energy consumption, another problem is also associated with
3.2. CodeCompass 22
the companies that use these structures: the price to be paid for the high amount of energy consumed, also counting on the cooling and communication systems associated with this system. "Close to 50% of the energy costs of an organization can be attributed to the IT departments” -Harmon and Auseklis(2009).
In addition to organizations, programmers themselves are also beginning to be concerned about the energy efficiency of their programs. This conclusion was based on a study carried out byPinto et al.(2014) and using StackOverflow as the main source, where they analyzed 300questions and 550 answers from more than 800 users, related to the energy consumption of sw.
3.2 c o d e c o m pa s s
The maintenance of large-scale software has always been problematic. Over the years, the design structure becomes fickle as developers change, the code becomes difficult to under-stand and the documentation tends to become unstable. To reduce these problems that are constant in projects coming from its work teams, Ericsson developed CodeCompass Cod (2016), a software comprehension tool for C/C++, Java and Python based onLLVM\Clang. The open-source tool was built to make it easier to understand that type of software.
From several studies on Ericsson projects these were the main requirements to build a good understanding tool:
• Growing complexity - Projects of this kind are constantly growing and becoming more complex, i.e the cost of fixing an error or adding new functionality also grows. Regardless of its complexity, project analysis must be scalable.
• Knowledge erosion - In a multinational enterprise environment, such as Ericsson, switching the developers of a large-scale software development teams is frequent, and the new programmers need to quickly adapt to the project.
• Multiple views of the software based on various information sources - In order to have a complete analysis of the program, different types of analysis must be carried out, from the compilation of the program to the analysis of metrics. Each one has its importance but it is necessary to combine all the possible analyzes in a single work environment.
• Communication barriers - Development teams that are located in different offices tend to have communication problems. If there is some kind of error, the teams will eventually argue on which side that error appeared. This is normally due to the fact that they do not know the intended behavior of the components of each other. An understanding tool should improve sharing of knowledge about components and teamwork.
3.2. CodeCompass 23 • Multiple programming languages - Usually large-scale software systems are
imple-mented in more than one language. It is necessary that the tool supports several languages in the same interface so that it is possible to navigate between the modules and making the usability of the tool more user-friendly.
• Hard to deploy new tools - It is often difficult to convince developers to use new tools, especially when they are hard to install or do not have a user-friendly interface. For this, it is necessary that the tool is intuitive and easy to install and use.
• Requirement of open extensibility - When planning a long-term software product Domain-specific languages (DSL)are used to describe the knowledge base of the domain in a simple and compact way. The tool should analyze and map DSLs to generated code.
3.2.1 Architecture
CodeCompass is built (Figure 14) according to the server-client architecture model to be possible to supply instant reading, searching and navigation of source code in both textual and graphical formats. The server provides a Thrift1
interface for clients through an HTTP2
transport. Since the interface is specified from the Thrift interface, it is easy to add other applications or plugins to the tool (an Eclipse plugin is already implemented).
Figure 14: CodeCompass architecture
1 Thrift is an interface definition language and binary communication protocol that is used to define and create services for numerous languages.
3.2. CodeCompass 24
During the parsing process, a worspace3
is physically saved as a relational database and additional files are created. This process consists of running different parsers plugins, each with different goals. The most important parsers are:
• Search Parser - It iterates recursively over all files in the corresponding project and uses Lucene4
to collect all the words from the source code. These words are stored in a search index, with their exact location.
• C/C++ Parser - Using anLLVM/Clang parser, it iterates over a database compiled in JSON5
that contains build actions and it stores the position and information type of ASTnodes in the database. This database will be used by a C/C++ language service to respond to Thrift calls according to the source code.
• Java Parser - Using an Eclipse JDT parser, it iterates over a database compiled in JSON that contains build actions and stores the position and type of information fromAST nodes in the database. This database will be used by a Java language service to respond to Thrift requests according to the source code.
Since CodeCompass has an extensible architecture it is possible to easily write new parsers in C/C++. Parser Plugins can be added to the system as shared objects. Thrift orders are served from the service plugins, on the Webserver. One or more Thrift services are implemented by a service plugin and it serves as client requests based on the infor-mation saved in the workspace. A Thrift service has a collection of methods and settings accessed from remote calls. All services have an implementation with the exception of language service that is implemented for C/C++, Java and Python. The Language Service are similar because they provide the functionality of navigating over the code base for the implemented language. The most important services are:
• Language Service - this service provides symbol, file, and globally query methods for the current workspace.
• Search Service - this service offers 4 different query types: search for symbol defini-tions6
, search for words in text format, search for file names and suggest search for sentences based on phrase fragments.
3 A parsed snapshot of the source code is called a workspace.
4 Lucene is a free and open-source information retrieval software library, originally written in 100% pure Java. 5 JavaScript Object Notation is an open-standard format that uses human-readable text to transmit data objects
consisting of attribute–value pairs.
3.2. CodeCompass 25
3.2.2 Web User Interface
The web interface (Figure15) is organized with a static top area, and with extendable area on the left and right side. Source code and other views can be seen in the center of the page, while other navigations are shown on the left. The workspace where the project is, the file currently open, the search area, and some generic menus to help the user, are in the upper area.
Figure 15: User Interface
3.2.3 Functionality
In this section it will be presented the features that can be used through the graphical interface.
1. Version control visualizations - visualization of version control information is an important support to understand software evolution. CodeCompass can also display Git commits.
2. Code Metrics - the tool allows you to check some metrics about the quality of the code and summarize them by directories or individual file hierarchies, of the current project.
3. File and directory level diagrams - it is possible to generate diagrams for directories and files, thus gaining a greater perspective of the system and its dependencies.
3.2. CodeCompass 26
4. Information about language symbols - through the source code, the user can click on any symbol and receive information or display diagrams on it.
5. Symbol level diagrams - through the CodeBits (Figure 16) interactive diagram the user can browse through large call chains and type hierarchies.
Figure 16: CodeBites example
6. Search - there are 4 types of research available:
• full text search searches for a group of words that are followed in a block of text; • definition search, has the same syntax as the previous search but instead of text,
it searches for symbol definitions;
• log search looks for location in the code where the intended log messages are sent;
• filename search, as the name implies, looks for the name of a particular file. 7. Browsing history - the user can view the browsing history over the files that he has
accessed to complete the task he is performing.
8. CodeChecker - it allows the user to check bugs identified by Clang Tidy7 and Clang Static Analyzer through the CodeChecker server. With these helpers CodeCompass shows the position of the bugs and execution paths that lead to a failure.
7 Clang Tidy purpose is to provide an extensible framework for diagnosing and fixing typical programming errors
3.2. CodeCompass 27
9. Namespace and type catalogue - when using Doxygen8, the tool saves the definitions of functions, types and variables, and provides a catalog of statements organized by the hierarchy.
3.2.4 Perfomance
The tool scales well in relation to the size of the analyzed code in parsing time, response times of the web server and size of the stored data.
Table 1: Perfomance of CodeCompass v4
TinyXML 2.6.2 Xerces 3.1.3 CodeCompass v4 Internal Ericsson product Source code size [MiB] 1.16 67.28 182 3 344 Search database size [MiB] 0.88 37.93 139 7 168 PostgreSQL db size [MiB] 15 190 2 144 7 729 Original build time [s] 2.73 361.77 2 024 — Parse time [s] 21.98 517.23 6 409 — Text/definition search [s] 0.4 0.3 0.43 2 C++ Get usage of a type [s] 1.4 2 2.3 3.1
The results of Table 1 are derived from the performance results of 4 different C/C++ applications. As one can see, parsing time is proportional to compile time.
3.2.5 User Acceptance in Real Production
Six months after the tool was released, Ericsson used it in seven projects. They observed that in projects with more than 2 million lines of code about 40% of programmers used CodeCompass at least twice a month and about 15% use it daily.
As shown in Figure17fromICS(2016), CodeCompass is mostly used to inspect relation-ships between classes, as well as to find and follow references to functions and variables.
3.3. Green CodeCompass Plug-in 28
Figure 17: CodeCompass usage distribution per task
3.3 g r e e n c o d e c o m pa s s p l u g-in
With the easy ability to extend CodeCompass I will build a plug-in to be possible to col-lect and visualize the energy consumed by functions and methods at runtime, of a given industrial-size project written in the two main languages (C and C ++) supported by Code-Compass. In order to be possible to develop this plug-in, the project planning was divided into the following three tasks:
• Task 1.1 - Instrument of an Application
I will develop a tool to instrument the source code of a program, in the two main languages (C and C++) supported by CodeCompass, in order to insert librarie depen-dencies of RAPL and to wrap RAPL calls around the functions or methods that the user wants to profile at runtime.
• Task 1.2 - Transform RAPL in CRAPL
I will modify the RAPL tool in order to measure the energy consumed in the wrapped functions or methods of the instrumented program. When executing this program it will collect all energy measurements and save them in a text file.
• Task 1.3 - Visualization data tool
I will write a script to read the output file from the previous task and transform it in the proper format file to be evoked by a data profile visualization tool. Then it will be easy for developers to analyze the results.
3.3.1 Decisions
In order to develop a Green CodeCompass plug-in I needed to define the technology to use and the architecture of the program, what would be the best languages or frameworks
3.3. Green CodeCompass Plug-in 29
that I could use to reproduce the expected effect. As most CodeCompass and its plug-ins are implemented in LLVM/Clang I was advised by the members of Ericsson to learn theLLVM/Clang frameworks and to follow this approach. Being that Clang offers several paradigms of library and after analyzing them I ended up choosing it to implement a LibTooling9
tool. Figure18shows the architecture of the Green plug-in for Code Compass.
Figure 18: System architecture
First the user will send the files or the project, that he wants to analyze, to the LibTooling tool. It will instrument the original source code in order to measure the energy consumption of each function (inserting their information into an index text file) when theswexecutes. After inserting the dependencies of the CRAPL the user needs to execute the project. After that a file with the results will be created. Then the user should send it to a script in python to put it in the necessary format to be read by the Kcachegrind framework.
Measurement in Different Cores
From the original RAPL code I made the necessary modifications to be possible to extract the energy values from multi-threaded programs and study a bit this topic to see if it would be possible to do a detailed study on Kernel Threads10
.
After a brief study, I was able to draw some conclusions about energy consumption in user level threads. A program with a routine on data matrix 1024x1024 was executed with 1,2,4,8 and 16 threads and I found that up to 8 threads the energy consumption and the execution time decreased but it was verified that the pp1 parameter (GPU) increased, this being due to the fact that it is being executed with multi-threads. In a program with
9 LibTooling is a library to support writing standalone tools based on Clang.
10 A kernel thread is a kernel task running only in kernel mode. It usually has not been created by fork() or clone() system calls.
3.3. Green CodeCompass Plug-in 30
smaller matrices it was found that the energy consumption increased in comparison to the sequential program.
Despite these conclusions it was found that all cores returned the same energy value and so I and the members of Ericsson, came to the conclusion that there would be no time to implement and do a detailed study on multi-threading energy consumption.
Clang Tooling
The LLVM project, started at the University of Illinois, is a collection of modular and reusable compiler and tool-chainLattner(2006). LLVMhas grown into an umbrella project and now includes various open source activities from compilers to static analysis. The flagship compiler for the LLVM project is Clang, the “native” compiler of LLVM. Clang supports C, C++, Objective-C and Swift languages in the advanced level Groff and Lattner (2015). The modular, object-oriented design of Clang make it ideal for research projects require compiler-level understanding of the source code Lattner (2008). Having a well-defined interface for building the AST, exploring it in various ways and even on-the-fly modify it, I can apply the tool-chain for instrumenting the source.
In the center of my activity is theAST. TheASTcontains all important information (even the formatting informations via the stored positions of every element). The structure of the AST is representing the logical structure of the original program. For example the node which belongs to a for loop has four children: a declaration statement to introduce the loop variable, a logical expression as loop condition, an iteration expression and the body. Note that the parentheses and the semicolons in the loop header are excluded.
In theASTthere are different type of nodes such as ForStmt, FunctionDecl, BinaryOperator, etc. These types are organised to an inheritance hierarchy which has three roots: Decl, Stmt and Type. Since the fundamental part of build process is compilation of translation units, the type of the root node is TranslationUnitDecl.
One way of using the ClangAST is to visit its nodes Horváth and Pataki(2015);Clang (2016). The visitor design pattern can be used to reach every node of the tree and perform some action when the process comes to a given type of node. Clang compiler provides a very efficient way of tree traversal by RecursiveASTVisitor template class. My visitor class has to inherit from this template class of which the template parameter is my class itself. The reason of this is that with this solution my class also becomes an AST visitor by the inheritance, but it does not have to pay for virtual function calls every time when running the given visitor function for the nextASTnode.
3.3. Green CodeCompass Plug-in 31
KCachegrind
To visualize in detail and in a user-friendly way the energy consumption values of the functions and methods tested at runtime, reported by RAPL, I had to choose a good visu-alization toolfor profile data, in this case the KCachegrind11
tool.
Although I did not explore the full potential of this tool, here are some features by Wei-dendorfer and Zenith, that weighed heavily on my choice:
• Disassembler annotation and source code views, that allows to see details of cost related to assembler instructions and source lines (left tab of figure19);
• A tree-map view, which allows nested-call relations to be visualized, together with inclusive cost metric for fast visual detection of problematic functions (bottom right corner tab of figure19);
• A call-graph view, which shows a section of the call graph around the selected func-tion (top right corner tab of figure19).
Figure 19: Visualization of Profiling Data in Kcachegrind (Weidendorfer and Zenith)
The output file needs to be converted in a Callgrind format file to be read by the tool, so it was necessary to create a Python script (detailed later in section3.3.2) for that purpose.
3.3. Green CodeCompass Plug-in 32
events: package pp0 pp1 dram time #define function ID Mapping
fn=(0) usage:50 fn=(1) BaseHarnessHandlers:68 fn=(237) tassert:49 ... fl= xerces-c-3.1.4/tests/src/DOM/RangeTest/RangeTest.cpp fn=(237) 49 15 11 0 1 1
As one can see above, firstly the file needs to specify what kind of values the program will read (events), next it is necessary to map the functions by numbers (fn) and then it will have all the energy measurements (in Joules) of the functions that were used in that execution. So, in this case, the function tassert that starts in line 49 of the RangeTest.cpp file wastes 15J in package, 11J in CPU core (pp0), 0J in CPU uncore (pp1), 1J in DRAM and it took 1 second to be executed.
3.3.2 Implementation
This section describes in detail all the implementation that was developed so that it was possible to reproduce the expected effect by the Green CodeCompass plug-in.
Firstly I will explain in detail how the instrumentation tool is implemented and what modifications it makes in the source code of a given project, next I will explain the changes that I had to make in theRAPLframework, and finally I will explain why it was also neces-sary to make a Python script so that the output of the plug-in is in the proper KCachegrind format.
The Instrumentation
Based on LLVM/Clang, the LibTooling tool starts by reading the input files and will run them up my FrontendAction. It will create an AST with the parsed text of each file. For each of these generated trees it will recursively go through each node to be possible to make the necessary modifications, to include the CRAPL interface in the source code of the program that the user wants to analyze. An example:
int example(){
int a = random(); if(a<2)
example(); return a;
3.3. Green CodeCompass Plug-in 33
}
Figure 20: Example of anASTwith the nodes to be read.
Using the previously source code as example to demonstrate, the instrumentation tool will undergo the necessary modifications by traversing the nodes described in the Figure 20 and detailed below:
• VisitFunctionDecl: It visits all the nodes that are functions. If the analyzed function does not refer to a header file and has the minimum number of statements (Instruc-tions) that the user requested (with the optional flag -l) then the tool will insert the information (path, filename, declaration line and name) of that function into an index (array) of functions that will suffer the respective modifications until the end of the recursive reading of their child nodes. In addition it also modifies the source code with a CRAPL object initialization and inserts a rapl_before() call at the beginning of the functions, as one can see below with the example code:
int example(){
3.3. Green CodeCompass Plug-in 34 rapl_before(rapl); int a = random(); if(a<2) example(); return a; }
• VisitIfStmt: to maintain code consistency it is necessary to insert braces in each If or Else statement that they are not already limited by them. This because it is always required to insert a rapl_after() call before every single return statement of the given function. Following the code hitherto modified, the function will look like this: int example(){
CRapl rapl = create_rapl(0); rapl_before(rapl); int a = random(); if(a<2){ example(); } return a; }
• VisitReturnStmt: if the instrumentation tool catches a return statement anywhere in the code of the currently being analyzed function, it will insert a rapl_after() call to end the analysis of the energy consumption in that call. After this step the function will have the following shape:
int example(){
CRapl rapl = create_rapl(0); rapl_before(rapl); int a = random(); if(a<2){ example(); } rapl_after(0, rapl); return a; }
• VisitCallExpr: the first time the totality of the Plug-in (Instrumentation + CRAPL) was tested (detailed in section 3.3.3), it was noticed that some functions consumed more energy than the main function itself, which is impossible since the main is the first to be executed and the one that finishes the program. With this output results
3.3. Green CodeCompass Plug-in 35
it was realized that I was not handling recursive functions so well. After a brief talk with the Ericsson’s members the best solution I found for this problem was to limit blocks of code before and after the recursive call (i.e rapl_after() and rapl_before() instrumentations for each of these calls). This was one of the biggest challenges until I came up with a good generic solution, regardless of what kind of recursive call it is. After this step, the result is:
int example(){
CRapl rapl = create_rapl(0); rapl_before(rapl); int a = random(); if(a<2){ rapl_after(0, rapl); example(); rapl_before(rapl); } rapl_after(0, rapl); return a; }
In the end of traversing each tree (of each file), the Green CodeCompass plug-in also inserts the dependencies of the CRAPL libraries and save the changes in the correspond-ing file (or create a new one, if the -o = "example.cpp" flag is enabled). So, after all the modifications the File.c (of Figure 20) will look like this:
#include <crapl/rapl_interface.h>\n" #include <crapl/measures.h>
int example(){
CRapl rapl = create_rapl(0); rapl_before(rapl); int a = random(); if(a<2){ rapl_after(0, rapl); example(); rapl_before(rapl); } rapl_after(0, rapl); return a; }
3.3. Green CodeCompass Plug-in 36
When all the instrumentation of the files is finished, it will create the index.txt file with the information of all the modified functions to be analyzed subsequently by CRAPL: [Index:Path:Filename:Declaration_Line:Function_name] 0:xerces-c/tests/src/XSTSHarness/XSTSHarness.cpp:102:1:printFile 1:xerces-c/tests/src/XSTSHarness/XSTSHarness.cpp:138:1:error 2:xerces-c/tests/src/XSTSHarness/XSTSHarness.cpp:145:1:fatalError 3:xerces-c/tests/src/XSTSHarness/XSTSHarness.cpp:154:1:resolveEntity 4:xerces-c/tests/src/XSTSHarness/XSTSHarness.cpp:240:1:main CRAPL
From theRAPLtool I made some modifications to be possible to read the energy consump-tion of several methods or funcconsump-tions without any conflict in their readings. For this purpose, I converted the original version ofRAPLin C for a C++ object-oriented version, and then I created an interface so that RAPLcould transform both .c and .cpp files. Thus, each in-stantiated RAPLobject will read only the energy consumed by each call of that function or method.
Figure 21: How CRAPL works.
For each called function or method in the execution of a program, the CRAPL interface will create a CRAPL object to read the energy consumption before the execution of the function body. After doing their job, i.e in the moment before returning or closing the function, it will read the values of energy consumption again and subtract them with the obtained values in the beginning to reach the final energy measurement of that call (Figure 21).
In addition to the required instrumentation to retrieve the values referring to the energy measurements at runtime, it is also necessary to save this data to be written in a file at the end of the executed program.