Article
J. Braz. Chem. Soc., Vol. 29, No. 12, 2522-2534, 2018 Printed in Brazil - ©2018 Sociedade Brasileira de Química
*e-mail: [email protected]
Metabolite Fingerprinting and Profiling of the Medicinal Grass
Eleusine
indica
Based on HPLC-DAD, UPLC-DAD-MS/MS and NMR Analyses
EvelynM.C.Peñaloza,aLiviaM.Casanova,aIvanaC.R.Leal,bPaulaF.deAguiarcand
SôniaS.Costa*,a
aInstituto de Pesquisas de Produtos Naturais, Universidade Federal do Rio de Janeiro (UFRJ),
21941-901 Rio de Janeiro-RJ, Brazil
bDepartamento de Produtos Naturais e Alimentos, Faculdade de Farmácia,
Universidade Federal do Rio de Janeiro (UFRJ), 21941-901 Rio de Janeiro-RJ, Brazil
cInstituto de Química, Universidade Federal do Rio de Janeiro (UFRJ),
21941-909 Rio de Janeiro-RJ, Brazil
Aqueous preparations of the grass Eleusine indica are used for treating malaria and lung infections. Despite its widespread occurrence and therapeutic potential, little is known about its chemical composition. This study reports a common chemical pattern for aqueous extracts of
E. indica samples from four different localities, separated from each other by approximately 75 to
1340 km, in a wide variety of abiotic and biotic factors. High-performance liquid chromatography with diode array detection (HPLC-DAD), ultra-performance liquid chromatography with diode array detection and mass spectrometry (UPLC-DAD-MS/MS), and nuclear magnetic resonance (NMR) were the analytical techniques applied to characterize substances from E. indica, from each locality. Principal component analysis (PCA) confirmed that E. indica specimens came from four different localities. However, all of the four populations showed a common peaks pattern. This is the first chemical profile report of E. indica. Moreover, p-coumaric acid and isoschaftoside were characterized for the first time in this species.
Keywords:Eleusine indica, aqueous extracts, fingerprinting and metabolite profiling, phenolic compounds, geographical variation
Introduction
Eleusine indica L. (Gaertn.) (syn. Cynosurus indicus L.; Poaceae), known as goose-grass, among other synonymous names, is considered a troublesome weed.1 Its resistance to herbicides causes huge economic losses in agriculture worldwide.2 However, this plant is used medicinally in Brazil against lung infections.3 In Africa and Asia, it is used to treat malaria, among other therapeutic uses.4,5 This plant adapts to a wide range of environmental conditions, it has a strong reproductive capacity, vigorous seedlings, as well as a high tolerance for salinity and a strong competitive capacity.6 E. indica is a very common species and thus is easily accessible for human use compared to other medicinal species, especially considering low-income populations.
Due to this ease of access, there has been a growing interest in E. indica over the last ten years regarding its
pharmacological properties such as anti-inflammatory,3
antidiabetic,5 antiplasmodial,5 anti-obesity7 and antiviral.8 However, despite its therapeutic potential, there is little information concerning its chemical composition and bioactive compounds. In the 70’s, flavonoids were detected by paper chromatography in the aerial parts of E. indica.9 Since then, our research group has isolated two main flavones, schaftoside and vitexin from the aerial parts, and proved their inhibitory activity on lung neutrophil influx in mice, suggesting a possible beneficial effect on airway inflammations.3 Moreover, the correlation of three common sterols from this plant with pancreatic lipase inhibitory activity was demonstrated in an in vitro study.7 Additionally, the underground parts of E. indica have deserved much less attention from the researchers even though these vegetal parts also present medicinal properties.4
diverse biotic and abiotic factors, seasonal conditions and climatic factors. For this reason, some marker compounds are used to identify the “authenticity”of a given species. Consequently, the specimens of a given plant species should be representative of the quality traditionally specified for intended pharmacological uses.10 This creates a challenge to determine the medicinal activity of a plant extract as this heterogeneity causes the pharmacological properties of the plant to vary from one specimen to another.11 Although the identification and quantification of the constituents of an aqueous plant extract is a challenge, there are several analytical strategies to determine the chemical composition of a given complex biological matrix or extract,12 such as metabolite profiling and metabolite fingerprinting.12,13 The use of multivariate analytical tools gives a clear visualization of similarities and/or heterogeneities among the different samples collected. Principal component analysis (PCA) is usually employed to find inherent patterns and grouping samples with common characteristics, visualization of clustering and, furthermore, the detection of any outliers of the sample set.14,15 PCA has proved to be very efficient to deal with large number of variables and, for this reason, it was used in this study.16
In this sense, the aim of this study was to identify a common chemical pattern indicated by the presence of a same group of compounds reflected in the chromatographic
chemical profile of aqueous extracts from E. indica
(referred to as Ei) specimens collected from different localities in Brazil, independently of their biotic and abiotic factors (environmental conditions).
Experimental
Chemicals
Acetonitrile and acetic acid, HPLC grades, were acquired from Tedia-Brazil® (Rio de Janeiro, RJ, Brazil);
p-coumaric acid (≥ 98%), vitexin (≥ 95%) and gallic acid (97.9%) were purchased from Sigma-Aldrich (United
Kingdom, Bulgaria and Switzerland, respectively). Schaftoside was isolated from E. indica aerial parts as described in the literature by our research group.3 Deionized water was purified by a Milli-Q Gradient A 10 System
(Millipore®, Burlington, MA, USA). D
2O (99.0%) was
obtained from Cambridge Isotope Laboratories Inc®,
Tewksbury, MA, USA.
Plant materials
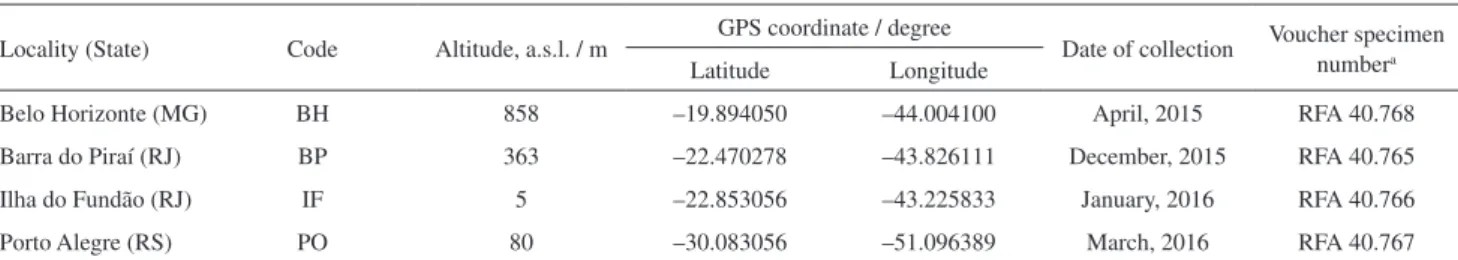
Populations of E. indica species at fructification stage were collected from four localities in three states of Brazil: Belo Horizonte (BH, Minas Gerais State), Barra do Piraí (BP, Rio de Janeiro State), Ilha do Fundão (IF, Rio de Janeiro State), and Porto Alegre (PO, Rio Grande do Sul State) (Table 1). Each population comprises a lot of individual specimens, weighting 300-1000 g of fresh vegetal material. The geographical distances between the four localities are presented as follows: the PO locality (south of the country) is 1338.74, 1113.80 and 1121.82 km distant from BH, BP and IF localities, respectively. The BH locality is 338.75 and 287.06 km distant from IF and BP localities, respectively. The IF and BP localities
are 74.87 km apart.17 The botanist Prof Dr Ana Zannin
(Federal University of Santa Catarina) identified the specimens used in this study. A voucher specimen from each locality was deposited in the Herbarium of the Institute of Biology at the Federal University of Rio de Janeiro (UFRJ).
Extract preparation
Dried E. indica (Ei) aerial (AP) and underground parts (UGP) from each locality were ground (100.0 g), separately, with a Willey No. 1 knife mill (Marconi Inc., São Paulo, SP, Brazil) into powder, which was passed through a 0.85-mm sieve in order to make them uniform. Deionized water (100 mL) was added to a 5 g aliquot of each sample and the mixture boiled for 10 min. After filtration, the extracts
Table1. Samples of aerial and underground parts from Eleusine indica collected in different Brazilian localities
Locality (State) Code Altitude, a.s.l. / m GPS coordinate / degree Date of collection Voucher specimen numbera
Latitude Longitude
Belo Horizonte (MG) BH 858 –19.894050 –44.004100 April, 2015 RFA 40.768
Barra do Piraí (RJ) BP 363 –22.470278 –43.826111 December, 2015 RFA 40.765
Ilha do Fundão (RJ) IF 5 –22.853056 –43.225833 January, 2016 RFA 40.766
Porto Alegre (RS) PO 80 –30.083056 –51.096389 March, 2016 RFA 40.767
aAll specimens were deposited in Herbarium at the Institute of Biology at the Federal University of Rio de Janeiro (UFRJ). a.s.l.: above sea level; MG:
were frozen and lyophilized. The extraction procedure was repeated thrice for Ei-AP and twice for Ei-UGP from each locality, totaling 12 and 8 extract samples, respectively. These procedures were carried out on consecutive days.
Instrumentation and chromatographic conditions
High-performance liquid chromatography with diode array detection (HPLC-DAD) analysis
HPLC-DAD analyses were performed on a Shimadzu liquid chromatographer LC-20AT with a diode array
wavelength SPD-M20A detector (Shimadzu®, Tokyo,
Japan) at IBCCF, UFRJ (RJ, Brazil). Data were processed with LC-solutions software (Shimadzu Corporation, Tokyo, Japan). Separations were carried out on a Kromasil C-18 column (250 × 4.6 mm; 5 µm particle size; AkzoNobel, Separation Products, Bohus, Sweden) at 35 °C with complete spectral data recorded at 200-700 nm, and monitored at 270, 300 and 330 nm. Samples (20 mg) of dry extract (Ei-AP and Ei-UGP) were dissolved in deionized water (2 mL) under ultrasonication (20 min)
to a final concentration of 10 mg mL-1. The solution
was filtered through a 0.45 µm filter (Merck, Darmstadt, Germany). The conditions used for all samples were: mobile phase A: 0.1% v/v aqueous solution of acetic acid; mobile phase B: acetonitrile; gradient elution starting with 0.5% B; 10 min: 15% B; 20 min: 20% B; 30 min: 21% B; 35 min: 22% B; 100% B: 38 min and then re-equilibration until total run time of 55 min. The injection volume was 20 µL, and flow rate was 0.8 mL min-1.
The independent replicate preparations of each sample (n = 3 days for Ei-AP and n = 2 days for Ei-UGP) was injected three times to ensure the reproducibility of the extraction method. The values of RSD% (relative standard deviation in percentage) showed repeatability of the analytical method being reliable and reproducible. The analytical curves showed correlation coefficients (r2) higher than 0.995 for all compounds (Table S1, Supplementary Information (SI) section).
Ultra-performance liquid chromatography with DAD and mass spectrometry (UPLC-DAD-MS/MS) analyses
A Thermo Scientific LCQ FLEET UPLC system (Thermo Fisher Scientific, Germering, BY, Germany) was used (FF, UFRJ, Brazil). The UPLC system (Daian U3000, Dionex Corporation, CA, USA) comprised a UPLC pump, a photodiode array detector (PDA), an LCQ FLEET mass spectrometer (Thermo Fisher Scientific, CA, USA) equipped with an ESI (electrospray ionization) and an APCI (atmospheric pressure chemical ionization) as ionization sources. An 8 mg sample of each lyophilized
extract (Ei-AP and Ei-UGP) was dissolved in deionized water (4 mL), under ultrasonication (10 min) to a final concentration of 2 mg mL-1, and filtered through a 0.45 µm filter. All samples were injected into the same column maintained at 35 °C and eluted with the same eluent and gradient program, whose equilibration step was reduced to 5 min. The total run time was of 50 min (see “High-performance liquid chromatography with diode array detection (HPLC-DAD) analysis” section). Injection volume was 70 µL. Metabolite detections were acquired at 254, 270, 300 and 330 nm.
MS measurements were carried out with helium as the collision gas in the ion trap and nitrogen as the sheath, sweep and auxiliary gas in the source. For ESI in the negative mode: capillary temperature was 450 °C, sheath gas flow 40 L min-1, spray voltage 5 kV and mass range was from m/z 50 to 700. For the APCI negative ionization mode: capillary temperature was 350 °C, APCI vaporizer temperature 400 °C, sheath gas flow 30 L min-1, auxiliary gas flow 15 (arbitrary units), spray voltage 6 kV and mass range was from m/z 50 to 900. An isolation width of
2 Da was used with a 30 ms activation time for the MS2
experiments. Ei-AP and Ei-UGP were analyzed by both ESI and APCI in the negative ionization mode.
All scan events were acquired with a 200 ms maximum ionization time. The accurate mass data of the molecular ions were processed with Xcalibur (version 2.2, CA, USA) software.
Nuclear magnetic resonance (NMR) analysis
All 1H NMR spectra were recorded at 25 °C on a
Varian VNMRS-500 (1H: 499.77 MHz; 13C: 125.68 MHz)
at LAMAR (IPPN, UFRJ, RJ, Brazil). A 30 mg aliquot of each lyophilized extract (Ei-AP and Ei-UGP) was dissolved with deionized water (5 mL), ultrasonicated (30 min) and centrifuged (5000 rpm, 15 min, 5 °C). After that, the supernatants were lyophilized. Then, 20 mg of each lyophilized supernatant was dissolved in a solution (700 µL)
of D2O containing 0.01 mg mL-1 sodium 2,2-dimethyl
heteronuclear multiple bond coherence adiabatic) and TOCSY (total correlation spectroscopy) were only used for the Ilha do Fundão (IF) samples (aerial and underground parts). The gCOSY and TOCSY conditions were: 256 increments with 64 scans per increment, using a 5506.6 Hz spectral width in both dimensions. The gHSQCAD
conditions were: 200 increments with 150 scans per
increment, and an optimized coupling constant of 146 Hz, using a 25133.5 Hz spectral width in F1 and 5506.6 Hz in F2. The gHMBCAD conditions were: 200 increments with 150 scans per increment and an optimized coupling constant of 8 Hz, using a 30165.9 Hz spectral width. In all cases, 1 s of relaxation delay was used. NMR spectrum data of the samples were processed through MestReNova (version 9.0; Mestrelab Research, Santiago de Compostela, Spain) software.
Data analysis and statistics
Multivariate statistical PCA analyses were performed
using STATISTICA for Windows.18
Results and Discussion
The extraction yields from each locality and for each part of the plant are available in Supplementary Information (Table S2). The mean of total mass from 5 g of dried plant material expressed in g ± standard error (SE) of the lyophilized aqueous extracts (n = 3) of Ei-AP from Belo Horizonte (BH), Barra do Piraí (BP), Ilha do Fundão (IF), and Porto Alegre (PO) were 0.68 ± 0.02, 0.74 ± 0.03, 0.76 ± 0.05, and 0.54 ± 0.02, respectively. The yields of the lyophilized aqueous extracts (n = 2) of Ei-UPG were about 2-3 times lesser than the yields from the aerial parts (BH, BP, IF, and PA = 0.23 ± 0.01, 0.28 ± 0.01, 0.43 ± 0.03, and 0.22 ± 0.01, respectively).
The HPLC-DAD qualitative and quantitative analyses of the extracts from the BH, BP, IF and PO samples (Ei-AP and Ei-UGP) gave acceptable peak resolutions (Figures 1a and 1b).
The maximum absorbance was monitored at 270, 300 and 330 nm. Thus, three classes of compounds according to the UV (ultraviolet) profile were distinguished. Group I showed peaks within a 250-280 nm range (benzoic acid derivatives and other analytes, such as some amino acids and nucleosides).19 In group II, there were peaks at 295-330 nm (cinnamic acid derivatives).19 Finally, group III encompasses peaks with absorptions at 310-330 nm (band I) and 260-280 nm (band II) suggesting flavone derivatives.20,21
C-Glycosylated flavones have already been reported in
this species.3,9 The retention times (t
R) were reproducible considering an interval confidence of ± 0.05 min.
C-Glycosylflavones schaftoside (peak 25), vitexin
(peak 32), and the hydroxycinnamic acid derivative,
p-coumaric acid (peak 30), were identified and quantified in the aqueous extracts by comparison of their tR and UV spectra with their respective standards. Additionally, they were confirmed by MS data. Vitexin and schaftoside were previously isolated from aqueous extracts of Ei-AP.3
All HPLC-DAD chromatograms were pretreated to improve the data acquisition with a slope of 1000, minimizing solvent, matrix interferences and baseline drift.15 The peaks were quantified using the analytical curves of three external standards: gallic acid (270 nm),
p-coumaric acid (300 nm) and vitexin (330 nm). In the
same way, the peaks were grouped according to the similarity of their UV spectrum in the three groups
mentioned above, expressed by gallic acid, p-coumaric
acid and vitexin equivalents, for the groups I, II and III, respectively.
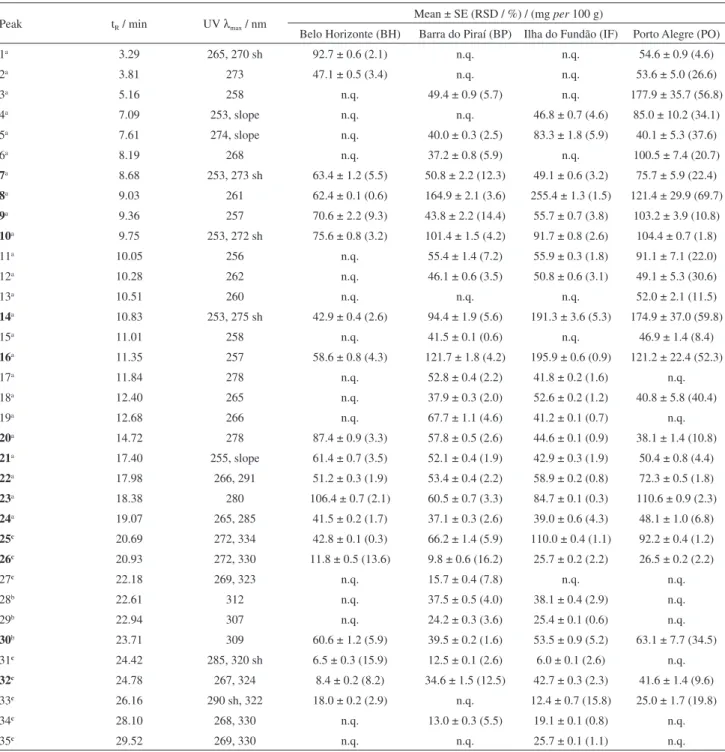
The limits of detection (LOD) and quantification (LOQ) of the method were calculated from the linearity curves of each substance (gallic acid, p-coumaric acid and vitexin), using the equations LOD = 3.3 s/b and LOQ = 10 s/b, respectively (where s is the residual standard deviation of the regression lines and b is the slope of the calibration curve).22 Within the limit of detection (LOD), 52 and 38 peaks were detected in Ei-AP and Ei-UGP, respectively. Among them, 35 (Ei-AP) and 22 peaks (Ei-UGP) were quantified within the limit of quantification (LOQ). It is worth highlighting that by means of comparison amongst chromatograms, 15 peaks in Ei-AP and 10 peaks in Ei-UGP were found to be common to the four different localities, as shown in Figure 1 and designated in bold type in Table 2. These peaks were considered as the main compounds, therefore, they were quantified (Table 2 and Table S3, SI section). It is noteworthy that these common peaks, observed even among samples from localities situated more than 1000 km apart, suggest that there is a chemical pattern for aqueous extracts of Eleusine indica from different geographical areas. Therefore, we considered that these common peaks (15 peaks for aerial and 10 peaks for underground parts) are suitable for characterization of
the speciesby HPLC-DAD.
The most prominent peaks among the 15 and 10 peaks for Ei-AP and Ei-UGP, were those referring to p-coumaric acid in both the aerial and underground parts, and vitexin with schaftoside only in the aerial parts.
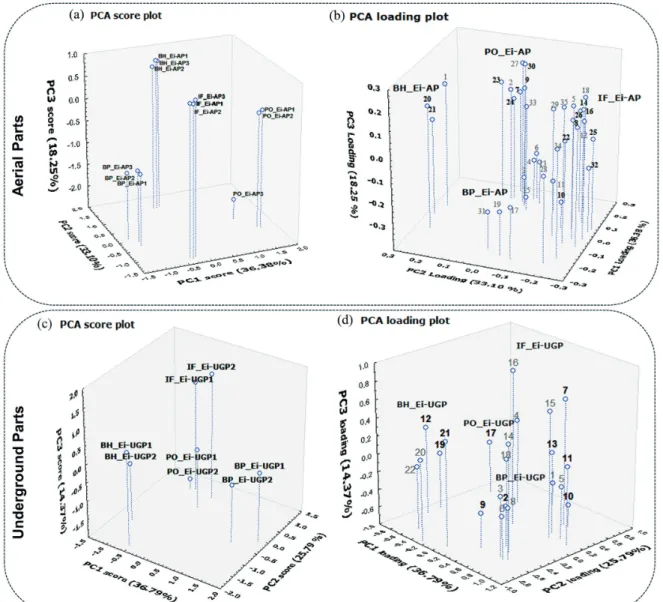
Additionally, the HPLC-DAD-derived datasets in our study were analyzed by PCA for the discrimination of the geographical origin. Two data matrices, 35 (peaks) × 12 (samples) and 22 (peaks) × 8 (samples) for Ei-AP and
Table2. Phenolic profile by HPLC-DAD analyses (270, 300 and 330 nm) of lyophilized extracts from Eleusine indica aerial parts (Ei-AP) collected from different localities in Brazil
Peak tR / min UV λmax / nm
Mean ± SE (RSD / %) / (mg per 100 g)
Belo Horizonte (BH) Barra do Piraí (BP) Ilha do Fundão (IF) Porto Alegre (PO)
1a 3.29 265, 270 sh 92.7 ± 0.6 (2.1) n.q. n.q. 54.6 ± 0.9 (4.6)
2a 3.81 273 47.1 ± 0.5 (3.4) n.q. n.q. 53.6 ± 5.0 (26.6)
3a 5.16 258 n.q. 49.4 ± 0.9 (5.7) n.q. 177.9 ± 35.7 (56.8)
4a 7.09 253, slope n.q. n.q. 46.8 ± 0.7 (4.6) 85.0 ± 10.2 (34.1)
5a 7.61 274, slope n.q. 40.0 ± 0.3 (2.5) 83.3 ± 1.8 (5.9) 40.1 ± 5.3 (37.6)
6a 8.19 268 n.q. 37.2 ± 0.8 (5.9) n.q. 100.5 ± 7.4 (20.7)
7a 8.68 253, 273 sh 63.4 ± 1.2 (5.5) 50.8 ± 2.2 (12.3) 49.1 ± 0.6 (3.2) 75.7 ± 5.9 (22.4)
8a 9.03 261 62.4 ± 0.1 (0.6) 164.9 ± 2.1 (3.6) 255.4 ± 1.3 (1.5) 121.4 ± 29.9 (69.7)
9a 9.36 257 70.6 ± 2.2 (9.3) 43.8 ± 2.2 (14.4) 55.7 ± 0.7 (3.8) 103.2 ± 3.9 (10.8)
10a 9.75 253, 272 sh 75.6 ± 0.8 (3.2) 101.4 ± 1.5 (4.2) 91.7 ± 0.8 (2.6) 104.4 ± 0.7 (1.8)
11a 10.05 256 n.q. 55.4 ± 1.4 (7.2) 55.9 ± 0.3 (1.8) 91.1 ± 7.1 (22.0)
12a 10.28 262 n.q. 46.1 ± 0.6 (3.5) 50.8 ± 0.6 (3.1) 49.1 ± 5.3 (30.6)
13a 10.51 260 n.q. n.q. n.q. 52.0 ± 2.1 (11.5)
14a 10.83 253, 275 sh 42.9 ± 0.4 (2.6) 94.4 ± 1.9 (5.6) 191.3 ± 3.6 (5.3) 174.9 ± 37.0 (59.8)
15a 11.01 258 n.q. 41.5 ± 0.1 (0.6) n.q. 46.9 ± 1.4 (8.4)
16a 11.35 257 58.6 ± 0.8 (4.3) 121.7 ± 1.8 (4.2) 195.9 ± 0.6 (0.9) 121.2 ± 22.4 (52.3)
17a 11.84 278 n.q. 52.8 ± 0.4 (2.2) 41.8 ± 0.2 (1.6) n.q.
18a 12.40 265 n.q. 37.9 ± 0.3 (2.0) 52.6 ± 0.2 (1.2) 40.8 ± 5.8 (40.4)
19a 12.68 266 n.q. 67.7 ± 1.1 (4.6) 41.2 ± 0.1 (0.7) n.q.
20a 14.72 278 87.4 ± 0.9 (3.3) 57.8 ± 0.5 (2.6) 44.6 ± 0.1 (0.9) 38.1 ± 1.4 (10.8)
21a 17.40 255, slope 61.4 ± 0.7 (3.5) 52.1 ± 0.4 (1.9) 42.9 ± 0.3 (1.9) 50.4 ± 0.8 (4.4)
22a 17.98 266, 291 51.2 ± 0.3 (1.9) 53.4 ± 0.4 (2.2) 58.9 ± 0.2 (0.8) 72.3 ± 0.5 (1.8)
23a 18.38 280 106.4 ± 0.7 (2.1) 60.5 ± 0.7 (3.3) 84.7 ± 0.1 (0.3) 110.6 ± 0.9 (2.3)
24a 19.07 265, 285 41.5 ± 0.2 (1.7) 37.1 ± 0.3 (2.6) 39.0 ± 0.6 (4.3) 48.1 ± 1.0 (6.8)
25c 20.69 272, 334 42.8 ± 0.1 (0.3) 66.2 ± 1.4 (5.9) 110.0 ± 0.4 (1.1) 92.2 ± 0.4 (1.2)
26c 20.93 272, 330 11.8 ± 0.5 (13.6) 9.8 ± 0.6 (16.2) 25.7 ± 0.2 (2.2) 26.5 ± 0.2 (2.2)
27c 22.18 269, 323 n.q. 15.7 ± 0.4 (7.8) n.q. n.q.
28b 22.61 312 n.q. 37.5 ± 0.5 (4.0) 38.1 ± 0.4 (2.9) n.q.
29b 22.94 307 n.q. 24.2 ± 0.3 (3.6) 25.4 ± 0.1 (0.6) n.q.
30b 23.71 309 60.6 ± 1.2 (5.9) 39.5 ± 0.2 (1.6) 53.5 ± 0.9 (5.2) 63.1 ± 7.7 (34.5)
31c 24.42 285, 320 sh 6.5 ± 0.3 (15.9) 12.5 ± 0.1 (2.6) 6.0 ± 0.1 (2.6) n.q.
32c 24.78 267, 324 8.4 ± 0.2 (8.2) 34.6 ± 1.5 (12.5) 42.7 ± 0.3 (2.3) 41.6 ± 1.4 (9.6)
33c 26.16 290 sh, 322 18.0 ± 0.2 (2.9) n.q. 12.4 ± 0.7 (15.8) 25.0 ± 1.7 (19.8)
34c 28.10 268, 330 n.q. 13.0 ± 0.3 (5.5) 19.1 ± 0.1 (0.8) n.q.
35c 29.52 269, 330 n.q. n.q. 25.7 ± 0.1 (1.1) n.q.
aPeaks of group I: benzoic acid derivatives, amino acids and nucleosides (λ
max 250-280 nm) were expressed as 1 mg of gallic acid per 100 g of lyophilized
extract; bpeaks of group II: cinnamic acid derivatives (λ
max 295-330 nm) were expressed as 1 mg of p-coumaric acid per 100 g of lyophilized extract; cpeaks
of group III: flavone derivatives (λmax 310-335 nm for band I and 260-280 nm for band II) were expressed as 1 mg of vitexin per 100 g of lyophilized extract.
tR: retention time, each value is mean ± 0.05 (min). RSD: percentage of relative standard deviation are in parentheses; n.q.: not quantified; sh: shoulder.
Ei-UGP, respectively, were used. PCA scores showed a clear separation (Figures 2a, 2c) in the three-dimensional space. The first three principal components had the highest eigenvalue and accounted for 36.38% (PC1), 33.10% (PC2) and 18.25% (PC3) of the total variability for the aerial parts. For the underground parts, the first three principal components accounted for 36.79, 25.79 and 14.37% of the total variability, respectively (Figures 2a-d).
Four distinct tight clusters were formed in Ei-AP (Figure 2a) and in Ei-UGP (Figure 2c) from their PCA score plots. It is noteworthy that all extraction’s replicates from specimens of each locality were clustered together and have been separated according to their geographic origins, confirming the reliability of the methods used in this study and the difference on the extracts of all localities.
One of the replicates from PO aerial parts had a slight difference in comparison with the others. Additionally, the PCA loading plot (Figures 2b and 2d) showed how those variables contribute to each principal component from the investigated samples to the total variability. We wanted to understand how these common peaks are distributed and how they contribute to the separation of the four localities. In this way, it was necessary to evaluate these peaks for each locality, regardless all sort of environment and edapho-climatic factors.
Table 3 shows some common and non-common peaks with the major contribution or higher concentrations in each locality and the UV spectrum group. The peaks common to the four localities were highlighted in bold. It is important to emphasize that the numbers designated in the
chromatogram for aerial parts do not have correspondence with the numbers designated for underground parts.
Ei-AP from the IF and PO localities had a greater number of common peaks that mostly contributed to the separation of the groups: 8 (I), 14 (I), 16 (I), 25 (III), 26 (III) and 7 (I), 9 (I), 23 (III), 24 (I), 30 (II) for IF and PO localities, respectively. Differently, BP locality has not shown any common peak that contributed to the separation from other localities. BH locality just showed two common peaks (20 and 21) that contributed to the separation, both belonging to group I (Table 3). With respect to Ei-UGP, the highest number of common peaks responsible for the separation was found in the BH and BP samples. For the BH samples, these peaks were found in the groups I (19), II (21) and III (22), whereas BP samples had common peaks from group I (11 and 13). IF sample had no common peak and PO exhibited just one common peak 17 (I). In this sense, these analyses allow to observe a wide variety in the metabolites in the aerial and underground parts of the plant following their corresponding geographical origin. In addition, we suggest that these common peaks
could represent the characteristic peaks for each locality. PCA algorithm has shown clearly the differentiation of the specimens by locality, which systematically reflected the influence of different biotic and abiotic factors, such as geographical origin, seasonality, genetic factor, etc.
The UPLC-DAD-MS/MS analyses confirmed the identity of various compounds detected and quantified by HPLC-DAD in Ei-AP and Ei-UGP after careful analysis of their MS and MS/MS data (Table 4). Compounds identified by UPLC-DAD-MS/MS were correlated to their corresponding peaks in the HPLC-DAD chromatogram based on the elution order and UV-Vis spectra.
The flavonoids schaftoside (25), isoschaftoside (26), and vitexin (32) were identified in Ei-AP (Figure 3 and Figures S2, S3 and S4 (SI section)). The phenolic
p-coumaric acid was identified in the aerial (30) and
underground (21) parts (Figure 3 and Figures S1 and S5 (SI section)). The only compound identified in Ei-UGP was p-coumaric acid.
Peaks 25 (tR = 18.89 min; λmax = 214, 272, 333 nm) and 26 (tR = 19.19 min; λmax = 213, 274, 320 nm) were
Table3. HPLC-DAD peaks (270, 300 and 330 nm) grouped by PCA for the lyophilized extracts from Eleusine indica aerial (Ei-AP) and underground parts (Ei-UGP) collected in different Brazilian localities
Plant organ (Eleusine indica) Geographic origin Peaks grouped by PCA (designation by UV spectrum)a
Aerial parts
BH 20(I), 21(I), 1 (I)
BP 31 (III), 19 (I), 17 (I)
IF 5 (I), 8(I), 14(I), 18 (I), 16(I), 25(III), 26(III), 35 (III)
PO 2 (I), 3 (I), 4 (I), 6 (I), 7(I), 9(I), 23(III), 24(I), 30(II), 33 (III)
Underground parts
BH 19(I), 20 (I), 21(II), 22(III)
BP 2 (I), 3 (I), 6 (I), 8 (I), 11(I), 13(I)
IF 4 (I), 7 (I), 16 (I)
PO 17(I), 18 (I)
aRoman numerals designated (I, II and III) for both aerial and underground parts are according to classification of their UV-spectrum (I: benzoic acid
derivatives, aromatic amino acids and nucleosides (270 nm); II: cinnamic acid derivatives (300 nm); III: flavone derivatives (330 nm)). Localities: BH: Belo Horizonte, Minas Gerais State; BP: Barra do Piraí and IF: Ilha do Fundão, Rio de Janeiro State; and PO: Porto Alegre, Rio Grande do Sul State, Brazil. Numbers in bold were common to the four localities and were quantified.
Table4. Metabolites identified by UPLC-DAD-MS/MS of lyophilized extracts from Eleusine indica aerial (Ei-AP) and underground parts (Ei-UGP) using negative ionization mode
Peak (plant organ)a t
R / min UV / nm
Molecular ion
[M – H]– MS/MS fragment ion
d Compound Reference
25 (AP) 18.89 214, 272, 333 563.25b 545.17 (7.38), 473.08 (60.86), 443.08 (100),
383.17 (65.28), 353.17 (66.88), 325.17 (2.80)
schaftoside standard
26 (AP) 19.19 213, 274, 320 563.17b 545.17 (9.50), 503.08 (28.33), 473.08 (65.02),
443.17 (61.63), 383.08 (86.47), 353.08 (100)
isoschaftoside Picariello et al.26
30 (AP), 21 (UGP) 22.61 219, 309 163.00c 119.0 p-coumaric acid standard
32 (AP) 23.39 214, 269, 324 431.08b 341.00 (11.49), 311.08 (100), 283.08 (8.52) vitexin standard
aPlant organs of Eleusine indica are abbreviated by letter code: AP: aerial parts and UGP: underground parts; bconfirmation by MS/MS using electrospray
ionization (ESI); cconfirmation by MS/MS using atmospheric pressure chemical ionization (APCI); dnumbers in parentheses show the relative abundance
identified as C-glycosylflavone derivatives, both showing the same deprotonated molecular ion at m/z 563 [M – H]–. They presented characteristic losses of fragment ions at
m/z 120 and 90 (C-hexosyl unit).23 Also, fragments at
m/z 383 (aglycone + 113) and m/z 353 (aglycone + 83) are characteristic of apigenin di-C-glycosides.24 Additionally, the fragment ions at m/z 473 [M – H – 90]– and 443.1
[M – H – 120]– suggested that the compounds mentioned
above have the structure of 6-C-pentosyl-8-C-glucosyl apigenin or 6-C-glucosyl-8-C-pentosyl apigenin. For peak 25, the fragment at m/z 443 [M – H – 120]– was more intense than the fragment at m/z 473, suggesting the presence of a 8-C-pentosyl unit that is compatible with 6-C -glucosyl-8-C-arabinosyl apigenin (schaftoside),25,26 which was confirmed by comparison with a schaftoside standard. On the other hand, the fragment ion at m/z 473 was the most intense for peak 26. In addition, an intense peak at m/z 503 [M – H – 60]– suggested a 6-C-pentosyl moiety, compatible with 6-C-arabinosyl-8-C-glucosyl apigenin. The relative intensity of the fragment ion at m/z 545 [M – H – 18]– suggested that this compound was isoschaftoside.26
Peaks 30 (aerial parts; tR = 22.43 min) and 21
(underground parts; tR = 22.44 min; λmax = 219, 309 nm) showed a deprotonated molecular ion at m/z 163 [M – H]– and a product ion at m/z 119 (loss of CO2 [M – H – 44]–),
suggestive of p-coumaric acid, which was corroborated
by comparison with a p-coumaric acid standard. Peak
32 (tR = 23.39 min; λmax = 214, 269, 324) showed a
deprotonated molecular ion at m/z 431. A fragment ion at
m/z 311 indicated the presence of a hexose moiety linked to apigenin.27 In addition, fragment ions at m/z 395, 341 and 283 suggested the identification of vitexin, which was confirmed by comparison with a vitexin standard.
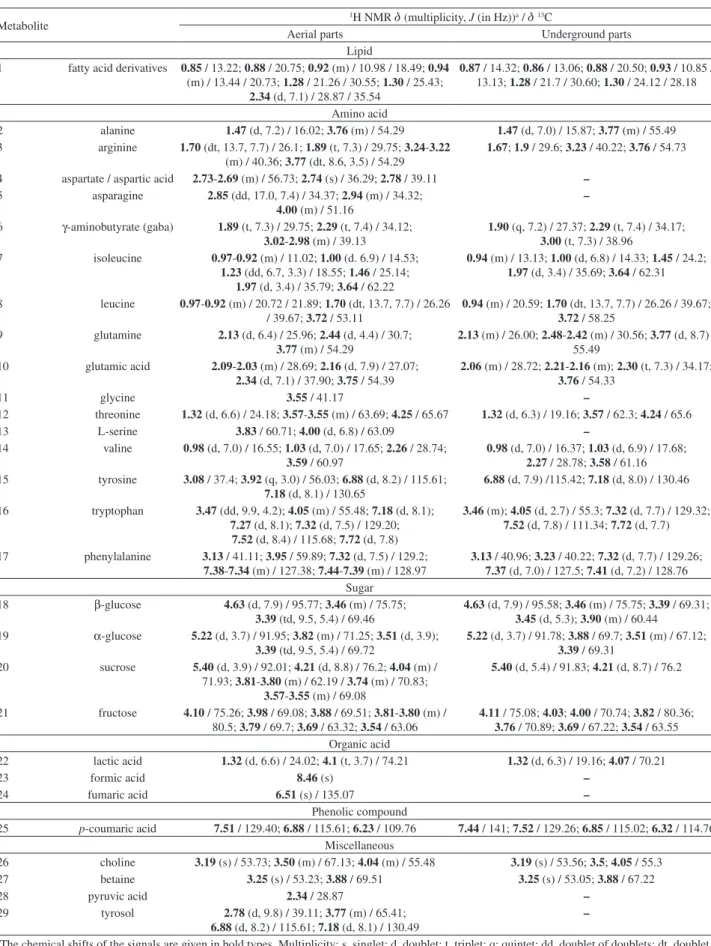
NMR spectroscopy has been used to assess the wide array of metabolites and to identify a maximum number of compounds in a complex mixture. The 1H NMR spectra of the extracts from Ei-PA and Ei-UGP are shown in Figure 4.
Chemical shifts and coupling constants of some metabolites (lipids, amino acids, sugars, phenolic compounds and organic acids) provided clues for their identification. The overlapping of peaks was overcome with the help of gCOSY, gHSQCAD, gHMBCAD, and TOCSY experiments, providing the classification of 29 and 21 compounds in aerial and underground parts, respectively. Compounds were identified by comparison with those found in Human Metabolome Database, Biological Magnetic Resonance Data Bank (BMRB), Madison Metabolomics Consortium Database (MMCD), as well in the literature.14,21,28-32
These data are summarized in Table 5 (Ei-AP and Ei-UGP). The aliphatic region 0.8-3.5 ppm showed signals that were mainly attributed to amino acids, organic acids and hydrogens of alkyl chain, which are compatible with fatty acid (palmitoyl) derivatives.33
At 3.5-5.5 ppm we observed signals corresponding to CH–OH from carbohydrates. However, this region was highly congested, suggesting a high amount of these substances. Due to the great amount of signal overlap, only simple mono and disaccharides were identified (glucose,
fructose and sucrose). In the 6.0-8.0 ppm region, we detected signals corresponding to phenolic derivatives and aromatic amino acids, but at a much lesser intensity than those observed in the aliphatic and sugar regions. Thus, among the phenolic substances identified by means
of UPLC-DAD-MS/MS, only p-coumaric acid was
recognized. Furthermore, signals of three aromatic amino acids were identified in this region. Besides, strong singlets at d 3.19 and 3.25 (s) indicative of N-(CH3)3 suggested the presence of choline and betaine.
Detailed gHSQCAD, gHMBCAD and gCOSY relations of the individual metabolites are presented in the Supplementary Information (Figures S6-S12). From a qualitative point of view, there was a recognizable difference between the two plant organs, with less amino acids, organic acids and miscellaneous compounds in the underground parts than in the aerial parts.
Although the high complexity of the NMR spectra did not allow the identification of all substances due to signal overlap, especially in the carbohydrate region, the qualitative profiling through one- and two-dimensional NMR was able to detect several metabolites in the crude extracts from the aerial parts. The high complexity of plant aqueous extracts and the limited sensitivity of NMR, however, hinder the identification of minor constituents, such as phenolic substances. Thus, we used additional analytical techniques for the quantification of some of these substances in the extracts.
Conclusions
As far as we know, we report here for the first time a common chemical pattern for aqueous extracts from aerial and underground parts of Eleusine indica, as well as the chemical composition of its underground parts, for the geographical area of study. In addition, this is the first report of the anti-inflammatory phenolic compounds p-coumaric acid and isoschaftoside in the plant. Moreover, a variety of primary and secondary metabolites was identified in the aqueous extract by NMR spectroscopy. PCA allowed to separate all samples among the aqueous extracts of
E. indica specimens harvested at different localities. Furthermore, this study provides a global metabolic pattern and some chemical biomarkers for this medicinal grass, which has been deserving an increasing interest from the pharmacological point of view last years.
Supplementary Information
Figure4.1H NMR spectra (0.0-8.50 ppm, 499.77 MHz, 20 mg (Ei)/0.7 mL D
2O, 25 °C) of lyophilized extracts from Eleusine indica: (a) aerial parts and
Table5. Metabolites of lyophilized extracts from Eleusine indica aerial and underground parts based on 1H NMR and 2D NMR spectra
Metabolite
1H NMR d (multiplicity, J (in Hz))a / d13C
Aerial parts Underground parts
Lipid
1 fatty acid derivatives 0.85 / 13.22; 0.88 / 20.75; 0.92 (m) / 10.98 / 18.49; 0.94 (m) / 13.44 / 20.73; 1.28 / 21.26 / 30.55; 1.30 / 25.43;
2.34 (d, 7.1) / 28.87 / 35.54
0.87 / 14.32; 0.86 / 13.06; 0.88 / 20.50; 0.93 / 10.85 / 13.13; 1.28 / 21.7 / 30.60; 1.30 / 24.12 / 28.18
Amino acid
2 alanine 1.47 (d, 7.2) / 16.02; 3.76 (m) / 54.29 1.47 (d, 7.0) / 15.87; 3.77 (m) / 55.49 3 arginine 1.70 (dt, 13.7, 7.7) / 26.1; 1.89 (t, 7.3) / 29.75; 3.24-3.22
(m) / 40.36; 3.77 (dt, 8.6, 3.5) / 54.29
1.67; 1.9 / 29.6; 3.23 / 40.22; 3.76 / 54.73
4 aspartate / aspartic acid 2.73-2.69 (m) / 56.73; 2.74 (s) / 36.29; 2.78 / 39.11 – 5 asparagine 2.85 (dd, 17.0, 7.4) / 34.37; 2.94 (m) / 34.32;
4.00 (m) / 51.16
–
6 γ-aminobutyrate (gaba) 1.89 (t, 7.3) / 29.75; 2.29 (t, 7.4) / 34.12; 3.02-2.98 (m) / 39.13
1.90 (q, 7.2) / 27.37; 2.29 (t, 7.4) / 34.17; 3.00 (t, 7.3) / 38.96
7 isoleucine 0.97-0.92 (m) / 11.02; 1.00 (d. 6.9) / 14.53; 1.23 (dd, 6.7, 3.3) / 18.55; 1.46 / 25.14;
1.97 (d, 3.4) / 35.79; 3.64 / 62.22
0.94 (m) / 13.13; 1.00 (d, 6.8) / 14.33; 1.45 / 24.2; 1.97 (d, 3.4) / 35.69; 3.64 / 62.31
8 leucine 0.97-0.92 (m) / 20.72 / 21.89; 1.70 (dt, 13.7, 7.7) / 26.26 / 39.67; 3.72 / 53.11
0.94 (m) / 20.59; 1.70 (dt, 13.7, 7.7) / 26.26 / 39.67; 3.72 / 58.25
9 glutamine 2.13 (d, 6.4) / 25.96; 2.44 (d, 4.4) / 30.7; 3.77 (m) / 54.29
2.13 (m) / 26.00; 2.48-2.42 (m) / 30.56; 3.77 (d, 8.7) / 55.49
10 glutamic acid 2.09-2.03 (m) / 28.69; 2.16 (d, 7.9) / 27.07; 2.34 (d, 7.1) / 37.90; 3.75 / 54.39
2.06 (m) / 28.72; 2.21-2.16 (m); 2.30 (t, 7.3) / 34.17; 3.76 / 54.33
11 glycine 3.55 / 41.17 –
12 threonine 1.32 (d, 6.6) / 24.18; 3.57-3.55 (m) / 63.69; 4.25 / 65.67 1.32 (d, 6.3) / 19.16; 3.57 / 62.3; 4.24 / 65.6
13 L-serine 3.83 / 60.71; 4.00 (d, 6.8) / 63.09 –
14 valine 0.98 (d, 7.0) / 16.55; 1.03 (d, 7.0) / 17.65; 2.26 / 28.74; 3.59 / 60.97
0.98 (d, 7.0) / 16.37; 1.03 (d, 6.9) / 17.68; 2.27 / 28.78; 3.58 / 61.16 15 tyrosine 3.08 / 37.4; 3.92 (q, 3.0) / 56.03; 6.88 (d, 8.2) / 115.61;
7.18 (d, 8.1) / 130.65
6.88 (d, 7.9) /115.42; 7.18 (d, 8.0) / 130.46
16 tryptophan 3.47 (dd, 9.9, 4.2); 4.05 (m) / 55.48; 7.18 (d, 8.1); 7.27 (d, 8.1); 7.32 (d, 7.5) / 129.20;
7.52 (d, 8.4) / 115.68; 7.72 (d, 7.8)
3.46 (m); 4.05 (d, 2.7) / 55.3; 7.32 (d, 7.7) / 129.32; 7.52 (d, 7.8) / 111.34; 7.72 (d, 7.7)
17 phenylalanine 3.13 / 41.11; 3.95 / 59.89; 7.32 (d, 7.5) / 129.2; 7.38-7.34 (m) / 127.38; 7.44-7.39 (m) / 128.97
3.13 / 40.96; 3.23 / 40.22; 7.32 (d, 7.7) / 129.26; 7.37 (d, 7.0) / 127.5; 7.41 (d, 7.2) / 128.76 Sugar
18 β-glucose 4.63 (d, 7.9) / 95.77; 3.46 (m) / 75.75; 3.39 (td, 9.5, 5.4) / 69.46
4.63 (d, 7.9) / 95.58; 3.46 (m) / 75.75; 3.39 / 69.31; 3.45 (d, 5.3); 3.90 (m) / 60.44
19 α-glucose 5.22 (d, 3.7) / 91.95; 3.82 (m) / 71.25; 3.51 (d, 3.9); 3.39 (td, 9.5, 5.4) / 69.72
5.22 (d, 3.7) / 91.78; 3.88 / 69.7; 3.51 (m) / 67.12; 3.39 / 69.31
20 sucrose 5.40 (d, 3.9) / 92.01; 4.21 (d, 8.8) / 76.2; 4.04 (m) / 71.93; 3.81-3.80 (m) / 62.19 / 3.74 (m) / 70.83;
3.57-3.55 (m) / 69.08
5.40 (d, 5.4) / 91.83; 4.21 (d, 8.7) / 76.2
21 fructose 4.10 / 75.26; 3.98 / 69.08; 3.88 / 69.51; 3.81-3.80 (m) / 80.5; 3.79 / 69.7; 3.69 / 63.32; 3.54 / 63.06
4.11 / 75.08; 4.03; 4.00 / 70.74; 3.82 / 80.36; 3.76 / 70.89; 3.69 / 67.22; 3.54 / 63.55 Organic acid
22 lactic acid 1.32 (d, 6.6) / 24.02; 4.1 (t, 3.7) / 74.21 1.32 (d, 6.3) / 19.16; 4.07 / 70.21
23 formic acid 8.46 (s) –
24 fumaric acid 6.51 (s) / 135.07 –
Phenolic compound
25 p-coumaric acid 7.51 / 129.40; 6.88 / 115.61; 6.23 / 109.76 7.44 / 141; 7.52 / 129.26; 6.85 / 115.02; 6.32 / 114.76 Miscellaneous
26 choline 3.19 (s) / 53.73; 3.50 (m) / 67.13; 4.04 (m) / 55.48 3.19 (s) / 53.56; 3.5; 4.05 / 55.3 27 betaine 3.25 (s) / 53.23; 3.88 / 69.51 3.25 (s) / 53.05; 3.88 / 67.22
28 pyruvic acid 2.34 / 28.87 –
29 tyrosol 2.78 (d, 9.8) / 39.11; 3.77 (m) / 65.41; 6.88 (d, 8.2) / 115.61; 7.18 (d, 8.1) / 130.49
–
aThe chemical shifts of the signals are given in bold types. Multiplicity: s, singlet; d, doublet; t, triplet; q; quintet; dd, doublet of doublets; dt, doublet of
Acknowledgments
E. M. C. Peñaloza and L. M. Casanova are grateful to CAPES (Brazil) and CNPq (Brazil), respectively, for PhD fellowships. We thank especially Prof Sandra M. F. O. Azevedo (IBCCF, UFRJ, Brazil) for her kindness in allowing our access to the HPLC-DAD system and Prof Rosineide C. Simas (FF, UFRJ, Brazil) for the help with mass spectrometry. We also thank Maria Amélia Borborema
(Belo Horizonte, Brazil) for providing E. indica (BH
sample).
References
1. Lim, T. K.; Edible Medicinal and Non-Medicinal Plants, vol. 11; Springer International Publishing AG: Basel, Switzerland, 2016, p. 230.
2. Chen, J.; Huang, Z.; Huang, H.; Wei, S.; Liu, Y.; Jiang, C.; Zhang, J.; Zhang, C.; Sci. Rep. 2017, 7, 1.
3. de Melo, G. O.; Muzitano, M. F.; Legora-Machado, A.; Almeida, T. A.; Oliveira, D. B.; Kaiser, C. R.; Koatz, V. L. G.; Costa, S. S.; Planta Med. 2005, 71, 362.
4. Ettebong, E.; Nwafor, P.; Okokon, J.; Asian Pac. J. Trop. Med. 2012, 5, 673.
5. Okokon, J. E.; Odomena, C. S.; Imabong, E.; Obot, J.; Udobang, J. A.; Int. J. Drug Dev. Res. 2010, 2, 493.
6. Xiang, G. H.; Gu, J. Z.; Wang, Y.; Peng, Y. L.; Guizhou Agric. Sci. 2012, 8, 129.
7. Ong, S. L.; Mah, S. H.; Lai, H. Y.; J. Pharm. (Cairo) 2016, article ID 8764274. DOI: 10.1155/2016/8764274.
8. Iberahim, R.; Bahtiar, A. A.; Ibrahim, N.; Malays. J. Microbiol. 2016, 12, 471.
9. Hilu, K. W.; De Wet, J. M. J.; Seigler, D.; Biochem. Syst. Ecol. 1978, 6, 247.
10. Brinckmann, J. A.; World J. Tradit. Chin. Med. 2015, 1, 16. DOI: 10.15806/j.issn.2311-8571.2014.0020.
11. Chatterjee, S.; Srivastava, S.; Khalid, A.; Singh, N.; Sangwan, S. R.; Sidhu, O. P.; Roy, R.; Khetrapal, C. L.; Tuli, R.; Phytochemistry 2010, 71, 1085.
12. Wolfender, J.-L.; Marti, G.; Thomas, A.; Bertrand, S.; J. Chromatogr. A 2015, 1382, 136.
13. Schripsema, J.; Phytochem. Anal. 2010, 21, 14.
14. Kruger, N. J.; Troncoso-Ponce, M. A.; Ratcliffe, R. G.; Nat. Protoc. 2008, 3, 1001.
15. Pardo-Mates, N.; Vera, A.; Barbosa, S.; Hidalgo-Serrano, M.; Núñez, O.; Saurina, J.; Hernández-Cassou, S.; Puignou, L.;
Food Chem. 2017, 221, 29.
16. Qin, X.; Dai, Y.; Liu, N. Q.; Li, Z.; Liu, X.; Hu, J.; Choi, Y. H.; Verpoorte, R.; Planta Med. 2012, 78, 926.
17. https://gps-coordinates.org/distance-between-coordinates.php, accessed on April 15, 2018.
18. STATISTICA, version 8; Statsoft®, Tulsa, OK, USA.
19. Abad-García, B.; Berrueta, L. A.; Garmón-Lobato, S.; Gallo, B.; Vicente, F.; J. Chromatogr. A 2009, 1216, 5398.
20. de Rijke, E.; Out, P.; Niessen, W. M. A.; Ariese, F.; Gooijer, C.; Brinkman, U. A. T.; J. Chromatogr. A 2006, 1112, 31. 21. Gómez-Romero, M.; Segura-Carretero, A.;
Fernández-Gutiérrez, A.; Phytochemistry 2010, 71, 1848.
22. International Conference on Harmonization (ICH); Harmonized Tripartite Guideline. Validation of Analytical Procedures: Text
and Methodology Q2 (R1); ICH: Geneva, 2005.
23. Barreira, J. C. M.; Dias, M. I.; Zivković, J.; Stojković, D.; Soković, M.; Santos-Buelga, C.; Ferreira, I. C. F. R.; Food Chem. 2014, 15, 275.
24. Feng, C.-Y.; Li, S.-S.; Yin, D.-D.; Zhang, H.-J.; Tian, D.-K.; Wu, Q.; Wang, L.-J.; Su, S.; Wang, L.-S.; Ind. Crops Prod. 2016, 87, 96.
25. Nikolov, N.; Dellamonica, G.; Chopin, J.; Phytochemistry 1981, 20, 2780.
26. Picariello, G.; Sciammaro, L.; Siano, F.; Volpe, M. G.; Puppo, M. C.; Mamone, G.; Food Res. Int. 2017, 99, 730.
27. Negri, G.; de Santi, D.; Tabach, R.; Braz. J. Pharmacogn. 2011, 22, 1024.
28. Sobolev, A. P.; Segre, A.; Lamanna, R.; Magn. Reson. Chem. 2003, 41, 237.
29. Sobolev, A. P.; Brosio, E.; Gianferri, R.; Segre, A. L.; Magn. Reson. Chem. 2005, 43, 625.
30. López-Gresa, M. P.; Lisón, P.; Kim, H. K.; Choi, Y. H.; Verpoorte, R.; Rodrigo, I.; Conejero, V.; Bellés, J. M.; J. Plant Physiol. 2012, 169, 1586.
31. Gogna, N.; Hamid, N.; Dorai, K.; J. Pharm. Biomed. Anal. 2015, 115, 74.
32. Casanova, L.; Espindola-Netto, J.; Tinoco, L.; Sola-Penna, M.; Costa, S.; Chem. Biodiversity 2016, 13, 686.
33. Phuong, N. M.; Sung, T. V.; Ripperger, H.; Adam, G.; Planta Med. 1994, 60, 498.
Submitted: April 23, 2018
Published online: July 6, 2018