1
Universidade Estadual Paulista Júlio de Mesquita Filho, Faculdade de Ciências Farmacêuticas, Pós-Graduação em Alimentos e Nutrição. Rod. Araraquara, Jaú Km 1, 14801-902, Araraquara, SP, Brasil. Correspondência para/Correspondence to MN RAVELLI. E-mail: <[email protected]>.
2
Universidade Estadual Paulista Júlio de Mesquita Filho, Faculdade de Ciências Agronômicas, Departamento de Produção e Melhoramento Vegetal. Botucatu, SP, Brasil.
3
Universidade Estadual Paulista Júlio de Mesquita Filho, Instituto de Biociência, Departamento de Bioestatística. Botucatu, SP, Brasil.
4
Clínica Bariátrica de Piracicaba, SP, Brasil. 5
Universidade Estadual Paulista Júlio de Mesquita Filho, Instituto de Biociências, Departamento de Educação. Botucatu, SP, Brasil.
Como citar este artigo/How to cite this article
Ravelli MN, Sartori MMP, Corrente JE, Rasera Júnior I,Souza NPP, Oliveira MRM. The under-reporting of energy intake influences the dietary pattern reported by obese women in the waiting list for bariatric surgery. Rev Nutr. 2018;31(2):235-49. http://dx.doi.org/10.1590/1678-98652018000200009
The under-reporting of energy intake
influences the dietary pattern reported
by obese women in the waiting list
for bariatric surgery
A subnotificação do consumo energético influencia
os resultados de padrão alimentar relatado
por mulheres obesas na fila de espera
para cirurgia bariátrica
Michele Novaes RAVELLI1 0000-0003-3809-9483
Maria Márcia Pereira SARTORI2 0000-0002-9960-8125
José Eduardo CORRENTE3 0000-0001-5478-4996
Irineu RASERA JUNIOR4 0000-0001-6300-2319
Noa Pereira Prada de SOUZA1 0000-0002-2602-6167
Maria Rita Marques de OLIVEIRA5 0000-0003-1226-4364
A B S T R A C T
Objective
Revista de Nutrição Rev. Nutr. 2018;31(2):235-249
http://dx.doi.org/10.1590/1678-98652018000200009 236 MN RAVELLI et al.
Methods
The study included 412 women aged 20 to 45 years with a body mass index ranging from 35 to 60kg/m2 who
were on waiting list for bariatric surgery. Data from three reported food intake and physical activity, body weight, and height were used for estimating the reported energy intake, physical activity level, and resting energy expenditure. Subsequently, it was checked the biological plausibility of the reported energy intakes, classifying all participants as plausible reporters or under-reporters. Exploratory factor analysis was used to determine the participants’ dietary patterns. The Mann-Whitney test assessed the reported energy and nutrient intakes between plausible reporters and under-reporters groups. The Z-test assessed the variables of plausible reporters or under-reporters in relation to all participants of the study.
Results
Six dietary patterns were determined for all participants of study. After excluding information from under-reporting women, only two dietary patterns remained similar to those of all participants, while three other dietary patterns presented different conformations from food subgroups to plausible reporters. The reported energy intake did not present difference for the subgroups of fruits, leaf vegetables and vegetables. However, the energetic value reported for the other food subgroups was higher for the plausible reporters.
Conclusion
The under-reporting of energy intake influenced the determination of dietary patterns of obese women waiting for bariatric surgery.
Keywords: Energy intake. Dietary pattern. Multivariate analysis. Obesity. Under-reporting.
R E S U M O
Objetivo
Esta pesquisa buscou verificar a interferência da subnotificação do consumo energético na determinação do padrão alimentar e consumo de nutrientes, relatados por mulheres obesas na fila de espera para cirurgia bariátrica.
Métodos
Participaram do estudo 412 mulheres com idade entre 20 e 45 anos e índice de massa corporal entre 35 e 60 kg/m2, que aguardavam na fila de espera de cirurgia bariátrica. Foram utilizadas informações de três registros do consumo alimentar, da atividade física de 24 horas e do peso corporal e altura, para estimativa da Ingestão Energética Relatada, Nível de Atividade Física e Gasto Energético de Repouso das participantes e subsequente verificação da plausibilidade biológica do consumo energético. As mulheres foram agrupadas em notificadoras plausíveis e subnotificadoras. A análise fatorial exploratória foi utilizada para classificar os padrões alimentares. Os valores relatados de energia e nutrientes entre os grupos de notificadoras plausíveis e subnotificadoras foram avaliados por meio do teste de Mann-Whitney. O Teste de hipótese Z avaliou as variáveis das notificadoras plausíveis ou subnotificadoras em relação a todas as participantes do estudo.
Resultados
Seis padrões alimentares foram determinados para todas as participantes do estudo. Após excluir as informações das mulheres subnotificadoras, apenas dois padrões alimentares mantiveram-se similares aos de todas as participantes, ao passo que outros três padrões alimentares apresentaram diferentes conformações de subgrupos alimentares para as notificadoras plausíveis. A ingestão energética relatada não apresentou diferença para os subgrupos das frutas, hortaliças e legumes. Porém, o valor energético relatado para os demais subgrupos alimentares foi maior para as notificadoras plausíveis.
Conclusão
A subnotificação do consumo energético influenciou a determinação de padrões alimentares de mulheres obesas na lista de espera para cirurgia bariátrica.
I N T R O D U C T I O N
Food intake surveys used in nutritional epidemiology studies are based on self-report methods, which may cause intra- or interpersonal errors, affecting the results [1]. Energy intake under-reporting is a great challenge for nutrition studies [1-3]. This condition can be influenced by social and cultural issues, such as the level of schooling of the participant and social norms regarding the expected consumption behaviors. Under-reporting may also be related to the characteristics of the food, depending on which may make it difficult to perceive the amount consumed and need to know the specificities of food consumption [2,3].
Under-reporters are identified by the premise that the Reported Energy Intake (EIrep) of individuals with stable weight should be equal to their Total Energy Expenditure (TEE) [4]. Although the variables of this statistically derived equation are imprecise, the minimum plausible energy intake can be calculated and expressed as multiples of the Resting Energy Expenditure (REE) [4,5]. Although, this approach does not differentiate between the under-reporting of nutrients, foods, or food groups.
The introduction of dietary pattern assessment by multivariate statistical methods was an important advance for nutritional epidemiology studies, enabling dietary assessment based on the characteristics of the foods consumed [6,7]. Factor and clusters analysis are the multivariate statistical methodologies commonly used in nutritional epidemiology for the characterization of food behavior and verification of the relationship between food and nutrient consumption with the health status of the individuals [6,7]. However, dietary pattern studies do not always check whether the reported intake is plausible, even though this factor has a great impact on the results.
Although excessive food intake is one of the main determinants of obesity and
chronic diseases, overweight individuals are the greatest energy intake under-reporters, even though less accurate food intake data do exist [8-10]. Epidemiological studies often verify the associations between eating patterns and obesity and chronic diseases [11,12] however; few evaluate these associations in morbidly obese people [13], especially in the waiting list for bariatric surgery.
Therefore, the aim of this study was to verify the interference of under-report of energy intake in the determination of the dietary patterns and nutrient intakes reported by obese women in the waiting list for bariatric surgery.
C A S E S A N D M E T H O D S
Subjects and General Information Variables
A cross-sectional study was conducted with 412 women in the waiting list for gastroplasty. The eligibility of this study population occurred by convenience once this manuscript is the result of a subproject extracted from a larger study [14], in which the number of participants was calculated. The eligibility criteria, the following were considered: women aged 20 to 45 years and Body Mass Indix (BMI), from 35 to 60kg/m2, The inclusion criteria considered the subjects who were not losing weight, and did not have any diseases or take any medications that affected energy metabolism and consequently the verification of under-reporting of energy intake, during the data collection. There were no patients who refused or gave up participating in the survey.
Revista de Nutrição Rev. Nutr. 2018;31(2):235-249
http://dx.doi.org/10.1590/1678-98652018000200009 238 MN RAVELLI et al.
Anthropometric and Energy Expenditure Variables
The measurements of Height (H) and current Weight (W) were performed by the same researcher with the same stadiometer and the same digital body weight scale. The weight was measured in a digital scale of the brand FILIZOLA®
(Recife, Pernambuco, Brazil) with a maximum
capacity of 350kg. For this measurement, the patient was instructed to stand, barefoot and with as few clothes as possible, remaining erect, feet together in the center of the platform, arms along the body, to avoid possible changes in reading the measurements [15]. The height was determined using the SECA® (German Health
Care Export Grup, Hamburg, Germany) vertical stadiometer with a 1.0mm scale. The patient was placed in the orthostatic position, head oriented in the Frankfurt plane, barefoot and, as far as possible, maintaining the heels, pelvic and scapular waists, and occipital region in contact with the device [15]. The Body Mass Index (BMI) of each patient was determined by body weight (kilos), divided by height (meters), squared.
The Resting Energy Expenditure (REE) was obtained through the predictive calculation described by Mifflin et al. [16]. According with Quesada [17], this equation presented a lower variation (3.6%) of the predictive REE value in relation to the value of the direct REE method.
REE=(9.99xW)+(6.25xH)-(4.92xA)-161
At where:
W = Weight (Kg).
H = Height (cm).
A = Age (years).
Food Intake Variables
The participants’ food intake data were collected by three 24-hour dietary record (24HR) on nonconsecutive days, including a weekend
day. To obtain the Reported Energy Intake (EIrep), the patients were trained to fill in the information appropriately in their home, considering the details of all food, beverages and dietary supplements consumed on the day, as well as the types and quantities of the preparations. On return to the clinic, after 30 days of training day, nutritionists checked the items registered with the patients, clarifying the possible doubts. The EIrep was given by a compilation of national and international nutritional composition tables of foods described in the Pesquisa de Orçamentos Familiares (POF, Family Budgets Survey) by the Instituto Brasileiro de Geografia e Estatística (IBGE, Brazilian Institute of Geography and Statistics) [18].
The tabulated foods were distributed into the five food groups as recommended by the first edition of the Guia Alimentar para
a População Brasileira (GAPB, Brazilian Food
Guide) [19]. Then the groups were divided into thirteen subgroups according to the foods’ nutritional characteristics to increase analytical specificity (Chart 1).
Physical Activity Level-Related Variables
Physical Activity Level (PAL) data were obtained on the same days as 24HR using three physical activity reported. Subjects were asked to report all activities performed during the day, including the time spent in each activity. The information on time spent sleeping, type of commuting, physical activities performed at work, development of domestic tasks, leisure activities, sports and scheduled physical exercises performed throughout the day are recorded.
is multiplied by the time of physical activity. For the activities reported that were not in the DRI table, the compendium of physical activities [21] was used to convert these activities considering the equivalence in energy expenditure.
The women were classified by the Activity Factor (AF), corresponding to PAL ranges, according to the DRI [20].
Determination of Energy Intake Under-reporting
Food intake under-reporting was determined by confronting the EIrep:REE ratio with the PAL.
EIrep
REE =PAL
At where:
EIrep = Reported energy intake
REE = Resting Energy Expenditure
PAL= Physical Activity Level
The cut-off point was defined according to equation of Goldberg et al. [4], adjusted by Black [5].
At where:
CP = Cut-off point
PAL = Physical Activity Level, according to the classification indicated by the DRI document.
Chart 1. Food subgroups and respective foods. Groups of the Brazilian Food Guide
(Ministry of Health, 2008) Food group subgroups Group 1
Grains, tubers, and roots.
Subgroup 1: Breads and grains (rice and respective preparations, maize, oat, cornmeal, popcorn, polenta, soups).
Subgroup 2: Tubers and roots (potato and respective preparations, cassava, cassava flour, arracacia xanthorrhiza).
Subgroup 3: Pasta (Pasta and sauces, pancake, lasagna). Group 2
Fruits and vegetables.
Subgroup 4: Fruits (pineapple, banana, apple, watermelon, melon, strawberry, orange, papaya, grapes, kiwi, pear, guava, etc. and respective juices).
Subgroup 5: Leaf vegetables (lettuce, watercress, chicory, arugula, kale, cabbage, etc.) Subgroup 6: Vegetables (pumpkin, zucchini, chayote, beets, carrots, okra, broccoli, cauliflower, eggplant, radish, tomato, etc).
Group 3
Beans and other high-protein plants.
Subgroup 7: Beans and other high-protein plants (pea, lentil, chickpea, soybean and derivatives, kidney beans (brown or black), bean stew, nuts).
Group 4
Meat and eggs, milk and dairy products.
Subgroup 8: Meat, seafood, and eggs (beef, poultry, pork, seafood, eggs and respective preparations).
Subgroup 9: Milk and dairy products (whole and low-fat cow milk, whole and low-fat yogurt, chocolate cow milk or coffee and cow milk containing sugar, fermented milk, and cheeses).
Group 5
Fat, sugar, and salt sources.
Subgroup 10: Fast foods (snacks, pizza, cheese roll, baked salty snacks, deep-fried salty snacks).
Subgroup 11: Sweets (sandwich cookies, cookies, chocolate mix, sugar, cake with and without icing, mousse, homemade sweets, chocolate, ice cream, fruit preserves, etc.). Subgroup 12: Processed salty foods (cold cuts, sausages, mayonnaise, catchup, mustard, potato chips and other packaged snacks, etc.)
Subgroup 13: Beverages (artificial or industrialized fruit juice, alcoholic beverages, soda, powdered drinks/coffee and teas containing sugar).
CP = PAL . exp sd
s
100
(
(
√
min
.
Revista de Nutrição Rev. Nutr. 2018;31(2):235-249
http://dx.doi.org/10.1590/1678-98652018000200009 240 MN RAVELLI et al.
The dietary patterns of each group of women (all participants of study, plausible reporters, and under-reporters) were obtained by the contribution of daily energy intake reported (kcal/day) of each food subgroup consumed by each woman. The dietary patterns were identified by exploratory factor analysis, using principal component analysis with VARIMAX rotation to extract the number of factors (number of dietary patterns in each group of women). Factors with eigenvalues greater than 1.0 and factor loadings ≥|0.400| for each food subgroup, were considered significant in the matrix interpretation and dietary pattern naming [22]. The dietary patterns found for each group (all participants of study, plausible reporters, and under-reporters) were then compared.
In the descriptive analysis, the Kolmogorov-Smirnov test revealed the variables did not have normal distribution. The Mann-Whitney test compared the anthropometric and energy expenditure information, reported energy and nutrient intake variables between the two groups of women (plausible reporters and under-reporters). The Z-test was applied to verify if the average of energy and nutrient intake reported by plausible reporters and under-reporters is different of the average reported by all participants of study. The significance level was set at 5% (p≤0.05).
R E S U L T S
Table 1 showed the estimated anthropometric and energy requirements for the women participating in the study. The 412 obese women were classified as plausible reporters (#157; 38%) and under-reporters (#255; 62%) of energy intake. After excluding data from women who under-report their energy intake, the means of variables age and BMI of the women classified as plausible reporters did not present a difference (p>0.05) when compared to the values calculated for all the participants of study. However, the mean of the TEE-DRI,
Elrep
REE
≥CP
(
)
sdmin= Standard deviation assumed as -3 for the group.
N = Number of subjects.
S = Factor of Variation by the square root of the coefficients of variation of EIrep, REE and PAL.
To determine the value of S, initially were found the coefficients of variation of the energy balance components as described in the equation below, which were inserted in equation before.
At where:
CV2
EIrep = Intra-individual coefficient of variation
from the Reported Energy Intake.
d = number of days of reported food intake.
CV2
REE= Intraindividual coefficient of variation
from Resting Energy Expenditure (8.5% was assumed, based on the recommendations of Black [5].
CV2
PAL= Intraindividual coefficient of variation from
Physical Activity Level.
The cut-off point value was compared with the EIreo: REE ratio of each woman, grouping
the subjects as energy intake plausible reporters
or under-reporters
as proposed by Quesada et al. [17].
Statistical Analysis
The statistical analyses were performed by the software Statistical Package for the Social Sciences (SPSS Inc., Chicago, Illinois, United States) version 21 for Windows (IBM Inc., Armonk, New York, United States).
The total daily intake of nutrients reported by women of study were corrected by intra- and inter-individual variation using Analysis of Variance (ANOVA).
Elrep
REE
< CP
(
)
CV2
EIrep
d
S = + (CV2REE ( + (CV2 (
T ab le 1 . G e n e ra l i n fo rm a ti o n o f f e m a le f o o d i nt a ke p la u si b le r e p o rt e rs a n d u n d e r-re p o rt e rs i n t h e w a it in g l is t f o r b a ri a tr ic s u rg e ry . General information
All Participants (n=412; 100%)
Plausible Reporters (n=157; 38%)
Under
-r
eporters (n= 255; 62%)
p * Mean ± SD Median Quartiles Mean ± SD Median Quartiles Mean ± SD Median Quartiles Age (years) 32 ± 7 32
27 – 37
32
±
6
32
28 – 38
31
±
7
31
27 – 37
0.313 BMI (kg/m 2) 46.0 ± 6.0 45.1
41.6 – 49.3
45.3
±
5.6
44.4
41.4 – 48.6
46.5
±
6.3
45.5
42.0 – 50.0
0.102
TEE – DRI (kcal)
2902
±
382
2901
2637 – 3140
2775
±
339
††
2744
2532 – 3009
2981
±
386
††
2969
2714 – 3212
<0.001 REE (Kcal) 1884 ± 191 1873
1748 – 2005
1849
±
191
†
1849
1707 – 1981
1905
±
189
1885
1772 – 2035
0.004
PAL – DRI
1.53
±
0.27
1.51
1.31 – 1.69
1.46
±
0.23
††
1.45
1.27 – 1.62
1.58
±
0.27
††
1.56
1.36 – 1.75
<0.001
Note: Subjects wer
e classified as plausible r
eporters when the
ratio
of was equal or higher than the cut-of
f point. Subjects wer
e classified as Under
-r
eporters when the ratio of was lower than the cut-of
f
point. The cut-of
f point was defined accor
ding to equation of Goldberg
et al
. [4], adjusted by Black [5].
*p
<0.05 in the comparisons
made by
the Mann-Whitney test between energy intake
plausible r
eporters and under
-r
eporters.
†Z-test of the all participants in r
elation to plausible r
eporters and under
-r eporters, wher e †= p ≤ 0.05; †† = p ≤ 0.01.
BMI: Body Mass Index; TEE–DRI: T
otal Energy Expenditur
e – Dietary Refer
ence Intakes; REE: Resting Energy Expenditur
e; P
AL – DRI: Level of Physical Activity – Dietary Refer
ence Intakes; SD: Star
dand De viation. Elre p R EE Elre p R EE
REE and PAL-DRI variables presented lower values (p<0.05) for the plausible reporters when compared to the values considering all participants.
Table 2 shows the factorial loads that determined the dietary patterns of all study participants and, after excluding information from under-reporters, describes the dietary patterns of plausible reporters. The name of the dietary patterns of all participants and for each group of women was based on the values > |0.400| of factorial loads.
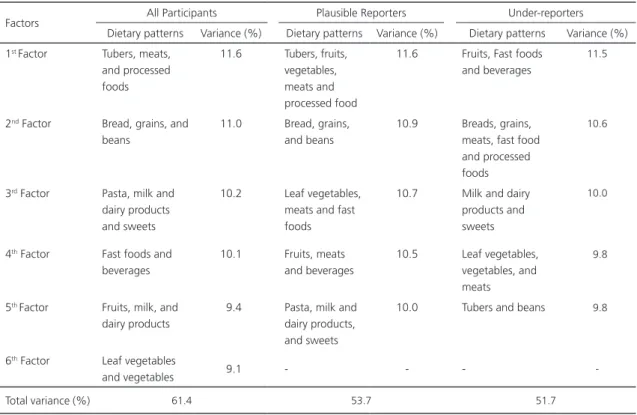
The dietary patterns determined for all women in the study were defined by six factors selected by factorial analysis. For the groups of women classified as plausible reporters and under-reporters of energy intake, five factors determined the dietary patterns of each of the groups. The dietary patterns described for all participants explained 61.4% of the variance of the reported daily energy intake, while 53.7% and 51.7% of the variance explained the consumption of plausible reporters and under-reporters, respectively (Chart 2).
All food subgroups presented a high contribution in the determination of the six dietary patterns described for all the women in the study (Chart 2). Only the subgroup of milk and dairy products was evidenced in two factors, describing two distinct dietary patterns: one composed of pasta, milk and dairy products and sweets (3rd factor), and the other by fruit and dairy products (5th factor). The first factor evidenced a dietary pattern composed of tubers and roots, meat products and processed foods, while food subgroups composed of breads and grains and beans were highlighted in the 2nd factor for all participants. The fourth factor described a dietary pattern composed of the food subgroups of fast foods and beverages in general, while the last factor (6) described a dietary pattern based on vegetables and leafy vegetables (Table 2).
Revista de Nutrição
Rev
. Nutr
. 2018;31(2):235-249
http://dx.doi.org/10.1590/1678-98652018000200009
242
MN RA
VELLI
et al.
Table 2. Factor matrix of the scores that determined the general dietary patterns of the women in the waiting list for bariatric surgery and of the energy intake plausible reporters and under-reporters.
Elrep REE
Food Groups (Kcal/day)
All Subjects (n=412; 100%) Plausible Reporters (n=157; 38%) Under-reporters (n= 255; 62%)
Factor loadings (>|0.400|) Factor loadings (>|0.400|) Factor loadings (>|0.400|)
1º Factor
2º Factor
3º Factor
4º Factor
5º Factor
6º Factor
1º Factor
2º Factor
3º Factor
4º Factor
5º Factor
1º Factor
2º Factor
3º Factor
4º Factor
5º Factor
Bread and grains 0.283 0.727 -0.008 -0.109 -0.079 -0.02 0.054 0.693 0.285 -0.004 -0.154 0.042 0.601 0.114 -0.249 -0.338
Tubers and roots 0.625 -0.042 -0.217 0.163 0.123 -0.04 0.668 0.075 -0.078 0.1 -0.083 0.07 0.118 -0.142 -0.221 0.646
Pasta -0.107 -0.189 0.753 -0.005 -0.155 0.049 -0.282 -0.272 0.117 0.292 0.541 -0.019 -0.39 0.275 -0.081 -0.125
Fruits 0.019 -0.071 -0.045 0.018 0.79 0.133 0.418 -0.162 -0.09 -0.585 0.15 -0.584 -0.204 0.087 0.162 0.068
Leaf vegetables -0.17 0.044 0.048 -0.077 -0.074 0.777 0.034 0.125 0.526 0.056 -0.137 -0.074 -0.206 -0.094 0.595 -0.105
Vegetables 0.21 -0.033 -0.106 0.018 0.313 0.633 0.621 0.15 -0.053 -0.089 -0.102 -0.215 0.063 0.102 0.651 0.11
Beans and high-protein
plants -0.096 0.841 -0.021 0.123 0.038 0.054 0.078 0.861 -0.059 0.017 0.151 0.047 0.115 -0.165 -0.183 -0.733
Meats, seafood, and
eggs 0.6 0.201 0.175 0.028 -0.281 0.33 0.427 0.038 0.436 0.536 0.018 0.362 0.444 -0.097 0.521 -0.111
Milk and dairy
products 0.109 0.265 0.499 -0.181 0.513 -0.165 0.061 0.17 0.176 -0.392 0.695 -0.168 0.127 0.792 -0.095 0.098
Fast foods -0.086 -0.039 -0.03 0.858 0.073 -0.031 0.093 -0.023 -0.723 0.173 -0.113 0.474 -0.512 -0.029 -0.127 0.156
Sweets 0.173 0.157 0.595 0.362 0.161 -0.047 -0.033 0.014 -0.344 0.141 0.616 0.329 -0.11 0.683 0.109 -0.046
Processed salty foods 0.663 0.085 0.112 -0.059 0.068 -0.079 0.446 -0.099 0.291 0.05 0.094 0.065 0.504 0.094 -0.119 0.333
Beverages 0.315 0.08 0.228 0.593 -0.252 -0.042 0.137 -0.069 -0.216 0.654 0.119 0.772 -0.08 0.159 -0.035 0.069
Eigenvalues 1.5 1.4 1.3 1.3 1.2 1.2 1.5 1.4 1.4 1.4 1.3 1.5 1.4 1.3 1.3 1.3
Note: Subjects were classified as plausible reporters when the ratio of was equal or higher than the cut-off point. Subjects were classified as Under-reporters when the ratio of was lower than the cut-off point. The cut-off point was defined according to equation of Goldberg et al. [4], adjusted by Black [5].
Kaiser-Meyer-Olkin of the pattern of all subjects: 0.602. Kaiser-Meyer-Olkin of the pattern of the plausible reporters: 0.513. Kaiser-Meyer-Olkin of the pattern of the under-reporters: 0.486.
Elrep
women, it was found that the dietary subgroup of meat, seafood and eggs contributed to the determination of three different dietary patterns of plausible reporters. The First factor described a more heterogeneous dietary pattern, composed of tubers and roots, fruits, vegetables, meats, seafood and eggs and processed salted foods. In the 3rd factor, besides the contribution in this component of the subgroup of the meat, the leaf vegetables and fast foods also participated in the determination of this dietary pattern. The food subgroups of meat, beverages and fruits also contributed to the description of the 4th factor of plausible reporters. The fifth factor of plausible reporters described a dietary pattern based on simple carbohydrate food sources, composed of the subgroups of the pasta and sweets, and the food subgroup of milks and derivatives (Table 2).
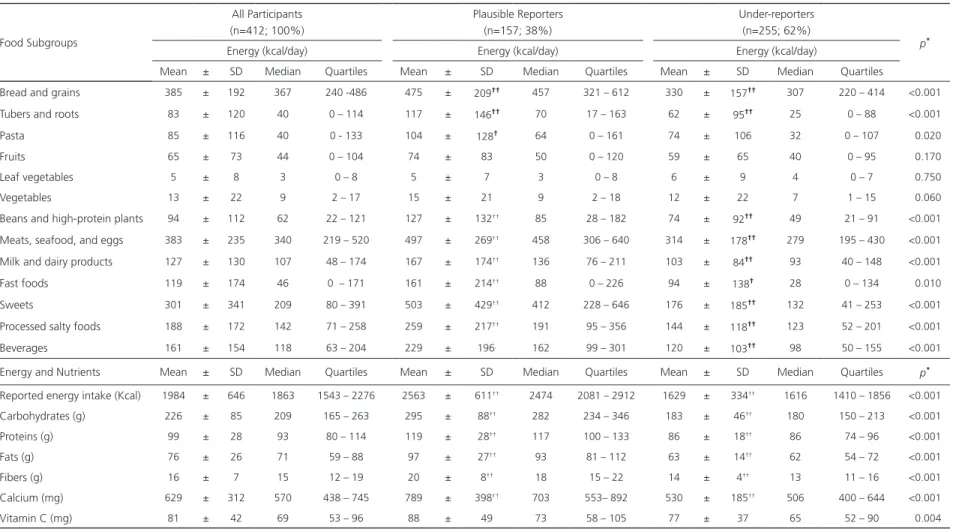
Table 3 shows the difference in energy intake reported for each of the food subgroups and in the daily energy, macro and micronutrient values between the data of all the women in the study, plausible reporters and under-reporters.
The energy intake reported for the food subgroups of fruits, leaf vegetables and vegetables did not present difference (p>0.05) for all participants in relation to the plausible reporters. In these food subgroups, the energy values reported by the plausible reporters and under-reporters were also similar. However, for the other food subgroups, after the exclusion of the energy intake information reported by the under-reporters, it was found that the plausible reporters presented a higher energy intake in comparison to the values presented by all the participants.
By excluding the values of daily energy intake reported by under-reporters, it was found
Chart 2. Dietary patterns of all participants, of plausible reporters, and of under-reporters of energy intake.
Factors All Participants Plausible Reporters Under-reporters Dietary patterns Variance (%) Dietary patterns Variance (%) Dietary patterns Variance (%) 1st Factor Tubers, meats,
and processed foods
11.6 Tubers, fruits, vegetables, meats and processed food
11.6 Fruits, Fast foods and beverages
11.5
2nd Factor Bread, grains, and beans
11.0 Bread, grains, and beans
10.9 Breads, grains, meats, fast food and processed foods
10.6
3rd Factor Pasta, milk and dairy products and sweets
10.2 Leaf vegetables, meats and fast foods
10.7 Milk and dairy products and sweets
10.0
4th Factor Fast foods and beverages
10.1 Fruits, meats and beverages
10.5 Leaf vegetables, vegetables, and meats
9.8
5th Factor Fruits, milk, and dairy products
9.4 Pasta, milk and dairy products, and sweets
10.0 Tubers and beans 9.8
6th Factor Leaf vegetables
and vegetables 9.1 - - -
-Total variance (%) 61.4 53.7 51.7
Elrep REE
Note: Subjects were classified as plausible reporters when the ratio of was equal or higher than the cut-off point. Subjects were classified as Under-reporters when the ratio of was lower than the cut-off point. The cut-off point was defined according to equation of Goldberg et al. [4], adjusted by Black [5].
Revista de Nutrição
Rev
. Nutr
. 2018;31(2):235-249
http://dx.doi.org/10.1590/1678-98652018000200009
244
MN RA
VELLI
et al.
Table 3. Mean, standard deviation, median, and quartile daily energy intake from the food subgroups, and the energy and nutrient intakes of women in the waiting list for bariatric surgery.
Food Subgroups
All Participants (n=412; 100%)
Plausible Reporters (n=157; 38%)
Under-reporters (n=255; 62%)
p*
Energy (kcal/day) Energy (kcal/day) Energy (kcal/day)
Mean ± SD Median Quartiles Mean ± SD Median Quartiles Mean ± SD Median Quartiles
Bread and grains 385 ± 192 367 240 -486 475 ± 209†† 457 321 – 612 330 ± 157†† 307 220 – 414 <0.001
Tubers and roots 83 ± 120 40 0 – 114 117 ± 146†† 70 17 – 163 62 ± 95†† 25 0 – 88 <0.001
Pasta 85 ± 116 40 0 - 133 104 ± 128† 64 0 – 161 74 ± 106 32 0 – 107 0.020
Fruits 65 ± 73 44 0 – 104 74 ± 83 50 0 – 120 59 ± 65 40 0 – 95 0.170
Leaf vegetables 5 ± 8 3 0 – 8 5 ± 7 3 0 – 8 6 ± 9 4 0 – 7 0.750
Vegetables 13 ± 22 9 2 – 17 15 ± 21 9 2 – 18 12 ± 22 7 1 – 15 0.060
Beans and high-protein plants 94 ± 112 62 22 – 121 127 ± 132†† 85 28 – 182 74 ± 92†† 49 21 – 91 <0.001
Meats, seafood, and eggs 383 ± 235 340 219 – 520 497 ± 269†† 458 306 – 640 314 ± 178†† 279 195 – 430 <0.001
Milk and dairy products 127 ± 130 107 48 – 174 167 ± 174†† 136 76 – 211 103 ± 84†† 93 40 – 148 <0.001
Fast foods 119 ± 174 46 0 – 171 161 ± 214†† 88 0 – 226 94 ± 138† 28 0 – 134 0.010
Sweets 301 ± 341 209 80 – 391 503 ± 429†† 412 228 – 646 176 ± 185†† 132 41 – 253 <0.001
Processed salty foods 188 ± 172 142 71 – 258 259 ± 217†† 191 95 – 356 144 ± 118†† 123 52 – 201 <0.001
Beverages 161 ± 154 118 63 – 204 229 ± 196, 162 99 – 301 120 ± 103†† 98 50 – 155 <0.001
Energy and Nutrients Mean ± SD Median Quartiles Mean ± SD Median Quartiles Mean ± SD Median Quartiles p*
Reported energy intake (Kcal) 1984 ± 646 1863 1543 – 2276 2563 ± 611†† 2474 2081 – 2912 1629 ± 334†† 1616 1410 – 1856 <0.001
Carbohydrates (g) 226 ± 85 209 165 – 263 295 ± 88†† 282 234 – 346 183 ± 46†† 180 150 – 213 <0.001
Proteins (g) 99 ± 28 93 80 – 114 119 ± 28†† 117 100 – 133 86 ± 18†† 86 74 – 96 <0.001
Fats (g) 76 ± 26 71 59 – 88 97 ± 27†† 93 81 – 112 63 ± 14†† 62 54 – 72 <0.001
Fibers (g) 16 ± 7 15 12 – 19 20 ± 8†† 18 15 – 22 14 ± 4†† 13 11 – 16 <0.001
Calcium (mg) 629 ± 312 570 438 – 745 789 ± 398†† 703 553– 892 530 ± 185†† 506 400 – 644 <0.001
Vitamin C (mg) 81 ± 42 69 53 – 96 88 ± 49 73 58 – 105 77 ± 37 65 52 – 90 0.004
Note: Subjects were classified as plausible reporters when the ratio of was equal or higher than the cut-off point. Subjects were classified as Under-reporters when the ratio of was lower than the cut-off point. The cut-off point was defined according to equation of Goldberg et al. [4], adjusted by Black [5].
*p<0.05 according to the Mann-Whitney test between reported energy intake for plausible reporters and under-reporters; †Z-test of all participants in relation to the plausible reporters and under-reporters, where
†=p≤0.05; ††=p≤0.01.
Elrep REE
that plausible reporters had a higher energy intake reported (p<0.05) than the data of all the participants. The same was verified for the reported intake of carbohydrates, proteins, fats, fibers and calcium. Only the mean value reported for vitamin C intake did not present difference (p>0.05) when compared to data from all participants.
D I S C U S S I O N
The study confirms that under-reporting of energy intake may influence the determination of dietary patterns of obese women in the waiting list for bariatric surgery. After the exclusion of information from women classified as under-reporting, a different combination of food groups was highlighted, determining new dietary patterns described for the group of women classified as plausible reporters.
Most women (#255; 62%) was classified as under-reporters of energy intake, this can be a critical factor in the differentiation of dietary patterns, by excluding this information in the factor analysis. The high proportion of under-reporting is notable, but it was already expected since overweight is one of the main characteristics of individuals who do not report energy intake correctly [8,9,23]. The use of predictive equations is one of the least accurate methods to estimate energy expenditure when compared to indirect calorimetry and doubly-labeled water [24,25]. However, a study of 100 women from this same population [17] found a similar prevalence of under-reporting of energy intake using indirect calorimetry (78%) and predictive equations (84%) thus the possibility of energy hypometabolism as the answer for the high proportion of women who under-reporting the energy intake is discarded.
The inconsistencies in the data of the Brazilian Food Consumption Table [18], regarding the non-differentiation of the energy contribution in certain types of preparations (raw or cooked, fried or roasted), could explain
a possible change in the cut-off point for the classification of women’s groups, leading to a greater number of under-reporting women. However, studies [17,26] identified a wide variation in the cut-off point for classification of plausible reporters and under-reporters, reaching proportions very similar to those found in this study. In addition, the high proportion of under-reporting women in this study may reflect the condition of these participants in the waiting list for bariatric surgery. Considering that obese individuals tend not only to under-reporting the energy intake, but also to over-reporting the daily energy expenditure [27,28], the probable over-reporting of the physical activity level evidenced in this study may have been another factor contributing to the imbalance of the women’s energy balance equation of the research. However, the limitations on physical activity assessment questionnaires are cannot be ignored [29].
Studies with factor analysis and clusters analysis have shown that the presence of errors in food intake reports may induce changes in the dietary patterns or in the food quantities described in the patterns, regardless of the percentage of individuals classified as under-reporting of energy intake [30,31].
Revista de Nutrição Rev. Nutr. 2018;31(2):235-249
http://dx.doi.org/10.1590/1678-98652018000200009 246 MN RAVELLI et al.
The pastas are not consumed regularly in main meals, while the report of the consumption of sweets could cause some embarrassment in the face of a supposed judgment of the professional evaluator. The other factors had different food subgroups that translated into new and more varied dietary patterns. The fact that plausible reporters describe more food items may represent a more varied and expected consumption for the western dietary pattern, while a smaller number of items in the under-reporters patterns may reflect forgetfulness or even less consumption.
While the exclusion of information of a high percentage of under-reporting patients contributed to a new conformation of dietary patterns, the exclusion of a low percentage of under-reporting patients (16.3%) did not induce variations in the definition of dietary patterns, but in different contributions from certain food subgroups described in plausible reporters patterns [32]. The influence of under-reporting of energy intake on dietary patterns determined by the clusters method were more prevalent in groups described as healthy [33,34] and the exclusion of these individuals did not alter the contribution of the food group in the description of the cluster. However, by excluding under-reporters, the patterns described as mixed and western showed a high consumption of unhealthy food groups such as sausages, white bread, pastry, soft drinks and fast foods by plausible reporting participants [34].
In terms of energy presented in the food subgroups, the highest mean values reported for most food subgroups of plausible reporters, except for the subgroups of fruits, leaf vegetables and vegetables, reflect the predilection for the omission of foods with high energy density and over-reporting of healthy foods by under-reporting women, corroborating with other studies [23;35]. When considering macro and micronutrients, plausible reporters describe a higher consumption for carbohydrates, proteins, fats and fibers, but do not differ in the
consumption of vitamin C, in relation to the data of all participants. By targeting the nutrients consumption to the dietary patterns determined for the plausible reporters, these nutrients can translate the derived food subgroups into the mixed pattern, evidenced in the 1st factor of this group of women.
Numerous studies are designed to verify the association between dietary patterns and health outcomes, especially obesity and cardiovascular diseases [11,36,37]. A question raised by the results of this study is pertinent to exclude data from under-reporters of energy intake from epidemiological studies that evaluate the dietary patterns of populations, aiming at reducing the bias of the results. Researchers investigating under-reporting in their studies emphasize that this variable may modify research results [2,38], and systematic errors caused by under-reporting of energy intake may affect the association between dietary patterns and diseases [32] , especially when evaluated in groups of overweight individuals, a common condition among under-reporters [8-10,23].
The women’s situation at the time may have encouraged under-reporting, since failure to lose weight through clinical treatments is a justification for bariatric surgery, to which these women were candidates [17]. But one must also consider the societal trend of blaming the obese for their inability to lose weight, and in this case, under-reporting may have stemmed from the shame associated with reporting their real food habits [39]. This hypothesis is supported by plausible reporters’ and under-reporters’ significantly different energy intakes from different food subgroups, except for fruits, leaf vegetables, and vegetables (Table 3), since they are recognized as healthy foods [23].
C O N C L U S I O N
the determination of dietary patterns and consequently modifying the order of the food groups that determine the factors and describe the patterns of consumption of plausible reporting women. Researchers should be aware of the conditions associated with the under-reporting of energy intake in order to consider them in the statistical analysis of their studies, especially when the objective is to verify the relationship between dietary patterns and health status of the population.
C O N T R I B U T I O N S
MN RAVELLI was responsible for the data tabulation, analysis and, interpretation; manuscript writing. MMP SARTORI was responsible for the data analysis and interpretation; manuscript reviewing. JE CORRENTE was responsible for the data analysis and interpretation; manuscript reviewing. I RASERA JUNIOR was responsible for the data interpretation; manuscript reviewing. NPP SOUZA was responsible for the study structuring and data collection. MRM OLIVEIRA was responsible for the study design; data interpretation; manuscript reviewing and approval of its final version.
A C K N O W L E D G M E N T S
We thank the Clínica Bariátrica de Piracicaba,
São Paulo, Brazil, the Conselho Nacional de
Desen-volvimento Científico e Tecnológico (CNPq, process:
130877/2011-5) and the Fundação de Amparo à
Pesquisa do Estado de São Paulo (FAPESP, process:
2012/03942-6). The authors state that there are no conflicts of interest in this study.
R E F E R E N C E S
1. Shim JE, Oh K, Kim HC. Dietary assessment methods in epidemiologic studies. Epidemiol Health. 2014;36:e2014009. http://dx.doi.org/10. 4178/epih/e2014009
2. Mendez MA. Invited Commentary: Dietary misreporting as a potential source of bias in diet-disease associations: Future directions in Nutritional Epidemiology Research. Am J Epidemiol.
2015;181(4):234. http://dx.doi.org/10.1093/aje/ kwu306
3. Trijsburg L, Geelen A, Hollman PC, Hulshof PJ, Feskens EJ, Van’t Veer P, et al. BMI was found to be a consistent determinant related to misreporting of energy, protein and potassium intake using self-report and duplicate portion methods. Public Health Nutr. 2016;20(4)1-10. http://dx.doi.org/10. 1017/S1368980016002743
4. Goldberg GR, Black AE, Jebb SA, Cole TJ, Murgatroyd PR, Coward WA, et al. Critical evaluation of energy intake data using fundamental principles of energy physiology: 1. Derivation of cut-off limits to identify under-recording. Eur J Clin Nutr. 1991;45(12):569-81.
5. Black AE. Critical evaluation of energy intake using the Goldberg cut-off for energy intake: Basal metabolic rate: A practical guide to its calculation, use and limitations. Int J Obes. 2000;24(9):1119-30. 6. Cespedes EM, Hu FB. Dietary patterns: From
nutritional epidemiologic analysis to national guidelines. Am J Clin Nutr. 2015;101(5):899-900. 7. Moller SM, Reedy J, Millen AE, Dixon B, Newby PK, Tucker KL, et al. Dietary patterns: Challenges and opportunities in dietary patterns research. J Am Diet Assoc. 2007;107(7):1233-9.
8. Sichieri R. Dietary patterns and their associations with obesity in the Brazilian city of Rio de Janeiro. Obes Res. 2002;10(1):42-8.
9. Ma Y, Bertone ER, Stanek III EJ, Reed GW, Hebert JR, Cohen NL, et al. Association between eating patterns and obesity in free-living US Adult Population. Am J Epidemiol. 2003;158(1):58-92. 10. Meyer J, Doring A, Herder C, Roden M, Koenin
W, Thorand B. Dietary patterns, subclinical inflammation, incident coronary heart disease and mortality in middle-aged men from the MONICA/ KORA Augsburg cohort study. Eur J Clin Nutr. 2011;65(7):800-7. http://dx.doi.org/10.1038/ejcn. 2011.37
10. Jessri M, Wolfinger RD, Lou WY, L’Abbe MR. Identification of dietary patterns associated with obesity in a nationally representative survey of Canadian adults: Application of a priori, hybrid, and simplified dietary pattern techniques. Am J Clin Nutr. 2017;105(3):669-84.
11. Jannasch F, Kroger J, Schulze MB. Dietary patterns and Type 2 Diabetes: A systematic literature review and meta-analysis of prospective studies. J Nutr. 2017;147(6):1174-82.
Revista de Nutrição Rev. Nutr. 2018;31(2):235-249
http://dx.doi.org/10.1590/1678-98652018000200009 248 MN RAVELLI et al.
2015;23(5):1063-70. http://dx.doi.org/10.1002/oby. 20920
14. Schnor NPP, Verlengia R, Novais PFS, Crisp AH, Leite CVS, Rasera-Junior I, et al. Association of 5-HT2C (rs3813929) and UCP3 (rs1800849) gene polymorphisms with type 2 diabetes in obese women candidates for bariatric surgery. Arch Endocrinol Metab. 2017;61(4):326-31.
15. Gibson RS. Nutritional assessment: A laboratory manual. New York: Oxford University Press; 1993.
16. Mifflin MD, Jeor ST, Hill LA, Scott BJ, Daugherty SA, Koh YO. A new predictive equation for resting energy expenditure in healthy individuals. Am J Clin Nutr. 1990;51(2):241-7.
17. Quesada KR, Novais PFS, Detregiachi CRP, Barbalho SM, Rasera Jr I, Oliveira MRM. Comparative analysis of approaches for assessing energy intake underreporting by female bariatric surgery candidates. J Am Coll Nutr. 2014;33(2):155-62. 18. Instituto Brasileiro de Geografia e Estatística.
Pes-quisa de orçamentos familiares, 2008-2009 (POF): tabelas de composição nutricional dos alimentos consumidos no Brasil. Rio de Janeiro: IBGE; 2011. 19. Ministério da Saúde (Brasil). Secretaria de Atenção
à Saúde. Guia alimentar para a população bra-sileira: promovendo a alimentação saudável. Bra-sília: Ministério da Saúde; 2008. (Série A. Normas e Manuais Técnicos).
20. Institute of Medicine. Food and Nutrition Board. Dietary Reference Intakes (DRIs): Dietary Reference Intakes for energy, carbohydrates, fiber, fat, protein and amino acids (macronutrients). Washington (DC): National Academy Press; 2005. 21. Ainsworth BE, Haskell WL, Whitt MC, Irwin ML,
Swartz AM, Strath SJ, et al. Compendium of physical activities: An update of activity codes and MET intensities. Med Sci Sport Exer. 2000;32(Supl 9):498-516.
22. Hair JF, Anderson RE, Tatham RL, Black WC. Aná-lise multivariada de dados. 6a ed. Porto Alegre: Artmed; 2009.
23. Vanrullen IB, Volatier JL, Bertaut A, Dufour A, Dallongeville J. Characteristics of energy intake under-reporting in French adults. Br J Nutr. 2014;111:1292-302. http://dx.doi.org/10.1017/S0 007114513003759
24. Schoeller DA. Recent advances from application of doubly labeled water to measurement of human energy expenditure. J Nutr. 1999;129(10):1765-8. 25. Trabulsi J, Schoeller DA. Evaluation of dietary
assessment instruments against doubly labeled
water, a biomarker of habitual energy intake. Am J Physiol Endocrinol Metab. 2001;281(5):E891-9. 26. Rhee JJ, Sampson L, Cho E, Hughes MD, Hu
FB, Willett WC. Comparison of methods to account for implausible reporting of energy intake in epidemiologic Studies. Am J Epidemiol. 2015;181(4):225-33.
27. Warner ET, Wolin KY, Duncan DT, Heil DP, Askew S, Bennett GG. Differential accuracy of physical activity self-report by body mass index. Am J Health Behav. 2012;36(2):168-78.
28. Pietilainen KH, Korkeila M, Bogl LH, Westerterp KR, Yki-Jarvinen H, Kaprio J, et al. Inaccuracies in food and physical activity diaries of obese subjects: Complementary evidence from doubly labeled water and co-twin assessments. Int J Obes. 2010;34(3):437-45.
29. Shephard RJ. Limits to the measurement of habitual physical activity by questionnaires. Br J Sports Med. 2003;37:197-206.
30. Bailey RL, Mitchell DC, Miller C, Smiciklas-Wright H. Assessing the effect of underreporting energy intake on dietary patterns and weight status. J Am Diet Assoc. 2007;107(1):64-71.
31. Shrestha A, Koju RP, Beresford SAA, Chan KCC, Karmacharya BM, Fitzpatrick AL. Food patterns measured by principal component analysis and obesity in the Nepalese adult. Heart Asia. 2016;8(1):46-53.
32. Markussen MS, Veierod MB, Ursin G, Andersen LF. The effect of under-reporting of energy intake on dietary patterns and on the associations between dietary patterns and self-reported chronic disease in women aged 50-69 years. Br J Nutr. 2016;116(5):547-58.
33. Scagliusi B, Ferriolli E, Pfrimer K, Laureano C, Cunha CS, Gualano B, et al. Under-reporting of energy intake is more prevalente in a health dietary pattern cluster. Br J Nutr. 2008;100(5):1060-8. 34. Funtikova AN, Gomez SF, Fito M, Elosua R,
Benitez-Arciniega AA, Schroder H. Effect of energy under-reporting on secular trends of dietary patterns in a mediterranean population. PLoS One. 2015;10(5):e0127647. http://dx.doi. org/10.1371/journal.pone.0127647
35. Mendez MA, Wynter S, Wilks R, Forrester T. Under- and over-reporting of energy is related to obesity, lifestyle factors and food group intakes in Jamaican adults. Public Health Nutr. 2004;7(01):9-19. http://dx.doi.org/10.1079/PHN2003508
and weight change: 15-year longitudinal studyinl Australian adults. Eur J Nutr. 2017;56(4):1455-65. http://dx.doi.org/10.1007/s00394-016-1191-3 37. Livingstone KM, McNaughton SA. Dietary patterns
by reduced rank regression are associated with obesity and hypertension in Autralian adults. Br J Nutr. 2017;117(2):248-59.
38. Rhee JJ, Sampson L, Cho E, Hughes MD, HU FB, Willet WC. Comparison of methods to account for implausible reporting of energy
intake in epidemiologic studies. Am J Epidemiol. 2015;181(4):225-33. http://dx.doi.org/10.1093/aje/ kwu308
39. Evans B, Colls R. Measuring fatness, governing bodies: The spatialities of the Body Mass Index (BMI) in anti-obesity politics. Antipode. 2009;41(5):1051-83.