Enterprise and Work Innovation Studies, No. 1, 2005 65
Training needs in TQM: the Portuguese perspective
Rogério Puga Leal ([email protected]), Faculty of Science and Technology, Universidade Nova
de Lisboa, Portugal
Paula Oliveira, Faculty of Science and Technology, Universidade Nova de Lisboa, Portugal
José Mendonça Dias ([email protected]), Faculty of Science and Technology, Universidade
Nova de Lisboa, Portugal
Zulema Lopes Pereira ([email protected]), Faculty of Science and Technology, Universidade
Nova de Lisboa, Portugal
Abstract
A survey to assess training needs in TQM was developed in several European countries, within the framework of a Leonardo’s project named IMVOCED. Beyond a comparison of the results in each country, a global analysis was performed to design a TQM programme to be delivered by WBL (Work Based Learning). Differences were found between countries, and the Portuguese results also revealed that different approaches to TQM training should be adopted according to the organisation’s dimension. Based on this evidence, two different strategies for TQM training by WBL are proposed and discussed.
Introduction
It is difficult to give one definition of what TQM really is and what is not (Bergquist et al., 2005). However, several definitions of TQM have emerged, and most of them are quite similar and include the same essential features. Tan (1997), for instance, defines TQM as a team approach strategy that integrates and encompasses the goals of the organisation with its human, capital and financial resources. Despite all the emerged definitions, some common key factors are always present:
xContinuous improvement
xTotal participation and commitment xStrategic focus and a shared vision xCustomer orientation
xProcess management xTeamwork
Among other important features for successful implementation of TQM, the need for training at all levels within an organization has always been emphasized by the most famous quality gurus and professionals all over the world (e.g. Walley and Kowalsky, 1992; Motwani, Frahm and Kathawala, 1994).
Thiagarajan and Zairi (1997), quoting Dumas (1989), affirm that introducing TQM when people do not have the fundamental skills to work in the new system is a prescription for disaster. Therefore, for the success of TQM implementation, the authors argue the entire workforce must acquire new knowledge, skills and abilities.
The IMVOCED approach to assess training needs
IMVOCED (Improving Vocational Education) was a three-year research project that is under development, aimed at developing a TQM training programme to be delivered by WBL (Work Based Learning) techniques. Several partners of five countries, namely the UK, Portugal, Finland, Slovakia and Belgium, were involved in the project.
One of the major tasks within the project was to provide further research into training needs in TQM in selected EU markets.
It is commonly agreed that TQM comprehends the so-called “soft” and “hard” elements of quality. In the first category one can consider features such as leadership, commitment, communication and teamwork. The second typically includes the different quality techniques, systems and standards. Therefore, any research carried out to assess the training needs should take into account both the “soft” and “hard” aspects.
The questionnaire was the tool chosen to assess the IMVOCED training issues. An iterative procedure was used to develop the questionnaire. A first draft was produced and sent to all partners asking for their feedback and suggestions for improvement.
After a few rounds, a consensus about the final structure was achieved among the partners.
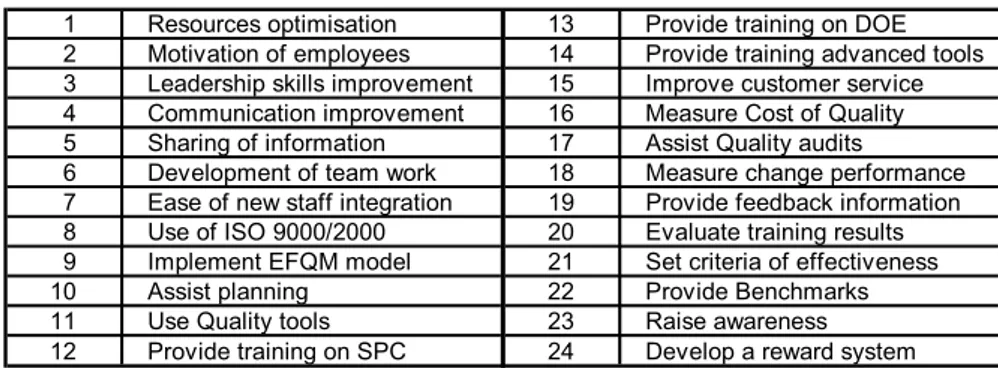
The questionnaire had a concise statement (“My company would like a WBL based TQM training programme that would…”) followed by the expected deliveries (Table 1) from the training programme.
Table 1. Expected Benefits from WBL Training Programme
1 Resources optimisation 13 Provide training on DOE 2 Motivation of employees 14 Provide training advanced tools 3 Leadership skills improvement 15 Improve customer service 4 Communication improvement 16 Measure Cost of Quality 5 Sharing of information 17 Assist Quality audits
6 Development of team work 18 Measure change performance 7 Ease of new staff integration 19 Provide feedback information 8 Use of ISO 9000/2000 20 Evaluate training results 9 Implement EFQM model 21 Set criteria of effectiveness 10 Assist planning 22 Provide Benchmarks 11 Use Quality tools 23 Raise awareness 12 Provide training on SPC 24 Develop a reward system
The respondents were asked to express how important each topic would be for a TQM training programme within their enterprises. The scale of importance ranged from one to five. A native language version of the questionnaire was then sent to a sample of companies in each of the participating countries. Table 2 presents a summary with the number of questionnaires sent and received by each country.
Table 2. Rate of Response per country
Country Sent
Questionnaires
Received Questionnaires
Rate of Response (%)
Belgium 85 30 35
Finland 500 54 11
Portugal 200 77 39
Slovakia 62 35 56
United Kingdom 580 28 5
Portuguese results in the global context
Enterprise and Work Innovation Studies, No. 1, 2005 67
was quite interesting and most of the respondents expressed their willingness to receive further information.
For the purpose of the study a dimension-based segmentation was adopted. The respondents were divided into small (less than 50 employees), medium (between 50 and 250 employees) and large (more than 250 employees) companies. Eventually, a fourth segment composed by the micro companies (until 5 employees) could be considered. However, only one micro company answered the questionnaire and this single case is incorporated in the category of small companies.
As regards the Portuguese sample, the proportion of small, medium and large companies are, respectively, 11,7%, 50,7% and 37,6%. Figure 1 shows the distribution of Portuguese scores without segmentation for the several topics included in the questionnaire. The mean lies between 3.69 and 4.52, where the lowest value corresponds to question number 13 (DOE), followed by questions 12 (SPC), 14 (advanced quality tools) and 18 (measure change performance). The highest mean values correspond to questions number 1 (resources optimisation), 2 (Motivation), 4 (communication), 5 (information sharing), 6 (team work), 15 (customer service), 16 (cost of quality), 20 (training results), 21 (criteria of effectiveness) and 23 (raise employee’s awareness).
MEAN and STDEV - Portugal
3,00 3,50 4,00 4,50 5,00
1 2 3 4 5 6 7 8 9 10 11 12 13 14 15 16 17 18 19 20 21 22 23 24
M
EAN
0,00 0,10 0,20 0,30 0,40 0,50 0,60 0,70 0,80 0,90 1,00 1,10 1,20 1,30 1,40 1,50 1,60
St
Dev
MEAN STDEV
Figure 1. Distribution of Portuguese Scores
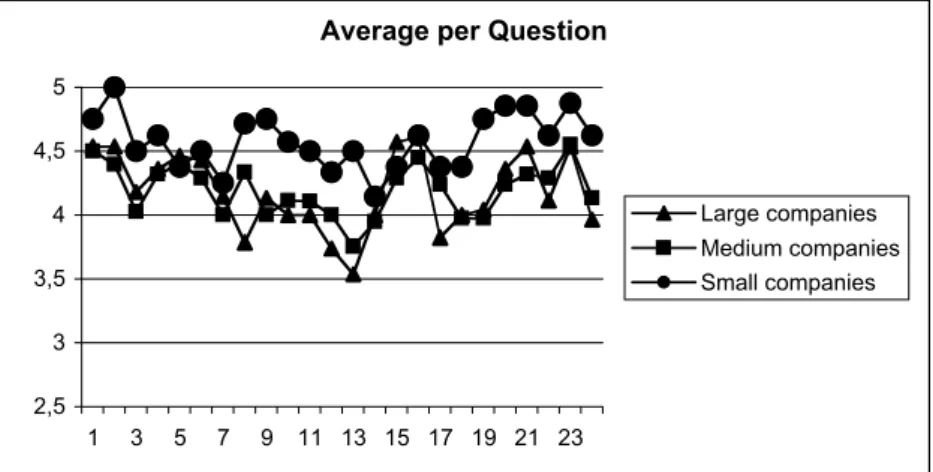
Figure 2 shows the distribution of the average scores per question when segmentation is considered.
Average per Question
2,5 3 3,5 4 4,5 5
1 3 5 7 9 11 13 15 17 19 21 23
Large companies Medium companies Small companies
Somehow, it is clear a common pattern of responses for the three segments. However, it is also evident that small companies generally score higher the several questions. This result is somehow unexpected. In fact, there is a general conviction that small companies are not as aware for quality issues as large companies. Our results do not support this conviction, although a larger sample would be important to reinforce the conclusions. Furthermore, it has to be noted that small companies answering the questionnaire are not fully representative of the Portuguese universe. The global analysis for all countries was carried out on a balanced sample, which included 28 questionnaires per country. This analysis revealed a consensus among the five countries for the following questions:
1. Help the companies optimise resources 2. Motivate employees
3. Leadership
4. Internal communication
5. Raise awareness of the individual employees role in improving competitiveness
The final sample had a dimension of 140 responses, which allowed the use of Factor Analysis.
Factor Analysis
Factor Analysis is included among the so-called interdependency techniques (Hair et al, . In these kind of techniques there is not a distinction between dependent and independent variables, being all the variables analysed together.
Factor Analysis can be used to reach several objectives. Two of the most common, that can be combined, are those connected with the identification of some underlying structure to the data and the data reduction itself.
First of all, it was important to decide whether Factor Analysis was an appropriate technique to analyse the available data or not. The KMO (Kaiser-Meyer-Olkin) measure of sampling adequacy was computed and a test of sphericity was carried out (Table 3).
Table 3. KMO and Bartlett’s test results
KMO and Bartlett's Test
,834
1194,057 276 ,000 Kaiser-Meyer-Olkin Measure of Sampling Adequacy.
Approx. Chi-Square df
Sig. Bartlett's Test of Sphericity
As can be seen, it is rejected the hypothesis that the correlation matrix could be an identity matrix. Moreover, the KMO measure reaches the value of 0,834, far above 0,500, which is the acceptable minimum.
Enterprise and Work Innovation Studies, No. 1, 2005 69
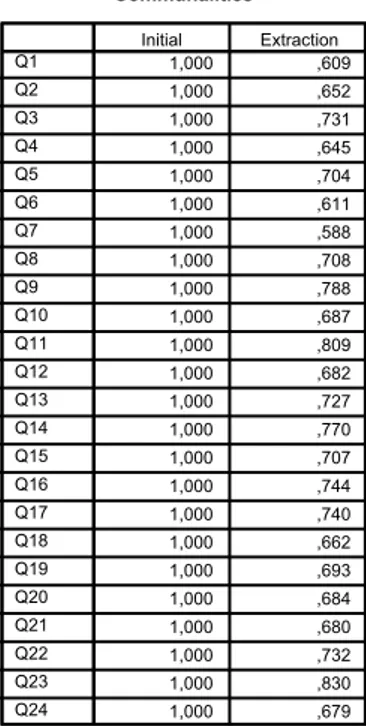
Table 4. Communalities
Communalities 1,000 ,609 1,000 ,652 1,000 ,731 1,000 ,645 1,000 ,704 1,000 ,611 1,000 ,588 1,000 ,708 1,000 ,788 1,000 ,687 1,000 ,809 1,000 ,682 1,000 ,727 1,000 ,770 1,000 ,707 1,000 ,744 1,000 ,740 1,000 ,662 1,000 ,693 1,000 ,684 1,000 ,680 1,000 ,732 1,000 ,830 1,000 ,679 Q1 Q2 Q3 Q4 Q5 Q6 Q7 Q8 Q9 Q10 Q11 Q12 Q13 Q14 Q15 Q16 Q17 Q18 Q19 Q20 Q21 Q22 Q23 Q24 Initial Extraction
Extraction Method: Principal Component Analysis.
The adopted solution, with six components, explains more than 70% of the total variance, which can be considered quite interesting (Table 5).
Table 5. Proportion of total variance explained per component
Total Variance Explained
9,436 39,315 39,315
2,325 9,688 49,003
1,674 6,974 55,977
1,515 6,311 62,288
,992 4,132 66,419
,920 3,833 70,253
,809 3,372 73,625
,717 2,987 76,612
,648 2,699 79,311
,590 2,460 81,772
,568 2,367 84,138
,534 2,224 86,362
,459 1,913 88,275
,433 1,806 90,081
,380 1,582 91,663
,348 1,449 93,112
,324 1,351 94,463
,278 1,159 95,622
,247 1,028 96,650
,238 ,990 97,641
,205 ,856 98,497
,151 ,628 99,125
,126 ,526 99,651
8,382E-02 ,349 100,000
Component 1 2 3 4 5 6 7 8 9 10 11 12 13 14 15 16 17 18 19 20 21 22 23 24 Total % of
Variance Cumulative % Initial Eigenvalues
The extracted component matrix, before rotation, did not revealed any underlying structure. Therefore, to improve interpretability, the factors were rotated according to the varimax algorithm. The obtained solution is presented in Table 6.
Table 6. Component Matrix after rotation
Rotated Component Matrixa
,802 ,315 -7,552E-02 9,163E-02 ,217 ,164
,770 8,753E-02 ,154 ,156 1,485E-02 5,792E-02
,757 ,194 9,218E-02 ,283 ,145 ,110
,622 2,011E-02 ,254 ,436 ,162 ,110
2,865E-02 ,756 ,300 5,232E-02 1,204E-02 ,197
,249 ,704 ,205 3,290E-02 ,199 6,997E-02
,222 ,651 8,375E-02 ,352 8,404E-02 4,582E-03
,177 ,650 ,243 -2,465E-03 ,238 -,135
,112 ,593 ,176 ,472 ,132 ,267
,242 ,133 ,850 4,757E-02 8,870E-02 9,736E-03
-6,230E-02 ,321 ,782 ,202 1,240E-02 ,103
-2,451E-02 ,135 ,774 ,151 ,204 ,214
,255 ,199 ,706 ,119 ,185 -,173
,277 5,098E-02 ,199 ,676 6,987E-02 ,167
,567 ,121 7,739E-02 ,575 ,106 -5,658E-03
,226 ,172 ,425 ,552 ,306 -,166
,453 ,382 ,172 ,505 -,155 -,181
,453 ,386 ,124 ,463 ,226 ,162
3,692E-02 ,188 ,182 6,403E-02 ,790 -9,929E-02
7,448E-02 -,103 ,168 7,664E-02 ,731 ,450
,173 ,450 1,194E-02 ,350 ,617 -7,406E-02
,426 ,252 ,292 -6,444E-03 ,591 -5,439E-03
,239 ,439 -3,139E-02 ,463 ,482 ,215
,401 ,249 8,446E-02 ,120 3,212E-02 ,697
Q23
Q2 Q22
Q21
Q5 Q4
Q6 Q7
Q15 Q11
Q14 Q13
Q12 Q1
Q20 Q10
Q19 Q18
Q8 Q9
Q17 Q24
Q16 Q3
1 2 3 4 5 6
Component
Extraction Method: Principal Component Analysis. Rotation Method: Varimax with Kaiser Normalization.
Rotation converged in 9 iterations. a.
The rotation was well succeeded, providing a meaningful structure. The allocation of the questions to components was globally unambiguous, although in few cases a deeper analysis and interpretation was needed. The final structure emerged as follows:
The Factor Analysis led to a structure with 6 factors or components that explained more than 70% of the total variance. Each component comprises one or more variables. The designation of each factor/component was based on the variables allocated to it:
Component 1: Employee’s Motivation
2. Motivate employees
21. Set criteria of effectiveness
22. Provide benchmarks for employees to self check progress
23. Raise awareness of the individual employee’s role in improving competitiveness 24. Develop a pay for performance reward system
Component 2: Internal and External Communication
4. Improve communications between departments 5. Increase information sharing
6. Develop team working skills
7. Integrate new staff into company systems 15. Provide customer service training exercises
Component 3: Tools and Techniques
Enterprise and Work Innovation Studies, No. 1, 2005 71
14. Provide training on advanced quality techniques (FMEA, QFD, 6-Sigma)
Component 4: Training Impact
1. Help the company optimise resources 10. Assist planning
18. Measure changes in on the job behaviour and performance 19. Provide feedback for trainees and managers
20.Relate results of training programme to organisational objectives
Component 5: Quality Systems
8.Use ISO 9000/2000 as a framework 9. Use EFQM as a framework
16. Measure cost of quality 17. Assist quality audits
Component 6: Leadership
3. Improve leadership skills
As can be seen two of the identified factors are based on “hard” issues of TQM (Tools and Techniques and Quality Systems) while three factors are strongly connected to “soft” issues of TQM (Employee’s Motivation, Internal and External Communication and Leadership). The remaining factor (Training Impact) is somehow cross sectional as it represents the necessity of evaluating the success of the training programs.
Average scores for each Factor were computed for the global sample and for each of Portuguese segments. Table 7 presents the obtained results.
Table 7. Average factor scores for Portuguese segments and global sample
(P) Small Companies
(P) Medium Companies
(P) Large Companies
Global sample for all countries
F1 Employee's Motivation 4,80 4,34 4,34 4,10
F2 Internal and External
Communication 4,43 4,26 4,39 4,10
F3 Tools and Techniques 4,37 3,95 3,82 3,51
F4 Training Impact 4,66 4,16 4,19 4,04
F5 Quality Systems 4,62 4,25 4,09 3,83
F6 Leadership 4,50 4,03 4,18 4,15
Figure 3 presents the same results in a radar type graphic, which is quite interesting to analyse.
Average Scores per Factor
3 3,5 4 4,5 5
Large Companies
Medium Companies
Small Companies
Global Results
Avera
F
It becomes clear that the scores for the Portuguese small companies are consistently higher than the rest of the sample for all factors, while medium and large Portuguese companies have a remarkable similar behaviour.
Generally speaking, medium and large Portuguese companies are more exposed to international contacts and practices. Therefore, it is not surprising that a similar behaviour is found between these segments and the global sample. However, it is possible to identify a stronger focus on hard
TQM issues for Portuguese companies when compared with the global sample. This conclusion is consistent with previous studies (e.g.Mathews et al., 2000).
Despite these conclusions, it is a fact that several experiences on TQM implementation have been disseminated through articles published in international journals and all of them stress the importance that both hard and soft methods have on the success of theses initiatives. Moreover, the new ISO 9001:2000 standard, according to which companies will be certified, also stresses the importance of having both organisational/relational and technical components in place.
Based on the obtained results, it is worth to discuss alternative training programs for small companies within the framework of IMVOCED. In fact, several authors (e.g. Lee (2004) and Hansson (2003)) stress the fact that universal approaches for TQM might not constitute an adequate framework for small companies.
Framework for TQM training
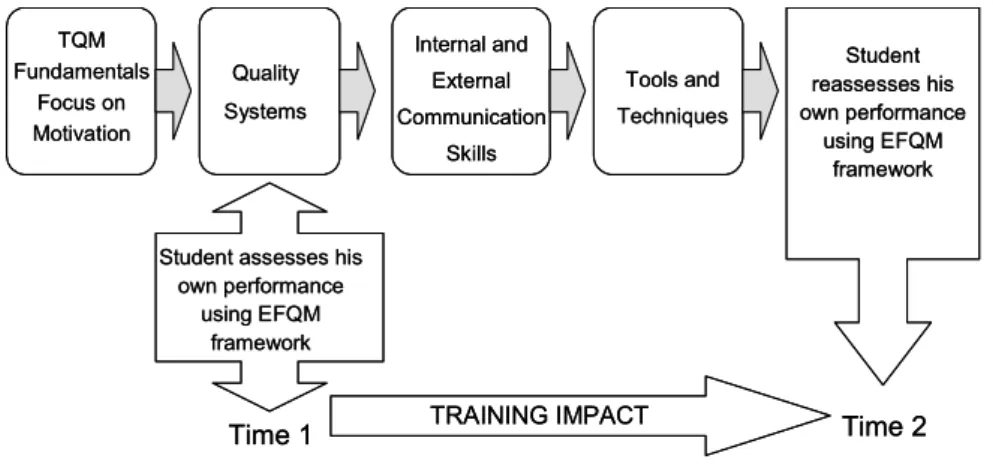
IMVOCED is structured for individual training and this kind of approach is probably the only one suited for individuals working in large and medium companies. Based on the conclusions from the questionnaire, a structure as the one presented on Figure 4 would provide a balanced provision of TQM training.
TQM Fundamentals
Focus on Motivation
Quality
Systems
Student assesses his own performance
using EFQM framework
Internal and
External
Communication
Skills
Tools and
Techniques
Student reassesses his own performance
using EFQM framework
TRAINING IMPACT
Time 1 Time 2
TQM Fundamentals
Focus on Motivation
Quality
Systems
Student assesses his own performance
using EFQM framework
Internal and
External
Communication
Skills
Tools and
Techniques
Student reassesses his own performance
using EFQM framework
TRAINING IMPACT
Time 1 Time 2
Figure 4. Individual based TQM training
The utilisation of some dimensions from the EFQM model might provide an adequate framework to evaluate training impact. The evaluation would be made on an individual basis, acting the student/worker as the Organisation under assessment.
Enterprise and Work Innovation Studies, No. 1, 2005 73 TQM Fundamentals Focus on Motivation Quality Systems
Joint Development of Company Self-assessment using EFQM framework Internal and External Communication Skills Tools and Techniques Joint Development of Company Self-reassessment using EFQM framework TRAINING IMPACT
Time 1 Time 2
Focus on Team Working Skills Company wide implementation of the new skills TQM Fundamentals Focus on Motivation Quality Systems
Joint Development of Company Self-assessment using EFQM framework Internal and External Communication Skills Tools and Techniques Joint Development of Company Self-reassessment using EFQM framework Joint Development of Company Self-reassessment using EFQM framework TRAINING IMPACT
Time 1 Time 2
Focus on Team Working Skills Company wide implementation of the new skills Company wide implementation of the new skills
Figure 5. Organisational based TQM training
Like in the individual program presented before, EFQM model could be the framework to assess the training impact. However, in this type of approach, self-assessment would be focused on the whole organisation. Furthermore, the assessments would be the primary vehicles to stimulate communication and to develop team working skills.
Conclusions
It is interesting to stress that smaller companies scored consistently higher the several training issues than medium and large companies did. This evidence puts small companies as a primary target for TQM training.
The six components model produced by Factor Analysis could explain approximately 70% of the total data variation and therefore constitutes an excellent framework to the development of TQM training programmes.
Based on this model, it was possible to see that a stronger focus on the hard issues of TQM is clear within the Portuguese companies when compared with the global sample of the five countries. Furthermore, it was concluded that different approaches for TQM training provision should be adopted, according to the organisation’s size.
Individual based TQM training is probably the best solution for people working in large and medium companies. However, as regards small companies, organisational based TQM training could/should be adopted, and coordination between individuals seeking for scholar credits and the global training programme might enhance synergies between the two approaches.
References
Bergquist, B., Fredriksson, M. and Svensson, M. (2005), TQM: terrific quality marvel or tragic quality malpractice?, The TQM Magazine, Vol.17, nº4, pp 309-321.
Dumas, R. (1989), Organizational Quality: how to avoid common pitfalls, Quality Progress, 22(5), pp. 41-44. Hair, J., Anderson, R., Tatham, R. and Black, W. (1995)- Multivariate Data Analysis with Readings, 4ª ed.,
New Jersey, Prentice-Hall Inc.
Hansson, J. and Klefsjö, B. (2003), A core value model for implementing total quality management in small organisations, The TQM Magazine, Vol.15, nº2, pp 71-81.
Lee, C. (2004), TQM in small manufacturers: an exploratory study in China, International Journal of Quality and Reliability Management, Vol.21, nº2, pp 175-197.
Mathews, B., Ueno, A., Pereira, Z.L., Silva, G., Kekale, T. and Repka, M. (2000), Training for Quality: findings from a European survey, Final Report.
Training for quality, 2(2), 7-12.
Tan, P.K.L. (1997), An Evaluation of TQM and the Techniques for Successful Implementation, Training for Quality, 5(4), pp. 150-159.
Thiagarajan, T. and Zairi, M. (1997a), A Review of Total Quality Management in Practice: understanding the fundamentals through examples of best practice applications – Part I, The TQM Magazine, 9(4), pp. 270-286.
Thiagarajan, T. and Zairi, M. (1997b), A Review of Total Quality Management in Practice: understanding the fundamentals through examples of best practice applications – Part II, The TQM Magazine, 9(5), pp. 344-356.
Thiagarajan, T. and Zairi, M. (1997c), A Review of Total Quality Management in Practice: understanding the fundamentals through examples of best practice applications – Part III, The TQM Magazine, 9(6), pp. 414-417.