ISSN 11222211--11227733, E-ISSN 22006655--33440099 Article no. 225522111122--669911
http://istgeorelint.uoradea.ro/Reviste/Anale/anale.htm
T
T
H
H
E
E
I
I
N
N
F
F
L
L
U
U
E
E
N
N
C
C
E
E
O
O
F
F
F
F
I
I
R
R
M
M
S
S
S
S
T
T
R
R
U
U
C
C
T
T
U
U
R
R
A
A
L
L
C
C
H
H
A
A
R
R
A
A
C
C
T
T
E
E
R
R
I
I
S
S
T
T
I
I
C
C
S
S
O
O
N
N
T
T
H
H
E
E
D
D
E
E
G
G
R
R
E
E
E
E
O
O
F
F
A
A
G
G
G
G
L
L
O
O
M
M
E
E
R
R
A
A
T
T
I
I
O
O
N
N
E
E
C
C
O
O
N
N
O
O
M
M
I
I
E
E
S
S
E
E
N
N
J
J
O
O
Y
Y
E
E
D
D
A
A
M
M
O
O
N
N
G
G
S
S
T
T
F
F
I
I
R
R
M
M
S
S
I
I
N
N
T
T
H
H
E
E
L
L
A
A
G
G
O
O
S
S
R
R
E
E
G
G
I
I
O
O
N
N
,
,
N
N
I
I
G
G
E
E
R
R
I
I
A
A
A
AddeejjoommppooFFAAGGBBOOHHUUNNKKAA
Geography and Planning Sciences Department, PMB 001, AdekunleAjasin University, Akungba Akoko, Ondo State, Nigeria, e-mail: [email protected]
Abstract: Agglomeration economies is a potent tool in socio-economic revamping, rejuvenation and sustenance of regions, this is as a result of the impulse it transmitted through the multiplier effect it is capable of generated. Therefore, this paper underscores the influence of firms structural characteristics on the degree of agglomeration economies enjoyed amongst firms, using the Lagos region as a case study. The first stage in the collection of primary data involves the reconnaissance survey, thereafter one hundred and three questionnaire were administered in twelve industrial estates; one questionnaire in each of the firm. The paper reveals the following structural characteristics as germane to industrial enterprise; age of firms, areal plant size (m²), capacity utilization (in percentage), and Labour size and firms investment. The paper has also found out those agglomeration economies enjoyed ranges from transportation, labour, power supply, to joint water supply. The Roy’s Largest Root test employed to test for the significance of the canonical correlations at 0.05 significant levels shows the calculated F-value 3.5247 and the tabulated F-value 2.90. This suggests that the degree of agglomeration economies enjoyed by firms is significantly explained by the size and structural characteristics of the firms. The paper therefore recommends more and active government participation in the industrial scene, given the necessary support for the expansion of firm’s structural characteristics which will lead to increase agglomeration economies enjoyed by these firms.
Key words: agglomeration economies, firms, multiplier effect, structural characteristics
* * * * * *
INTRODUCTION
Industrial agglomeration refers to the concentration of several industries in a given place or area. Such a concentration takes place because the area in question has the greatest location advantage over other areas, including the advantage of proximity to related industries. As stated earlier, manufacturing firms’ agglomerate in an industrial estate because of the infrastructural facilities like good roads, electricity and water supply, transport and communication well located industrial site with needed utilities, factory premises and other supportive facilities.
The concentration of the production facilities of a single firm or across multiple firms in a single location generates cost-saving scale effects and often leads to further agglomeration of firms
through an industrial location process (Weber, 1929; Venables, 2008). Such cost saving effects of agglomeration is often called agglomeration economies. Agglomerative activity can take many forms (Roller, 2007) and is often considered to result in either „localization“ or „urbanization“
(external) economies dependent upon the industrial composition of the cluster or complex. Localization economies involve economies amongst similar firms, while economies amongst unlike firms are known as urbanization economies. The latter form of agglomeration has received greater attention in the literature, often providing a mechanism for analyses of differential urban growth and optimal city size. Locating a firm in close proximity to similar types of firms or suppliers/demanders may have economic motivations in terms of enhanced productivity or reduced costs. The implied agglomeration, externalities or economies across firms in an industry or sector may be due to various forces, including a conglomeration of specialized inputs and informational or knowledge spillovers. That a firm locates in the midst of other manufacturing firms, allows it to employ specialist each of whom by devoting all his attention to a relatively small part of the company’s work, may do much to increase productivity. Collaboration in research and development also help the firms that agglomerate especially in the design and development of new products, which may seem to be a protracted and expensive undertaking by a single firm. Also, the provision of specialist maintenance services or training facilities or the development of a pool of labour with the skills appropriate to the industry has been made possible by the agglomeration of firms over space. Industrial location decisions of countries or regions entrepreneurs cannot be fully appreciated and properly assessed without taking into consideration the structural characteristics of the industries involved. This is why great attention has been paid to the structural aspects of manufacturing industries. The structural characteristics referred to in this chapter include the following: the type of establishment, the age of firms, estimated firms investment (in naira), the plant size (floor space square meters) and the labour force; indicated by number of employees.
CONCEPTUAL ISSUES/ LITERATURE REVIEW
The concept of external/agglomeration economies has held a central place within geographical accounts of the spatial concentration of economic activity since Weber’s discussion of agglomeration Fagbohunka (2014). The existence of externalities and increasing returns to scale in production is the most important explanatory factor for the geographic concentration of firms. Even if individual firms face constant internal returns to scale, agglomeration may generate externalities that create productivity advancements for individual firms in a given locations and therefore lead to increasing returns to scale at an aggregate level. Many studies have shown that agglomeration economics can affect productivity levels of local firms and boost the economic performance of a region (Atkenson, 2010; Beason, 1987; Feser, 2003, 1988; Henderson, 2003; Moomaw, 1988; Bottazi & Peri, 2007). They tested the degree to which productivity increases with industry size (locationalization economies) or city size (urbanization economics). In addition Wheeler & Mody, 1992; Reis & Traca, 2009; Bos & Kroetter, 2011; found that agglomeration economics are positively associated with firms investments and location decisions.
Positive spillovers or agglomeration economics are often called thick market effects. Krugman (1991) has argued that concentration of economic activity has its benefits. So having production and resources already concentrated on region very likely gives region a competitiveness advantage. Industrial structure has two basic elements which are: the physical and the organizational. The physical elements can be divided into the spatial/ physical aspect which is the distribution of industrial activity to specific location and non-spatial aspect which includes the raw material sourcing, the labour force, sources of labour gross output and value added by manufacture. The organizational structure includes the nature of control and ownership structure.
THE STUDY AREA AND THE METHODS
meridian, with a land area of about 1,088 km², covers about 32 percent of the land area of Lagos state. About 20 percent of this area is made up of Lagoons and mangrove swamps. Lagos region is the leading, industrial, commercial, financial and maritime nerve-centre of the country. Over 60 percent of all commercial transactions in Nigeria are carried out or finalized in the Lagos region. About 70 percent of the total value of industrial investments in Nigeria is in the Lagos region. Over 65 percent of the country’s industrial employment is concentrated in this region, leaving the remaining 35 percent in other parts of the country. The core of the state and a highly urbanized local government areas consisting of Lagos Island, Lagos Mainland, Surulere, Apapa and Eti-Osa. The centre and most developed of this chain of Island is Lagos Island.The Lagos state population figure for the 2006 national population census is 8,048,430. The first stage in the collection of primary data was the reconnaissance survey of the study area, while total sampling method was employed in the questionnaire administration. One hundred and three questionnaires were administered in twelve industrial estates; one questionnaire in each of the firm, connoting that all the firms in the industrial estates was successfully covered in the questionnaire administration.
FINDINGS
AGE OF ESTABLISHMENT
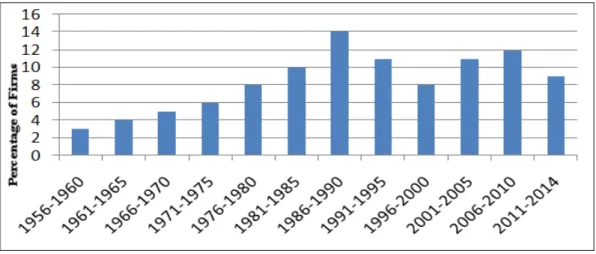
The age of firms presented in figure 1 shows that out of the 103 (100%) firms, only two (1.94%) firms were established between 1956 and 1960. Another 3 (2.9%) firms were established between 1961 and 1965, while four (3.9%) firms were established between 1966 and 1970. The number of firms established increased to five (4.9%) in 1971-1975, while six (5.8%) firms were established between 1976 and 1980. Also the number of firms established between 1981 and 1985 increased to 8 (7.8%), 10 (9.7%) firms between 1986 and 1990 and 14 (13.6%) between 1991-1995. Furthermore, the number of firms established between 1996 and 2000 were 11(10.61), whereas the eight (7.8%) where established between 2001 and 2005. Also, 11 (10.6%) where established between 2006 and 2010, and 12 (11.7%) between 2011 and 2014. The number of firms established has shown a steady increase especially between 1956 and 1990, it decline slightly in 1991 and 1995 and rise again between 2006 and 2010.
Figure 1. Ages of Firms
Source: Author’s Analysis, 2015
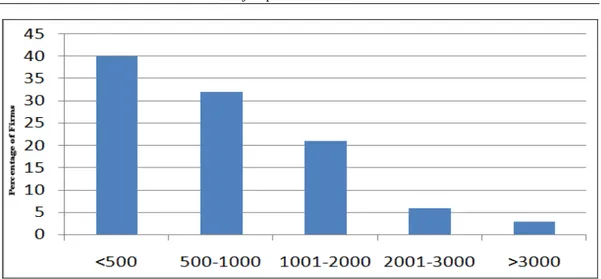
Figure 2. Areal Plant Size
Source: Author’s Analysis, 2015
CAPACITY UTILIZATION OF FIRMS
Fig. 3 reveals the capacity utilization of firms. None of the firms have their capacity utilization less than 21%, 4(3.9%) firms have their capacity utilization between 21-40%, while, 10 (9.7%) firms have between 41-60%, 35 (34%) firms have between 61-80%, and 54 (52.4%) have their capacity utilization between 81-100%. This indicates that majority of the firms have their capacity utilization between 81-100%.
Figure 3. Firms Capacity Utilization Source: Author’s Analysis, 2015
FIRM’S INVESTMENT
Figure 4. Firms Investment in Naira Source: Author’s Analysis, 2015
Table 1 reveal that 38 (36.9%) firms have less than six management staff, 46 (44.7%) have between 6 and 10 management staff, 12 (11.7%) have between 11and 14; 4 (3.9%) have between 15 and 19 management staff, only two (1.9%) have between 20 and 24 only, one (0.97%) have between 25 and 29 management staff.
Table 1. The Management Size of Firms
Source: Author’s Analysis, 2015
Management Staff Frequency Percentage
< 6 38 36.9
6-10 46 44.7
11-14 12 11.7
15-19 4 3.9
20-24 2 1.9
25 and above 1 0.97
Total 103 100
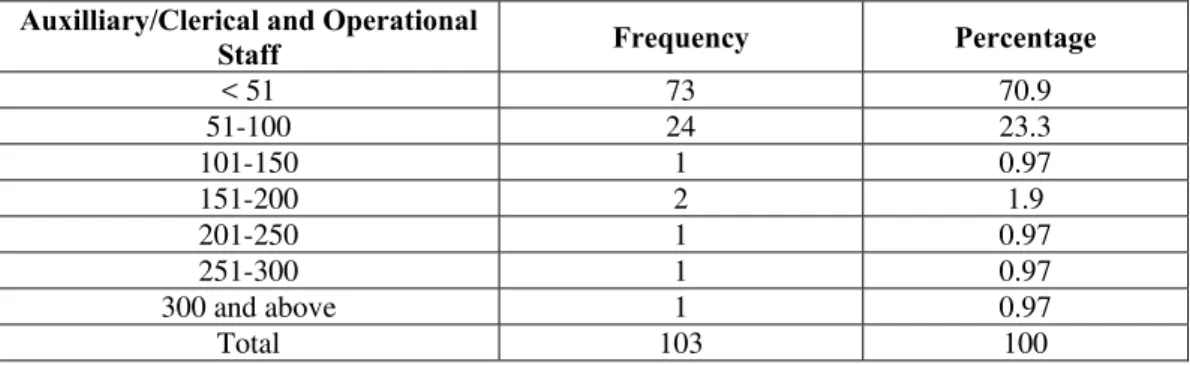
Table 2 depicts the auxiliary, clerical and operational/technical staff , 73 (70.9%) firms have less than 51, 24 (23.3%) firms have between 51-100, only one (0.97%) firm have between 101-150, while 2 firms (1.9%) have between 151-200, only one (0.97%) firms have between 201-250, 251-300 respectively, also, one (0.97%) have above 300.
Table 2. The Firms Auxiliary /Clerical and Operational Staff
Source: Author’s Analysis, 2015
Auxilliary/Clerical and Operational
Staff Frequency Percentage
< 51 73 70.9
51-100 24 23.3
101-150 1 0.97
151-200 2 1.9
201-250 1 0.97
251-300 1 0.97
300 and above 1 0.97
AGGLOMERATION FOREDEALS AMONGST FIRMS IN 2014
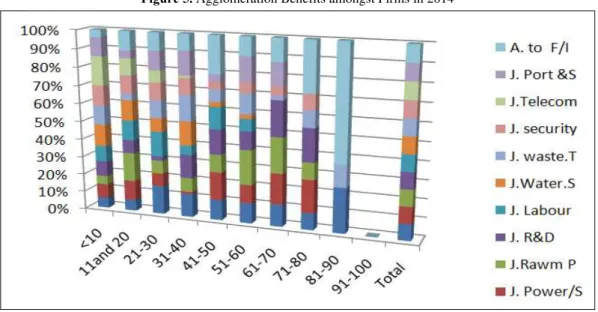
Figure 5 shows the agglomeration benefits in year 2014. There is significant variation in the agglomeration benefits amongst the firms. Seventy nine (76.7%) firms enjoyed <10% savings in telecommunication, whereas 20 (19.4%) firms enjoyed < 10 % savings as a result of access to financial institution. Also 3 (3%) firms enjoyed between 41 and 50% savings as a result of water supply, while 25 (24.3%) firms enjoyed between 41 and 50% due to Access to financial institution. It is vivid from the figure that access to financial institution was the most dominant, while none of the firms realized above 90% savings.
Figure 5. Agglomeration Benefits amongst Firms in 2014
The hypothesis which states that: The degree of agglomeration economies enjoyed by firms is not determined by the structural characteristic of firms is tested using the canonical correlation statistical technique.
The canonical correlation equation is given by,
CVY1 = a1Y1+a2Y2 + … + amYmCVX1 = b1X1+ b2X2 +…+ bpXp. Y’s = Agglomeration economies, forming the dependent variables, where
Y1= Joint Transportation (Savings accruing from joint transportation (transportation economies) Y2 = Joint Power supply (Savings accruing from joint use of power (power economies)
Y3 = Joint Raw Material Purchase/Supply (Savings accruing from joint Raw materials purchase (input economies)
Y4 = Collaboration in Research and Development (Savings accruing from joint R & D measured as a percentage monetary savings from R&D)
Y5 = Joint Labour Supply (Savings accruing from wage rate (Labour economies i.e. reduction in the cost of Labour)
Y6 = Joint Water Supply (Savings accruing from joint water supply measured as a percentage reduction in the cost of water supply).
Y7 = Joint waste treatment (Savings accruing from joint waste treatment) Y8 = Joint Security (Savings accruing from joint security services).
Y9 = Joint Telecommunication (Savings accruing from joint telecommunication). Y10 = Joint Ports & Shipping (Savings accruing from joint ports and shipping)
X1= Age of Firms (Years) X2 = Areal plant size (m2)
X3 = Capacity utilization (in percentage) X4 = Labour Size (Number of workers) X5 = Firms Investment (the monetary value)
Table 4 shows the result of Canonical Correlation Analysis of agglomeration economies and structural characteristics of firms. It reveals that agglomeration economies have a stronger variation coefficient, with r value of 0.9009, r2 value of 0.87 and 87% variance, while the structural characteristics has r value of 0.8381, r2 value of 0.70 and 70% of variance.
The Roy’s Largest Root Test depicted in table 5 was employed to test for the significance of the canonical correlations at 0.05 significant levels; result of the test shows the calculated F-value 3.5247 and the tabulated F-F-value 2.90. Since the calculated F-F-value is greater than the tabulated value. The null hypothesis is therefore rejected while the alternative hypothesis which states that the degree of agglomeration economies is determined by the structural characteristics of firms is accepted. This suggests that the degree of agglomeration economies enjoyed by firms is significantly explained by the size and structural characteristics of the firms.
Table 4. Summary of result of Canonical Correlation Analysis
Source: Author’s Analysis, 2015
Variables
Canonical Correlation
(r)
r2% of variance Decision
Set I Accept H1
Y1- 11 0.9009 0.81 81%
Set II
X111 – X555 0.8381 0.70 70%
Table 5. Roy’s Largest Root Test of Significant
Source: Author’s Analysis, 2015
R dfr dfc Level of Significant Calc. F Tab. F. Decision 0.9009
11 9 5% 3.5247 2.90 H1 is accepted
0.8381
SUMMARY AND CONCLUSION
The paper has examined the influence of firm’s structural characteristic on the degree of agglomeration economies enjoyed amongst firms. The firm’s structural characteristics analyzed in relation to agglomeration economies ranges from ages of firms (years), Areal plant size (m²). Capacity utilization (%), Labour size (number of workers) to firm’s investment (monetary value). The paper reveals that the number of firms established shows a steady increase especially between 1945-1985, declining slightly in 1986 and 1995 and rise again between 1996-2005.
The canonical correlation analysis carried out to test the influence of firms’ structural characteristics on the degree of agglomeration economies reveals that agglomeration economies have a stronger variation coefficient, while the Roy’s Largest Root test employed to test for the significance of the canonical correlations shows the calculated value 3.5247 and the tabulated F-value 2.90. This suggests that the degree of agglomeration economies enjoyed by firms is significantly explained by the size and structural characteristics of the firms. Hence, the structural characteristics of firms have a tremendous positive impact on the agglomeration economies enjoyed amongst firms. It could therefore be inferred that agglomeration economies if encouraged will help to boost the local economy, leading to industrial expansion which is a panacea to socio-economic development.
The paper has reveals that improvement and overhauling of firms structural characteristic will help immensely in industrial revival, thriving, increase output, improved industrial relations and partnership and more importantly enjoyment of more agglomeration benefits. The paper therefore recommends more and active government participation in the industrial scene, given the necessary support for the expansion of firm’s structural characteristics through liberalization of the industrial location factors, enacting and implementing friendly labour laws and giving credit facilities to interested investors. These recommendations, if implemented will lead to increase agglomeration economies.
REFERENCES
Adejompo Fagbohunka (2014), Firms Location and Relative Importance of Location Factors Amongst Firms in the Lagos Region, Nigeria, Research on Humanities and Social Sciences Vol. 4, No. 8.
Atkenson A., Burstein A. (2010), Innovation, Firm, Dynamics and International Trade, Journal of Political Economy, 118(3),433-484.
Bos J., Koetter M. (2011), Technology clubs, R&D and Growth Patterns: Evidence from EU Manufacturing, Review of Economics and Statistics, 54(1), Pp. 187-194.
Botazi L., Peri G. (2007), The International Dynamics of R & D and Innovation in the long run and in the Short Run,
Economic Journal, 117(578), Pp. 486-511.
Bottazi L., Peri G. (1999), Innovation, Demand and Knowledge Spillovers; Theory and Evidence from European Regions, Paper Prepared for the Conference on „Lessons from International Economics for International Economics”, June, 11 – 12, 1999, Cluster Center for International Business and Policy – Studienzetrum Gerzensee, pp.7-9. Feser E. (2003), A flexible test for agglomeration economics in two US Manufacturing Industries, Regional Science and
Urban Economics, 31, 1-190.
Fujita M., Krugman P., Venables A.J. (1999), The Spatial Economy. Cities, Regions and International Trade, Cambridge, Mass and London.
Henderson V. (2003), Marshall’s Scale Economies, Journal of Urban Economics, 53, 1 -28.
Krugman P. (1993), The Current case for Industrial Policy, In D. Salvatore (Eds); Protectionism and World Welfare Cambridge: Cambridge University Press.
Moomaw R.L. (1998), Agglomeration Economies: Localization or Urbanization; Urban Studies, 25, 150-161.
Reis A.B., Traca (2009), Spillovers and Competitive pressure for long-run Innovation, European Economic Review, 52 (4), Pp. 589-610.
Roller L.H. (2007), Why firms form (or Do Not form) RIVS, Economic Journal, 117(522), pp. 1122-44.
Venables Anthony (2008), New Economic Geography: The New Palgrave Dictionary of Economics, 2nd Edition Abstract. Weber A. (1929), Theory of the Location of Industries, Chicago: University of Chicago Press.
Wheeler D., Mody A. (1992), International Investment Location Decision: the case of U. S. Firms, Journal of International Economics, 33, 57-76.