The Hands-on Science Network © 2015 HSCI
Hands-on Science
Brightening our future
ISBN 978-989-8798-01-5
Edited by
Manuel Filipe Pereira da Cunha Martins Costa, University of Minho, Portugal José Benito Vázquez Dorrío, University of Vigo, Spain
Universidade do Minho Escola de Ciências
The Hands-on Science Network © 2015 HSCI Copyright © 2015 HSCI
ISBN 978-989-8798-01-5
Printed by: Copissaurio Repro – Centro Imp. Unip. Lda. Campus de Gualtar, Reprografia Complexo II, 4710-057 Braga, Portugal
Number of copies: 250 First printing: July 2015
Distributed worldwide by The Hands-on Science Network - [email protected] Full text available online (open access) at http://www.hsci.info
The papers/chapters published in this book are exclusive responsibility of the authors.
Please use the following format to cite material from this book:
Author(s). Title of Chapter. Hands-on Science. Brightening our Future. Costa MF, Dorrío BV (Eds.); Hands-on Science Network, 2015, Page numbers.
The authors of this book and the Hands-on Science Network, none of them, accept any responsibility for any use of the information contained in this book.
All rights reserved.
Permission to use is granted if appropriate reference to this source is made, the use is for educational purposes and no fees or other income is charged.
Hands-on Science. Brightening our future
© 2015 HSci. ISBN 978-989-8798-01-5
70
Robots to Learn Statistics and
Citizenship
PC Lopes
1; E Fernandes
21
Middle and Secondary School Ângelo
Augusto da Silva, Madeira, Portugal
2
University of Madeira; Portugal
1
[email protected];
2[email protected]
Abstract.
In this paper we report a small part of a broader study that is being carried out under the first author PhD, whose goal is to understand how the use of technologies, specially robots, helps students to develop statistical literacy, reasoning and thinking and their ability to problem-solving, producing meaning and enhancing learning. We assume as phenomenon under study - learning (of statistics and citizenship). In this paper we will analyse how learning of statistics and citizenship occurred throughout the search of the winner of a robot race.Keywords.
Educate for Citizenship, Learning Statistics, Robots, Statistical Literacy, Statistical Reasoning, Statistical Thinking.1. Introduction
We are in the information age and the access by citizens, to social, political and economic issues is done increasingly early.
Daily we are faced with information and statistical analysis in magazines, newspapers and other media. Often this information is presented in a disguised form and the analysis of statistical data is not presented in a transparent and impartial manner.
It is important for all citizens to relate and critically analyse the statistical data they face every day. It is crucial that all citizens be able to react, in a critical, thoughtful and assertive way, to the information with which they have to deal. However, “(…) many research studies indicate that adults in mainstream society cannot think statistically about important issues that affect their lives” ([1], p.3). They are not able to understand and analyse the information in order to make decision in an informed thoughtful and argued manner.
Schools should provide tools that help citizens to react intelligently to information in the world around them.
In this paper we will discuss and analyse how learning occurred, in this mathematical practice, in which students search the winner of the robot race they made.
2. Learning Statistics
Statistic is envisaged, both in Portugal and internationally [2], as a tool for the organization, representation and processing of data relating to real situations, which empower students with the ability to appraise in an informed and critical way their uses in various fields, particularly in the media. Thus, its study should provide tools to cultivate informed citizens, able to analyse and react in a critical, thoughtful and assertive way to the quantitative information in the world around them.
Several researches in statistics education field, argue that when planning the teaching of this subject it is necessary to create situations that enable the development of statistical literacy, reasoning and thinking. However, it is apparent that when statistics educators or researchers talk about or assess statistical literacy, reasoning or thinking, they may all be using different definitions and understandings.
In this paper, we conceptualize statistical literacy, reasoning and thinking as the three components of statistics’ competence and we discuss those components based in authors of reference such as Ben-Zvi and Garfield [1], Gal [3], Garfield [4], Mallows [5], Watson [6], Wodewotzki and Jacobini [7].
2.1. Statistical Literacy
The expression ‘statistical literacy’ is usually used to describe the individual´s ability to understand statistical data. Therefore, to have statistical literacy is central to a citizen to be able to understand the content published in a newspaper, on television and in the Internet, and to be active and critical in our society.
The term ‘statistical literacy’ is described by many researchers by different ways.
Garfiled [4] describes statistical literacy as the ability to understand statistical information, this is, to correctly use statistical vocabulary, symbols and concepts, being able to interpret graphs and tables and to understand statistical information displayed by the social media.
Hands-on Science. Brightening our future
© 2015 HSci. ISBN 978-989-8798-01-5
71
Similarly, Gal [3] and Watson [6] define statistical literacy as the ability to discuss opinions, to interpret and critically evaluate statistical information and the arguments based on data that appears in multiple contexts, for example, in the social media, in professional or personal life, and to ability to communicate them and make informed decisions. This definition is broader than the one presented by Garfield [4], since that are considered various contexts where information can be displayed and includes, beyond the comprehension of information, its interpretation and critical evaluation, communication of results and decision-making.
To develop students’ statistical literacy, we think that they need to learn how to use statistics to evidence, to argue and to justify situations that emerge in their everyday life, as students or as active and participatory citizens in society.
2.2. Statistical Thinking
Such as in statistical literacy, there’s not a consensus about the definition of statistical thinking.
Wodewotzki and Jacobini [7] state that statistical thinking may be assumed as a strategy to act. Accordingly, they consider statistical thinking as an analytic thinking.
With a broader definition, Mallows [5] presents statistical thinking as the ability to relate quantitative data with concrete situations and the ability to explain what the data express about the problem in focus.
Statistical thinking occurs when the individual is able to identify the problem under study and make an appropriate choice of statistical tools that are necessary for the description and interpretation of data. Thus, we can understand statistical thinking as the ability that an individual has to make decisions in each one of the stages of an investigative cycle. (Four-step cycle: (1.) Formulation of questions and design of the plan; (2.) Data collection; (3.) Representation and data analysis; (4.) Interpretation of data and formulation of conclusions [8], [9]).
Following these ideas, we consider that, to develop statistical thinking, students have to solve statistical problems that involve the
investigative cycle, instead of only solving statistical exercises. To do this, we must offer them situations that allow them to work their creativity and their critical sense and that promote reflection and debate.
2.3. Statistical Reasoning
Statistical reasoning may be defined as the way people reason with statistical ideas or statistical concepts and give meaning to statistical information [1].
Statistical reasoning allows individuals to combine ideas about statistical data and to make inferences and interpretations about statistical results. Thus, the development of statistical reasoning enables a student to understand, interpret and explain a statistical process based on real data.
According to Silva [10], for a student to develop this kind of reasoning, he should live learning situations where he has to compare concepts and evaluate the most appropriate way to analyse a variable or a set of variables. The author argues that the central tendency and dispersion measures are sufficient to develop students' statistical reasoning.
Garfield [4] states that if students learn the concepts and procedures and if they have the opportunity to work with real data, using statistical software, they will be developing their statistical reasoning.
Surely it will be possible to help students to develop their statistical reasoning if, in their daily school practice, the teacher proposes statistical investigations and encourage students to verbally describe the statistical process that they are examining.
3. Learning Citizenship
Celi Lopes [11] defines citizenship as the ability of an individual, in his social group, to act in a reflective, thoughtful and critical way.
Juliana Schneider and Rosemari Andreis [12] report that to exercise citizenship, especially in a society geared to knowledge and communication it is essential that students know how to communicate ideas, perform procedures, construct and interpret tables and graphs, estimate and make logical inferences and analyse data and information.
Hands-on Science. Brightening our future
© 2015 HSci. ISBN 978-989-8798-01-5
72
D'Ambrósio [13] refers that Education for citizenship, which is one of today's education goals, requires a "consideration" of modern knowledge, steeped in science and technology.
According to the way we conceptualize statistics learning in this paper (based on the development of statistical competence) to talk about statistics learning it is synonymous of talking about learning citizenship. So, the study of statistics will provide tools for the exercise of citizenship.
Environments that allow students the construction of concepts and the development of skills will help them in the exercise of their citizenship and thus broaden their chances of success in professional and personal life.
Teachers and students should be involved in the design and implementation of learning scenarios [14] in which students participate actively in their learning process. In this sense we created and implemented the learning scenario: Robot Race [15].
4. Research Methodology
The nature of this research is qualitative with an interpretative character due the nature of research problem [16].
The participant observation was a central strategy in data collection, enabling a close and personal contact with students.
The learning scenario - Robot Race - was implemented in a 8th grade class of a Middle school in Madeira Island, where 14 students (ages between 12 and 15 years old) worked together with robots, following a project methodology [17].
During nine sessions, 90 minutes each, math teacher and the researcher participant in data collection, worked together implementing the learning scenario. It was the researcher that guided the discussions.
We recorded all sessions with two video cameras and the emphasis was in students’ interactions.
5. The Learning Scenario: Robot Race
With this learning scenario students had their first experience with LEGO MINDSTORMS NXT’s robots and with its
programming environment.
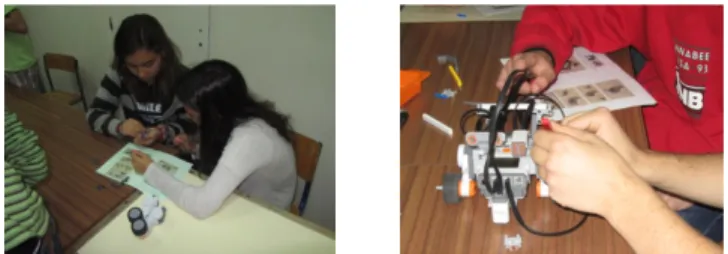
To work with NXT robots, students received assembling kits and had the opportunity to build in group, a car out of Lego bricks, following instructions. The place for the light sensor was specifically indicated but all remaining robot design was done according with students’ options.
Students programmed and carried out between robots in three different moments: i) they programmed the robot to run around four tables arranged in pairs (forming a rectangle); ii) they held races in a straight line from side to side of the classroom. Robot should stop when it detect a wall (ultrasonic sensor); iii) they had programmed, taking into account that, the robot would have to: start the race upon the starting signal (sound sensor), to follow a black line (light sensor) and to stop 15cm before the end of the line (ultrasonic sensor).
Each working group has created a prototype of a race route, with provided parts, so that two robots can race simultaneously. Each two robots need to have the same chance to win.
In the large group, students chose the race route to be used and then they have built it with real dimensions. They decided that, for all robots run under the same conditions, each one would have to run twice, against each opponent, once in each line of the race route.
The races were held, and from this moment onwards students could improve their programming to have a better chance to win.
Each working group collected data and worked it in order to choose the winner robot.
Figure 1. Robots' construction using Lego bricks
With the collected data from the races, each group made a statistical study where conclusions were provided and generalizations were established. Statistical contents emerged from the participation of students in that practice.
Hands-on Science. Brightening our future
© 2015 HSci. ISBN 978-989-8798-01-5
73
6. Learning with the Robot Race
6.1.
Robots Construction and
Pro-gramming
Students built their own robots and they were free to put on them all the accessories they wanted. This was very important because has contributed for students to learn the parts that make up LEGO kits and the morphology of the robot. Moreover, it allowed students to work independently, to discuss among themselves what they were doing and help each other.
Considering that each robot had a specific morphology, the programming was not the same for all working groups. It was necessary to adjust the programming to the morphological characteristics of each robot.
Students felt the need to make measurements when it was suggested them to "program the robot to stop when the robot is about a 15cm distance from the wall".
The place where students put the ultrasonic sensor on the robot, affected its programming. In order to achieve an effective programming to the requested task, the students measured the distance between the end of the ultrasonic sensor and the front of their robot.
The programming and its testing was a dynamic process and it was part of students’ practice. In this process of modifying their programming, students developed the communication and the ability to build strategies, since they had to justify and negotiate with the peers in the group, the programming they were doing.
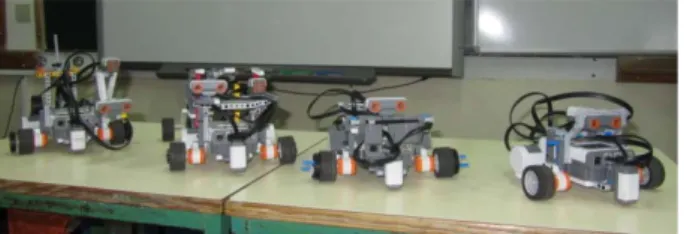
Figure 2. The built robots (cars)
When students created, negotiated and justified their procedures, they developed their ability to argue and to reason. By programming, and trying to explain their own program, students have established and justified logical connections between the programming they have done and the robot performance. This process was important and fundamental for the
development of an increasingly efficient and effective programming.
Figure 3. Two robots with the ultrasonic sensor on different locations
The challenges posed to the students awakened competition (students from each group competed to program their robots more quickly and effectively than others) and interest on programming. Besides, it was important to the process of involving students in the practice.
The different working groups defined their goals and negotiated meanings in order to successfully address the posed challenges. In the process, they discussed, experimented, negotiated and changed their programming.
In each formulated and negotiated attempt to solve a problem, students have become agents of their own knowledge and built their own learning process.
6.2.
Construction, Presentation and
Choice of a Race Route
To the construction of the prototype of a race route it was provided to each working group 24 small parts: 12 straight parts and 12 curved parts. Students were informed that they had to construct a race route that it was fair for two robots race simultaneously. The following conditions were placed: (i) the race route had to fit in the classroom; (ii) each part of the prototype was 15 times smaller than the real one; and (iii) it was not necessary to use all the small parts given in the prototype’s construction.
Figure 4. Prototype's construction of a race route
Hands-on Science. Brightening our future
© 2015 HSci. ISBN 978-989-8798-01-5
74
It was clear to us that it was part of the shared knowledge of this class that "to be a fair race route the length of the two lanes had to be equal”, but not all students knew the conditions for that happen. Together students built the concept of 'fair race route' and also the prototypes in the established conditions. To do that, students appealed, such as in other moments, to examples of non-school practices.
The fact that students shared their individual perspectives on the issue, contributed to the knowledge of all students about what is a 'fair race route'. This aspect has become part of a shared knowledge of these students and enabled the creation of a race route with the established conditions.
All working groups explained why their prototype was a fair race route, but none has mentioned if the constructed race route fit in the classroom. Only when students were asked if the race route fit in the classroom, they felt the need to make measurements.
Figure 5. Changing the prototypes of a race route to "fit" in the classroom
After a few advances and retreats, all working groups created a fair prototype, possible to be built in the classroom. To do that, they had to be able to look critically at their objects (prototype and classroom) and interpret them appropriately.
Each working group presented its prototype to the class. The class decided voting as a way to choose the race route to be used - here students made their first statistical study and explored some statistical concepts.
When it was over the counting vote (5 votes to prototype 1, 8 votes to prototype 2 and 1 vote to prototype 3) a student said “We already have our problem solved. The mode is the prototype 2, because of that, this prototype won”.
After that another student added: “Yes, the prototype 2 is the one that has more votes, we
say that it is the mode. There are no draws. It has mode, that it is the prototype 2”.
Figure 6. The prototypes of a race route built by students
The teacher asked what was the variable under study. The students answered that were the prototypes and added that the variable was qualitative.
These statements showed that students had statistical literacy, once they were able to interpret and critically evaluate the situation and make a decision about the information gathered in the voting process. Besides, they were capable of reason about data [18] because they recognized the statistic variable, its nature and categories, and used a suitable measure, in this case the mode.
The dialogue between teacher, researcher and students followed in order to discuss and differentiate concepts such as: population and sample, census and survey and to clarify that, in that study, data collection was done by vote. This dialogue has emerged because both teacher and researcher had the intention on address those concepts, in order to expand students’ statistical literacy. It was also discussed the importance of choosing a representative sample of the population and about necessary cautions to have on sampling.
6.3. The Races
After some attempts, students programmed their robots in order to correctly make the races. Students followed the proposed conditions, namely, the robot would have to: start the race upon the starting signal (sound
sensor), follow a black line (light sensor) and to
stop 15cm before the end of the line (ultrasonic
Hands-on Science. Brightening our future
© 2015 HSci. ISBN 978-989-8798-01-5
75
The assembly of the racing route and the time that students made the races, can be characterized as moments of mutual help among students from different working groups. Those moments also provided the union of all class.Students shared tasks and each group collected the data that they considered important to define the winner robot and to robots’ classification. The work was distributed among students on a very natural, orderly and effectively manner.
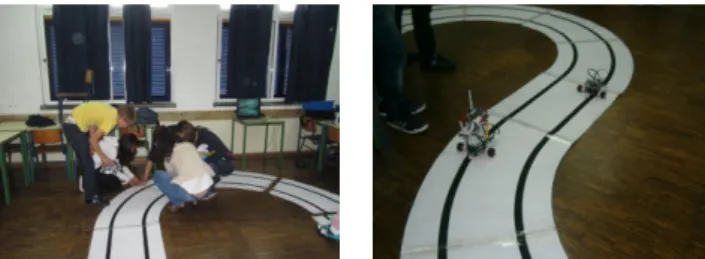
Figure 7. Programming for the races
In the course of learning scenario’s implementation there was a greater autonomy and better management on task sharing by students. They started, progressively and naturally, making decisions without first questioning teacher or researcher.
The realization of racings with robots gave students the opportunity to produce their own data and find the desired results and helped them to take charge of their own learning.
Figure 8. The assembly of the racing route and the robot races
After twelve racings, the data collection phase was terminated.
6.4. The Winner Definition
In this phase, students had to analyse the data collected during races and convert them into relevant information to answer the questions asked. Students had to establish criteria to select a winner robot for the races.
Each working group chose a representation and (or) a statistical measure that they
considered suitable to analyse data. In this process they took into account the nature of the variable under study and the previously purposed.
Students used the Excel spreadsheet to organize the collected data. They analysed those data and found arguments to choose a winner robot for the races. In addition, students have set criteria for the classification for all robots.
Most of the students had never used the Excel spreadsheet and did not know its potential. By experimenting and sharing information, students were able to use Excel formulas to perform calculations (sums, means). They also built graphs to organize information. This tool proved to be important both to analyse the data and for the data representation through graphs and tables.
By establishing the criteria for a robot to be a winner, students presented and discussed their perspectives on the situation. This led the emergence of varied and original strategies. They were able to interpret and critically evaluate the collected information during the races, use and establish statistical relationships in order to define the winner, using analytical methods, exploring the data in order to extrapolate issues beyond teacher and researcher’s expectations.
The arguments and strategies explained by students were based on mean, minimum and maximum of data set. In all cases, students had to explain the meaning of the statistical contents they were using on this situation.
Students showed evidence that they developed their statistical thinking [19], because they were able to identify the statistical concepts and they proved to have ability in dealing with them in the context of the situation under analysis.
Some concepts used by the students were availed by the teacher and the researcher to bring out other statistical concepts (such as extremes and amplitude of the sample) and, therefore, continue to promote the development of statistical literacy.
All students were capable of interpret and critically evaluate the collected information, to use and establish statistical relations to define
Hands-on Science. Brightening our future
© 2015 HSci. ISBN 978-989-8798-01-5
76
the winner robot, using methods of analysis, exploring the data in order to formulate conclusions. They were also able to explain the process created by their group to set the winner robot, showing that they have extended their reasoning and statistical literacy.
Students developed their statistical reasoning [20], because they were capable of understand, interpret and explain the statistical methods based on data collected during the races.
Despite the apparent justice of all criteria established by the working groups, we cannot overlook the fact that, in most cases, students defined a valid argument to make their robot be the winner. This reveals that students reflected about the data and they were capable of choose which was the best central measure, to define the winner robot. Thus, we consider that students developed their reasoning about statistical measures [18].
During the discussion about the criteria to establish the winner robot, students presented and argued their perspective on the situation and defended their opinions, revealing that they have acquired and developed statistical literacy [3], [6].
In all class, students had to relate the data with the situation under study and explain what those data expressed about the problem in focus. Therefore, they used and developed their statistical thinking [5].
7. Conclusions
Paulo Freire [21] argues that “ (..) when a men understand its reality, can arise hypotheses about the challenge of this reality and find solutions” (p. 30).
To provide a relevant context – Robot Race – combined with the sense of challenge and competition that emerged, has contributed to develop a seeking of solutions by the students.
Robots assembling, their programming and making the robot races, were important moments in this classroom practice, in which students worked cooperatively. In those moments, students proved to be motivated to learn and happy with the work they were carrying out. They never gave up.
To work with robots allowed the emergence
of students’ statistical literacy [3], [4], [6] once they had opportunity to: i) organize data that were part of their reality; ii) interpret and critically evaluate statistical information; iii) argue relatively to data collected; iv) elaborate strategies and justify procedures; v) discuss or communicate their conclusions; vi) take informed decisions. By doing this, students developed their ability to act in a more responsible, reflective, thoughtful and critical manner, that is, to learn citizenship [11], [12].
Statistical thinking is related to the ability to identify the statistical concepts involved in the investigations and problems and the ability to deal with them, considering the nature of data variability. A way that we found to encourage students’ statistical thinking, was not accepting any numerical result without being explained and related to the context, that is, with the situation being studied. Students have collected the data and, thus, they have recognized the context in which they were collected and the purpose of its use. They were able to reason with ideas and statistical concepts, giving meaning to statistical information.
The students were able to relate the data and explain what they expressed, using statistical tools. They used methods of analysis and assessment, exploring the data, thereby demonstrating they have developed statistical thinking [5].
With the data collected, in the races, students used statistical relationships to define the winner robot, using methods of analysis and estimation, exploring the data in order to extrapolate questions beyond teacher expectations. By doing this students have developed statistical reasoning [1] because they were able to understand, interpret, and explain statistical methods based on real data (races data).
We believe that, with this work with robots, students have become more able to solve problems, to understand, to interpret, to analyse, to relate, to compare and synthesize data, therefore, they developed statistical competence and citizenship.
8. References
[1] Ben-Zvi D, Garfield J. Statistical literacy, reasoning, and thinking: goals, definitions, and challenges. In: Ben-Zvi D, Garfield J
Hands-on Science. Brightening our future
© 2015 HSci. ISBN 978-989-8798-01-5
77
editors. The Challenge of Developing Statistical Literacy, Reasoning and Thinking (p. 3-15). Dordrecht, The Netherlands: Kluwer Academic Publishers; 2004.
[2] NCTM. Principles and Standards for School Mathematics. 2000.
[3] Gal I. editor. Adult Numeracy Development: Theory, Research, Practice. Cresskill, NJ: Hampton Press; 2000.
[4] Garfield J. The statistical reasoning assessment: Development and validation of a research tool. In: Pereira-Mendoza L, Seu Kea L, Wee Kee T, Wong W, editors. Proceedings of the Fifth International Conference on Teaching Statistics; 1998 Jun 21 – 26; Voorburg, The Netherlands: International Statistical Institute; 1998, vol. 2, p. 781-786.
[5] Mallows C. The Zeroth Problem. The American Statistician. 1993; 52: 1-9.
[6] Watson J. Assessing statistical thinking using the media. In: Gal I, Garfield J editors. The Assessment Challenge in Statistics Education. (p. 107-121). Amsterdam: IOS Press and International Statistical Institute; 1997.
[7] Wodewotzki MLL, Jacobini ORJ. O Ensino de Estatística no contexto da Educação Matemática. In: Bicudo MAV, Borba MC, editors. Educação Matemática: pesquisa em movimento. (p. 232-249). São Paulo: Cortez; 2004.
[8] Martins ME, Ponte JP. Organização e tratamento de dados. Lisboa: ME-DGIDC; 2010.
[9] Selmer S, Bolyard J, Rye J. Statistical reasoning over lunch. Mathematics Teaching in the Middle School; 2011; 17(5): 274–281.
[10] Silva CB. Pensamento estatístico e raciocínio sobre variações: um estudo com professores de matemática. Tese de doutoramento em Educação Matemática. Pontifícia. Universidade de São Paulo. São
Paulo. 2007.
http://iase-web.org/documents/dissertations/07.Silva. Dissertation.pdf [visited 1-jun-2015]
[11] Lopes C. O Ensino da Estatística e da Probabilidade na Educação Básica e a Formação dos Professores. Caderno Cedes. Campinas 2008; 28(74): 57-73. http://www.cedes.unicamp.br [visited 2-Jun-2015]
[12] Schneider J, Andreis R. Contribuições do Ensino de Estatística na Formação Cidadã do Aluno da Educação Básica.
http://www.uniedu.sed.sc.gov.br/wp-content/uploads/2014/04/juliana_schneider. pdf [visited 1-Jun-2015]
[13] D’Ambrósio U. Educação Matemática: da teoria à prática. 4. Campinas, SP: Papirus; 1996.
[14] Wollenberg E, Edmunds D, Buck L. Anticipating Change: Scenarios as a Tool For Adaptive Forestmanagement. A Guide. Indonesia: SMT Grafika Desa Putera; 2000.
[15] Lopes C. In: Fernandes E, editor. Aprender Matemática e Informática com Robots. (p. 86-95). Funchal: Universidade da Madeira; 2013.
www.cee.uma.pt/droide2/ebook/index.html [visited 11-Jun-2015].
[16] Bogdan R, Biklen S. Investigação Qualitativa em Educação: Uma Introdução à Teoria e aos Métodos. Porto: Porto Editora; 1994.
[17] Greeno JG, MMAP. The situavity of knowing, learning and research. American Psychologist 1998; 53(1): 5-26.
[18] Garfield J, Gal I. Teaching and Assessing Statistical Reasoning. In: Stiff L editor. Developing Mathematical Reasoning in Grades K-12: National Council Teachers of Mathematics (p. 207-219). Yearbook, Reston, VA: Ed. L. Staff; 1999.
[19] Chance BL. Components of Statistical Thinking and Implications for Instruction and Assessment. In Journal of Statistics Education [Online], 2000; 10(3). www.amstat.org/publications/jse/v10n3/cha nce.html [visited 21-Jun-2015]
[20] Garfield J. The Challenge of Developing Statistical Reasoning. In Journal of Statistics Education [Online], 10(3). www.amstat.org/publications/jse/v10n3/garf
Hands-on Science. Brightening our future
© 2015 HSci. ISBN 978-989-8798-01-5
78
ield.html [visited 10-Jun-2015]
[21] Freire P. Educação e mudança. 27. ed. Rio de Janeiro: Paz e Terra; 2003.