RBRH, Porto Alegre, v. 23, e39, 2018 Scientific/Technical Article
https://doi.org/10.1590/2318-0331.231820180009
Investigation of the activity of Rn-222 along a small stream
in the Representative Basin of Juatuba - MG
Investigação da atividade do Rn-222 ao longo de um pequeno córrego na Bacia Representativa de Juatuba - MG
Vinícius Verna Magalhães Ferreira1*, Cláudio José Chagas1, Rubens Martins Moreira1, Zildete Rocha1,
Talita de Oliveira Santos2 and Raquel Luiza Mageste Fonseca1
1 Centro de Desenvolvimento da Tecnologia Nuclear, Belo Horizonte, MG, Brasil 2 Universidade Federal de Minas Gerais, Belo Horizonte, MG, Brasil
E-mails: [email protected] (VVMF), [email protected] (CJC), [email protected] (RMM), [email protected] (ZR), [email protected] (TOS), [email protected] (RLMF)
Received: January 30, 2018 - Revised: July 03, 2018 - Accepted: August 09, 2018
ABSTRACT
For thousands of years, water has been the focus of experimentation toward solving the challenges associated with human water
supply, navigation, irrigation, and sanitation. The use of tracers to study water resources is an efficient approach that can facilitate the
modeling of many hydrological scenarios. The goal of this paper is to show results of research that tracked the presence of Rn-222, a natural tracer, in the surface waters of a small watercourse in southeastern part of Brazil. RAD 7, which is an electronic and portable radon detector, was the main instrument used in this survey. We analyzed 117 water samples and converted the radon activity results to effective radiation doses with respect to the hypothetical human consumption of these waters. We also analyzed the sediments of the watercourse. The obtained data showed that the radon activity in the studied waters varies between 0.52-76.96 Bq/m3. We determined
the effective dose of all samples to be less than 1 mSv y−1, and its consumption to present no risk to human health. The existence of connections between surface and subsurface waters in the stream is possible, and radon peaks may indicate the existence of discharge zones into the surface water body.
Keywords: Radon; Surface water; Juatuba Basin.
RESUMO
Por milhares de anos, a água tem sido objeto de vários experimentos que tentam resolver questões como o abastecimento humano,
navegação, irrigação e saneamento. O uso de traçadores para o estudo de recursos hídricos é uma eficiente ferramenta que pode facilitar
a modelagem de inúmeros cenários hidrológicos. O objetivo deste trabalho é mostrar alguns resultados de uma pesquisa que rastreou
a presença de radônio 222, um traçador natural, nas águas superficiais de um pequeno curso de água na região sudeste do Brasil.
O equipamento principal que deu suporte aos trabalhos foi o RAD 7, um detector eletrônico portátil de radônio. Foram analisadas 117 amostras de água e os resultados da atividade do radônio foram convertidos para a dose efetiva de radiação considerando-se um consumo hipotético dessas águas. Os sedimentos do curso de água também foram analisados. Os dados obtidos mostraram que a atividade do radônio nas águas estudadas varia de 0,52 a 76,96 Bq/m3. A dose efetiva de todas as amostras foi menor que 1 mSv y-1,
e seu consumo não representa risco para a saúde humana. É possível a existência de conexões entre águas superficiais e subterrâneas
no córrego, e os picos de radônio podem indicar a existência de zonas de descarga nas águas de superfície do córrego.
INTRODUCTION
A tracer can be defined as any substance or particle
(chemical or biological) that can be used to follow, either punctually or continuously, the behavior of a particular system
or component, such as water flow in an underground or open
environment (DAVIS et al, 1980). Tracers are very useful tools for investigating many processes, and can be very helpful in clarifying many natural phenomena. According to the scenario under study, different kinds of tracers could be used, including
radioactive, chemical, fluorescent, and biological ones. Tracers have
been used in oilfield applications (SERRES-PIOLE et al., 2012)
as well as to study the deposition of particulate matter on urban vegetation (VOLTAGGIO et al., 2016). Researchers in Australia studied lead pollution in marine sediments with the help of tracers (ALYAZICHI; JONES; MCLEAN, 2016), and medical scientists have recently used tracers for a variety of purposes (OOMS et al., 2014), (COLE et al., 2014).
The science of hydrology, along with many other research areas, routinely uses tracers to solve problems. Examples include the use of viruses as tracers to study residence times in aquifers (HUNT; BORCHARDT; BRADBURY, 2014), and the use
of natural tracers to track groundwater flow in a mining area
(COZMA et al., 2016). Tracers have also been used in the management of a nuclear site, for the protection of water resources, in simulations of a hypothetical near-surface repository for low-level radioactive waste (TESTONI; LEVIZZARI; DE SALVE, 2015), and in the evaluation of environmental impacts caused by the bottom discharges of a small hydro power plant (FERREIRA et al., 2013).
Rn-222, a natural tracer that has been used in many hydrological studies, is produced by the alpha decay of Ra-226 in the decay series of U-238, and has a half-life of 3.8 days. Rn-222 is more suitable as a water tracer than Rn-220, which is produced by the radioactive decay of Th-232 in the Ra-224 series, and has a half-life of just 56 seconds. Since it is chemically inert, Rn-222 can be used as a water tracer in streams, rivers, reservoirs, oceans, and aquifers, which makes possible to disregard biogeochemical reactions and facilitate its measurement. It is well known that radon in groundwater is enriched compared to that in surface waters. This feature results from the fact that groundwater is in contact with mineral grains that contain Ra-226, and surface water is subject to turbulence generated by environmental conditions, which allows radon to escape (BURNETT et al., 2008).
However, the presence of radon in water can be a problem, since there are safety limits for its ingestion by humans. The World Health Organization (WHO) established guidelines regarding the quality of drinking water, and included radiological aspects as one parameter to be observed. It has also emphasized that the ingestion and inhalation of radon can be responsible for a number of health problems (WHO, 2011).
Since the harmful effects of radon were first recognized
and discussed, researches have been undertaken around the world to investigate the radon concentrations in surface and subsurface waters, oceans, wells, and springs, and to address the effects of its consumption. For example, in a survey of natural waters conducted in Romania (1511 samples), researchers found a correlation
between the radon concentration and the geological structure (COSMA et al., 2008). In Serbia, a similar study of 44 samples showed that waters from a volcanic region had a radon activity much higher than the recommended level (TODOROVIC et al., 2012). In Greece and Cyprus, the radon activity in waters has also been studied (NIKOLOPOULOS; LOUIZI, 2008), as it has in India (MITTAL; RANI; MEHRA, 2016), Austria (GRUBER; MARINGER; LANDSTETTER, 2009), Poland (BEM et al., 2014), Pakistan (NASIR; SHAH, 2012), Tunisia (TELAHIGUE et al., 2018), 2016), Portugal (INÁCIO; SOARES; ALMEIDA, 2017), China (WU et al., 2014), among many other countries.
In Brazil, researchers have also studied the presence of radon in water, including the mechanics of its transfer from rocks and soils to water, as well as its presence in the alkaline massif of Poços de Caldas and in the Paraná sedimentary basin (BONOTTO; LIMA, 1997). The activity of radon in water has also been studied in the Bauru aquifer (SANTOS; BONOTTO, 2011), in three different regions in the state of Bahia (COSTA; AZEVEDO, 2012), in the municipality of Águas da Prata (BONOTTO; LIMA, 1997), and in the metropolitan region of Curitiba (CORRÊA et al., 2015), among others.
The current study aims to track the presence of Rn-222 along a small stream in a rural area in the southeastern region of Brazil. We converted the radon activity in the water samples into effective doses to determine whether or not its consumption by humans would present a health risk. We then compared these values with data from other countries. In addition, we analyzed samples of sediments collected along the stream to determine their radium activity levels (since radium becomes radon by radioactive decay).
MATERIAL AND METHODS
Study area
The Juatuba Basin (Figure 1) is located in the upper part of the São Francisco River in the state of Minas Gerais in southeastern region of Brazil. This watershed covers 442 km2, is
located 60 km from Belo Horizonte (the state capital), complying part of the cities of Mateus Leme, Igarapé, and Itaúna. The main
affluents that feed into and form the Juatuba River are the Serra
Azul and Mateus Leme streams, which have drainage areas of 265 km2 and 155 km2, respectively. For this study, we chose the
Matinha stream, which is 2.2 km long and located in a rural area. Along the watercourse, 117 water samples were collected, being 18 meters the average distance between the sampling points. The study area is adjacent to a region known as the “Iron Quadrangle,” which, according to a geological survey, consists of rocks from the Archeozoic, Lower Proterozoic, and Cenozoic periods. The region has a predominance of gneiss, gray granitic rocks, quartz, orthoclase, muscovite, biotite, and epitope (DRUMOND 2004).
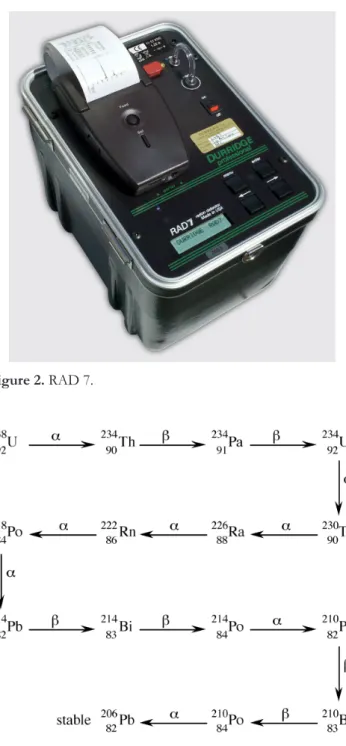
RAD 7
We used this detector (Figure 2) to read the activity of Rn-222 in the water samples collected from the studied stream. The RAD7 has two modes for measuring radon in water: a GRAB mode for a single value and a SCAN mode for continuous measurements. In this study, we used the GRAB mode. The RAD7 has three main operational steps:
1. Drying - the device removes any water present in the system to prevent damage to the equipment. Following this step, the internal moisture content of the device should
be ≤6%, which makes feasible the reading of samples;
2. Analysis - over a time period of 30 minutes, the device performs four readings and, for each one, displays its radon activity and standard deviation. Then, it calculates the average of these four sample values;
3. Cleaning - after reading a sample, the RAD7 must be cleaned in an open circuit to eliminate all radon from the system prior to performing the next readings.
Rn-222 decays by alpha emission to Po-218, and the RAD7 calculates the radon concentration on the basis of the Po-218 alpha peak. Figure 3 shows the radioactive decay series for U-238, which includes Rn-222 (DURRIGDE RADON INSTRUMENTATION, 2015).
The RAD 7 detector can read activities in a range from 10 pCi.L−1 to 400.000 pCi.L−1. For its operation in this project, we used the Wat250 protocol, which means that the
water samples were stored and read in 250-ml flasks. Then, we
connected a functional kit known as RAD H2O to the system for its operation. We collected all water samples from close to the bottom of the stream with the help of a peristaltic pump powered by a 12 V battery.
We obtained the initial concentration of radon using Equation 1, where A(t) is the concentration of Rn-222 measured at time t, A0 is the initial concentration of radon in the sample,
λ is the decay constant of Rn-222 (0.18), and t is the elapsed time
between collecting and reading the sample.
( ) t*
0
A t =A * e− λ (1)
We note that the RAD 7 detector has been used in many other projects that required measurement of Rn-222 in water (AKAWWI 2014), (RAVIKUMAR et al. 2014), (LE et al. 2015).
Sediment and background analyses
To determine if there is any correlation between the presence of Rn-222 in the water and the existence of Ra-226 in the sediments of the watercourse, we conducted a sampling campaign in May 2016. Using a small shovel, we collected sediments from the source to the end of the stream, at 100-m intervals, from the bottom and both sides, to yield 22 composite samples. We analyzed the samples by gamma spectrometry, a non-destructive analytical technique that enables
the identification and quantification of gamma-emitting isotopes in
a wide variety of matrices. The model we used for sample counting
was a high-resolution HPGe detector with a nominal efficiency of
50%, manufactured by CANBERRATM. This detector is a coaxial
model 5019 (DSA-2000) coupled to a microcomputer with a multichannel-spectrum acquisition board and a Genie2K program.
Calculation of dose from ingestion of water
We used Equation 2 to determine the annual effective dose due to the presence of Rn-222 in drinking water:
Deff = K×G×C×t (2)
where Deff is the effective dose from ingestion, K is the ingestion dose conversion factor for Rn-222, G is the volume of water consumed, C the concentration of Rn-222, and t the duration of consumption. In this work, we used a dose conversion factor (K) of 3.5×10⁻⁹ Sv Bq−1(1) to calculate the effective dose (NRC, 1999). The daily average water consumption per capita (G) has been determined to be typically between one to two liters per day (PINTI et al., 2014), which was used to calculate the annual effective dose of Rn-222 in drinking water (YALCIN et al., 2011). In this work, we assumed a mean value of
−1.5 l/day and the parameter t represents a year, or 365 days.
RESULTS
Table 1 presents the results of Ra-226 in the sediments collected along the Matinha stream, based on the gamma spectrometry analysis.
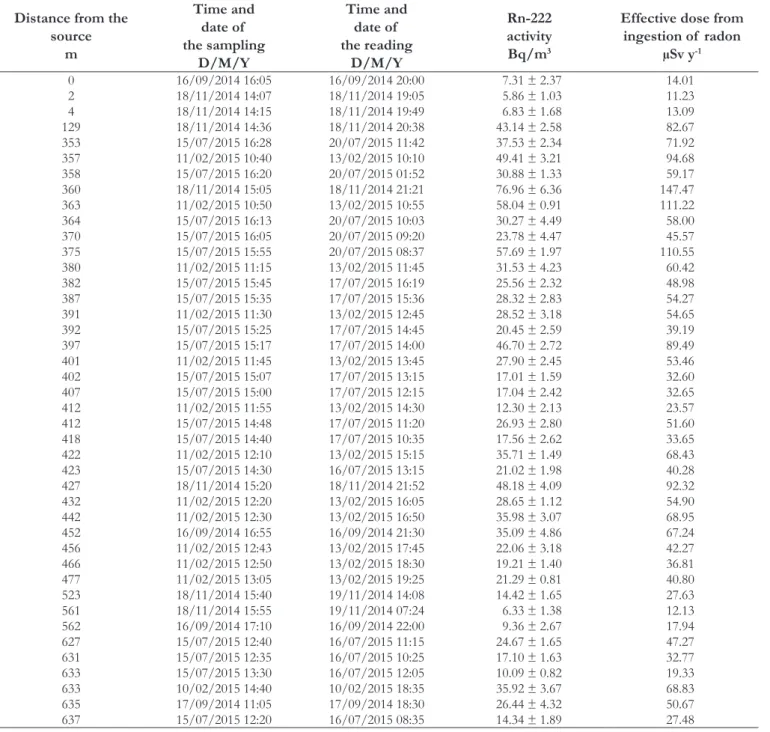
From September 2014 to May 2016, we collected 117 water samples in the Matinha stream for Rn-222 analyses. Table 2 shows the obtained results.
Using all the measurements performed during the execution of the project (24 months), we plotted the Rn-222 activity results and the distances from the source (Figures 4-6). From the figures, we can observe several peaks in radon activity along the stream course, what may indicate the location of discharge zones into the stream (SADAT-NOORI et al., 2015).
Figure 2. RAD 7.
Table 1. Determination of Ra-226 in sediment samples.
Sample Ra-226 (Bq.g-1) Sample Ra-226 (Bq.g-1)
R1 0.051 ± 0.005 R12 0.037 ± 0.003
R2 0.114 ± 0.006 R13 0.061 ± 0.004
R3 0.048 ± 0.004 R14 0.045 ± 0.004
R4 0.035 ± 0.003 R15 0.036 ± 0.003
R5 0.067 ± 0.004 R16 0.054 ± 0.003
R6 0.028 ± 0.003 R17 0.013 ± 0.002
R7 0.046 ± 0.004 R18 0.065 ± 0.005
R8 0.157 ± 0.006 R19 0.048 ± 0.004
R9 0.05 ± 0.004 R20 0.016 ± 0.002
R10 0.094 ± 0.006 R21 0.037 ± 0.003
R11 0.068 ± 0.004 R22 0.008 ± 0.004
Table 2. Results of the measurements and calculations.
Distance from the source
m
Time and date of the sampling
D/M/Y
Time and date of the reading
D/M/Y
Rn-222 activity Bq/m3
Effective dose from ingestion of radon
µSv y-1
0 16/09/2014 16:05 16/09/2014 20:00 7.31 ± 2.37 14.01
2 18/11/2014 14:07 18/11/2014 19:05 5.86 ± 1.03 11.23
4 18/11/2014 14:15 18/11/2014 19:49 6.83 ± 1.68 13.09
129 18/11/2014 14:36 18/11/2014 20:38 43.14 ± 2.58 82.67
353 15/07/2015 16:28 20/07/2015 11:42 37.53 ± 2.34 71.92
357 11/02/2015 10:40 13/02/2015 10:10 49.41 ± 3.21 94.68
358 15/07/2015 16:20 20/07/2015 01:52 30.88 ± 1.33 59.17
360 18/11/2014 15:05 18/11/2014 21:21 76.96 ± 6.36 147.47
363 11/02/2015 10:50 13/02/2015 10:55 58.04 ± 0.91 111.22
364 15/07/2015 16:13 20/07/2015 10:03 30.27 ± 4.49 58.00
370 15/07/2015 16:05 20/07/2015 09:20 23.78 ± 4.47 45.57
375 15/07/2015 15:55 20/07/2015 08:37 57.69 ± 1.97 110.55
380 11/02/2015 11:15 13/02/2015 11:45 31.53 ± 4.23 60.42
382 15/07/2015 15:45 17/07/2015 16:19 25.56 ± 2.32 48.98
387 15/07/2015 15:35 17/07/2015 15:36 28.32 ± 2.83 54.27
391 11/02/2015 11:30 13/02/2015 12:45 28.52 ± 3.18 54.65
392 15/07/2015 15:25 17/07/2015 14:45 20.45 ± 2.59 39.19
397 15/07/2015 15:17 17/07/2015 14:00 46.70 ± 2.72 89.49
401 11/02/2015 11:45 13/02/2015 13:45 27.90 ± 2.45 53.46
402 15/07/2015 15:07 17/07/2015 13:15 17.01 ± 1.59 32.60
407 15/07/2015 15:00 17/07/2015 12:15 17.04 ± 2.42 32.65
412 11/02/2015 11:55 13/02/2015 14:30 12.30 ± 2.13 23.57
412 15/07/2015 14:48 17/07/2015 11:20 26.93 ± 2.80 51.60
418 15/07/2015 14:40 17/07/2015 10:35 17.56 ± 2.62 33.65
422 11/02/2015 12:10 13/02/2015 15:15 35.71 ± 1.49 68.43
423 15/07/2015 14:30 16/07/2015 13:15 21.02 ± 1.98 40.28
427 18/11/2014 15:20 18/11/2014 21:52 48.18 ± 4.09 92.32
432 11/02/2015 12:20 13/02/2015 16:05 28.65 ± 1.12 54.90
442 11/02/2015 12:30 13/02/2015 16:50 35.98 ± 3.07 68.95
452 16/09/2014 16:55 16/09/2014 21:30 35.09 ± 4.86 67.24
456 11/02/2015 12:43 13/02/2015 17:45 22.06 ± 3.18 42.27
466 11/02/2015 12:50 13/02/2015 18:30 19.21 ± 1.40 36.81
477 11/02/2015 13:05 13/02/2015 19:25 21.29 ± 0.81 40.80
523 18/11/2014 15:40 19/11/2014 14:08 14.42 ± 1.65 27.63
561 18/11/2014 15:55 19/11/2014 07:24 6.33 ± 1.38 12.13
562 16/09/2014 17:10 16/09/2014 22:00 9.36 ± 2.67 17.94
627 15/07/2015 12:40 16/07/2015 11:15 24.67 ± 1.65 47.27
631 15/07/2015 12:35 16/07/2015 10:25 17.10 ± 1.63 32.77
633 15/07/2015 13:30 16/07/2015 12:05 10.09 ± 0.82 19.33
633 10/02/2015 14:40 10/02/2015 18:35 35.92 ± 3.67 68.83
635 17/09/2014 11:05 17/09/2014 18:30 26.44 ± 4.32 50.67
Distance from the source
m
Time and date of the sampling
D/M/Y
Time and date of the reading
D/M/Y
Rn-222 activity Bq/m3
Effective dose from ingestion of radon
µSv y-1
638 10/02/2015 14:55 10/02/2015 21:07 52.63 ± 4.92 100.85
642 15/07/2015 12:00 15/07/2015 16:07 42.19 ± 2.21 80.85
643 10/02/2015 15:06 10/02/2015 22:00 71.14 ± 5.09 136.32
643 17/09/2014 10:40 17/09/2014 19:00 33.12 ± 4.84 63.47
647 15/07/2015 11:50 15/07/2015 15:20 14.27 ± 2.14 27.34
648 10/02/2015 15:30 12/02/2015 12:45 15.80 ± 1.03 30.28
652 15/07/2015 11:40 15/07/2015 14:40 53.70 ± 1.86 102.90
654 10/02/2015 15:45 12/02/2015 17:43 20.24 ± 1.28 38.78
657 15/07/2015 11:15 15/07/2015 13:14 52.58 ± 4.16 100.76
661 10/02/2015 15:55 12/02/2015 19:25 28.81 ± 0.78 55.21
662 15/07/2015 11:00 15/07/2015 12:41 54.39 ± 2.50 104.22
667 15/07/2015 10:45 15/07/2015 11:56 12.92 ± 1.21 24.76
672 15/07/2015 10:31 15/07/2015 11:14 25.94 ± 2.04 49.71
677 15/07/2015 10:20 15/07/2015 10:22 10.50 ± 1.13 20.12
680 28/09/2015 18:10 30/09/2015 13:55 32.44 ± 2.92 62.16
694 19/11/2014 09:38 19/11/2014 15:16 52.26 ± 4.78 100.14
701 28/09/2015 18:03 30/09/2015 11:28 21.20 ± 1.50 40.62
715 28/09/2015 17:50 29/09/2015 13:35 9.89 ± 1.95 18.95
724 19/11/2014 09:45 19/11/2014 14:36 22.07 ± 1.93 42.29
735 28/09/2015 17:33 29/09/2015 11:20 5.08 ± 0.81 9.73
750 28/09/2015 17:17 29/09/2015 09:53 12.13 ± 1.17 23.24
760 28/09/2015 17:07 28/09/2015 22:04 1.63 ± 0.44 3.12
770 19/11/2014 10:11 19/11/2014 16:10 46.07 ± 3.59 88.28
773 28/09/2015 16:50 28/09/2015 19:23 4.77 ± 0.65 9.14
779 28/09/2015 16:33 28/09/2015 17:45 6.25 ± 0.52 11.98
795 28/09/2015 16:20 28/09/2015 16:20 2.93 ± 0.83 5.61
819 17/09/2014 11:20 18/09/2014 10:32 33.11 ± 4.84 63.45
858 19/11/2014 10:37 19/11/2014 16:55 16.20 ± 3.02 31.04
915 19/11/2014 10:54 19/11/2014 17:33 11.50 ± 1.27 22.04
1044 19/11/2014 11:16 19/11/2014 18:11 2.00 ± 0.32 3.83
1092 17/09/2014 11:45 18/09/2014 11:12 7.13 ± 0.55 13.66
1111 16/05/2016 17:30 18/05/2016 12:25 2.92 ± 0.98 5.60
1125 16/05/2016 17:20 18/05/2016 13:44 2.00 ± 0.63 3.83
1140 16/05/2016 17:05 18/05/2016 12:25 2.89 ± 0.80 5.54
1155 16/05/2016 16:55 18/05/2016 11:48 25.45 ± 3.55 48.77
1158 20/11/2014 09:29 20/11/2014 14:50 38.31 ± 2.94 73.41
1165 20/11/2014 09:25 20/11/2014 15:41 26.44 ± 1.78 50.67
1167 19/11/2014 15:40 19/11/2014 19:14 42.60 ± 1.68 81.63
1170 16/05/2016 16:43 18/05/2016 11:03 23.69 ± 1.86 45.40
1171 20/11/2014 09:36 20/11/2014 16:20 27.54 ± 1.91 52.77
1185 16/05/2016 16:25 17/05/2016 12:28 17.80 ± 0.90 34.11
1200 16/05/2016 16:15 17/05/2016 11:46 23.30 ± 1.60 44.65
1218 16/05/2016 16:00 17/05/2016 11:05 25.18 ± 2.30 48.25
1232 16/05/2016 15:50 17/05/2016 10:27 18.76 ± 0.89 35.95
1246 16/05/2016 15:40 17/05/2016 09:20 19.20 ± 0.43 36.79
1261 16/05/2016 15:25 17/05/2016 08:39 13.90 ± 1.13 26.64
1276 16/05/2016 15:05 16/05/2016 17:22 4.99 ± 0.74 9.56
1280 29/09/2015 09:55 05/10/2015 14:40 3.51 ± 1.30 6.73
1292 16/05/2016 14:55 16/05/2016 16:43 24.23 ± 2.32 46.43
1293 29/09/2015 09:45 05/10/2015 13:10 3.05 ± 1.23 5.84
1297 19/11/2014 16:00 19/11/2014 19:53 13.11 ± 0.53 25.12
1303 29/09/2015 09:35 05/10/2015 10:15 2.45 ± 1.40 4.69
1305 16/05/2016 14:40 16/05/2016 15:41 22.47 ± 0.65 43.06
1379 19/11/2014 16:23 19/11/2014 20:33 8.25 ± 0.78 15.81
1550 17/09/2014 12:00 18/09/2014 11:54 5.53 ± 0.67 10.60
1585 17/05/2016 11:00 18/05/2016 15:23 4.56 ± 1.51 8.74
1662 19/11/2014 17:00 19/11/2014 21:11 0.52 ± 0.31 1.00
1765 19/11/2014 17:21 19/11/2014 21:53 4.72 ± 0.53 9.04
1834 29/09/2015 15:05 02/10/2015 11:05 26.76 ± 1.76 51.28
1840 17/09/2014 12:30 18/09/2014 12:35 9.50 ± 1.38 18.20
Figure 4. Activity of Rn-222 along the stream considering the results of 2014 (September and November).
Figure 5. Activity of Rn-222 along the stream considering the results of 2015 (February and July).
Figure 6. Activity of Rn-222 along the stream considering the
final results (September/2015 and May/2016).
DISCUSSION
From a total of 117 water samples, all of the effective dose values from the ingestion of radon are much smaller than 0.1 mSv y−1. Considering that Brazil has established a national standard regulation of 1 mSv for the annual limit that an individual can receive (BRASIL, 2014), our study results show that the possible ingestion of this water represents no risk to public health. In fact, the literature indicates that spring water generally presents higher radon concentrations.
The high variability of the Rn-222 activity concentrations can be explained by their different origins and the lithology of the aquifer host rocks (LLERENA et al., 2013). Larger values are found in groundwater, based on the geology of the studied site (FONOLLOSA et al., 2016).
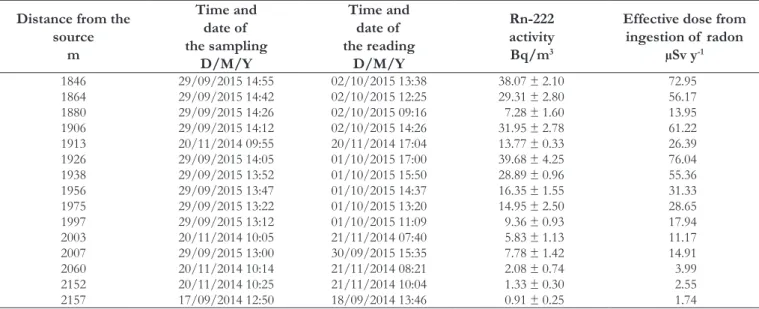
Table 3 shows that lower values of Rn-222 are usually found in surface waters (JOBBÁGY et al., 2017), (LI; WANG; LI, 2015). Distance from the
source m
Time and date of the sampling
D/M/Y
Time and date of the reading
D/M/Y
Rn-222 activity Bq/m3
Effective dose from ingestion of radon
µSv y-1
1846 29/09/2015 14:55 02/10/2015 13:38 38.07 ± 2.10 72.95
1864 29/09/2015 14:42 02/10/2015 12:25 29.31 ± 2.80 56.17
1880 29/09/2015 14:26 02/10/2015 09:16 7.28 ± 1.60 13.95
1906 29/09/2015 14:12 02/10/2015 14:26 31.95 ± 2.78 61.22
1913 20/11/2014 09:55 20/11/2014 17:04 13.77 ± 0.33 26.39
1926 29/09/2015 14:05 01/10/2015 17:00 39.68 ± 4.25 76.04
1938 29/09/2015 13:52 01/10/2015 15:50 28.89 ± 0.96 55.36
1956 29/09/2015 13:47 01/10/2015 14:37 16.35 ± 1.55 31.33
1975 29/09/2015 13:22 01/10/2015 13:20 14.95 ± 2.50 28.65
1997 29/09/2015 13:12 01/10/2015 11:09 9.36 ± 0.93 17.94
2003 20/11/2014 10:05 21/11/2014 07:40 5.83 ± 1.13 11.17
2007 29/09/2015 13:00 30/09/2015 15:35 7.78 ± 1.42 14.91
2060 20/11/2014 10:14 21/11/2014 08:21 2.08 ± 0.74 3.99
2152 20/11/2014 10:25 21/11/2014 10:04 1.33 ± 0.30 2.55
2157 17/09/2014 12:50 18/09/2014 13:46 0.91 ± 0.25 1.74
If we compare the results of this work with those from survey data of many other countries and different sources, such as wells, non-bottled mineral water, springs, and underground, surface, and drinking water, the Rn-222 activity concentrations found in the Matinha stream present no anomalous readings.
The United Nations Scientific Committee on the Effects
of Atomic Radiation (UNSCEAR, 2000) reported that, on average,
90% of the dose attributable to radon in drinking water comes
from inhalation rather than ingestion. Thus, it is much more important to control the inhalation of radon than its ingestion from drinking water. Epidemiologic studies regarding this issue have been conducted in the USA, Canada, Japan, Brazil, and Germany, among other countries (HYSTAD et al., 2014; ETANI et al., 2017; KREUZER et al., 2015; LARA et al., 2015; CORLIN et al., 2016).
In our sediment analysis, and since radon escapes from rocks surrounded by underground waters, it is likely that only the spectrometry analysis of surface sediments will fail to generate results by which we can establish a correlation with the Rn-222 activities of surface waters.
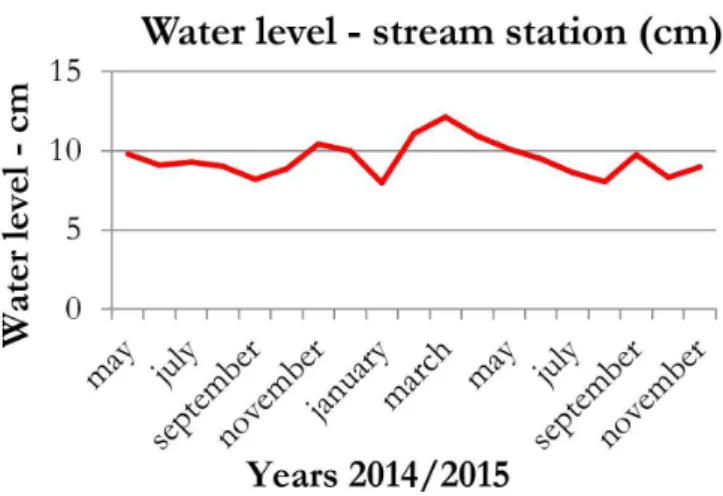
Lastly, we note that along the Matinha stream, there is a station that monitored rainfall from 2012 to 2015, under the scope of another research project. During recent years, the whole region has endured long dry seasons that have lowered the levels of almost all reservoirs. However, the water level of the stream, as monitored by a station located downstream of the study area,
has not changed significantly (Figure 7). This also indicates
the presence of discharge sections along the Matinha stream (MARTINEZ; RAIBER; COX, 2015). The use of Rn-220 as a
natural tracer could be an efficient tool for identifying the location
of these sections, since its half-life of 55 seconds is very short (CHANYOTHA et al., 2014).
CONCLUSIONS
The presence of Rn-222 in the surface waters of the Matinha stream indicates a possible connection between surface and subsurface waters. The peaks of Rn-222 along the watercourse likely indicate the presence of discharges sections.
The radon activity in the studied waters does not present a public health risk, since the effective dose values associated with its hypothetical ingestion are small. The largest Rn-222 activity value was below the limits established by national legislation. We found no anomalous readings in the obtained data.
In Brazil, further studies and analysis should be routinely conducted in underground, mineral, and drinking waters, since these have Rn-222 activity concentrations much higher than those in surface waters. Considering that the human health effects of the inhalation and ingestion of radon cannot be disregarded, this subject should also be more discussed among members of the research teams involved with hydro resources.
ACKNOWLEDGEMENTS
To FAPEMIG – Foundation of Support Research of the Minas Gerais State, for the funding of the Project. To all the colleagues that help the development of the research: Nayron Lemos, Joir Genaro, Liessi Santos, Wellington Mônico, Herculis Bernardes, Elenísio Fonseca, Geraldo Kastner, Thaís Ferraz, Virgílio Bomtempo, Paulo Rodrigues, Aline Fabiane and Pedro Dutra. Thanks also to the anonymous reviewers for their constructive comments.
REFERENCES
AKAWWI, E. Radon-222 Concentrations in Groundwater along Eastern Jordan Rift. Journal of Applied Sciences (Faisalabad), v. 14, n. 4, p. 309-316, 2014. http://dx.doi.org/10.3923/jas.2014.309.316.
ALYAZICHI, Y. M.; JONES, B. G.; MCLEAN, E. Lead isotope fingerprinting used as a tracer of lead pollution in marine sediments Table 3. Rn-222 concentration ranges in other experiments.
Source Country
Rn-222 concentration
(kBq m3)
Surface water China 0.51
Slovenia < 1
Spring and non-bottled mineral
waters
China 82
Spain 1.4 - 105
Hungary 2.11 - 120
Lithuania 1.4 - 43.7
Bulgaria 1595
Italy 1.5 - 181
Serbia 0.91 - 1463
Groundwater Spain 1 - 1000
Finland 3800
Portugal 17 - 3856
North Ireland 5.8 - 36.6
Germany 1220
Well water Norway 10 - 300
Belgium 47 - 1600
Drinking water Portugal 1.9 - 112.77
Austria 1.46 - 644
UK 0.19 - 71.1
Germany 1.3 - 1800
Serbia < 3
from Botany Bay and Port Hacking estuaries, southern Sydney, Australia. Regional Studies in Marine Science, v. 7, p. 136-141, 2016. http://dx.doi.org/10.1016/j.rsma.2016.06.006.
BEM, H.; PLOTA, U.; STANISZEWSKA, M.; BEM, E. M.; MAZUREK, D. Radon (222Rn) in underground drinking water supplies of the Southern Greater Poland Region. Journal of Radioanalytical and Nuclear Chemistry, v. 299, n. 3, p. 1307-1312, 2014. http://dx.doi.org/10.1007/s10967-013-2912-1. PMid:26224959.
BONOTTO, D. M. A radioatividade nas águas. São Paulo; Editora UNESP, 2003.
BONOTTO, D. M.; LIMA, J. L. M. Etapas analíticas para mensuração de radônio-222 e uso na avaliação da radioatividade das águas de Águas de Prata (SP). Geochimica Braziliensis, v. 10, n. 2, p. 283-295, 1997.
BRASIL. Ministério da Ciência, Tecnologia e Inovação. CNEN – Comissão Nacional de Energia Nuclear. Norma CNEN NN 3.01: Diretrizes básicas de proteção radiológica. Brasília, DF: Ministério da Ciência, Tecnologia e Inovação, 2014.
BURNETT, W. C.; PETERSON, R.; MOORE, W. S.; OLIVEIRA, J. Radon and radium isotopes as tracer of submarine groundwater discharge – Results from the Ubatuba, Brazil SGD assessment intercomparison. Estuarine, Coastal and Shelf Science, v. 76, n. 3, p. 501-511, 2008. http://dx.doi.org/10.1016/j.ecss.2007.07.027.
CHANYOTHA, S.; KRANROD, C.; BURNETT, W. C.; LANE-SMITH, D.; SIMKO, J. Prospecting for groundwater discharge in the canals of Bangkok via natural radon and thoron. Journal of Hydrology (Amsterdam), v. 519B, p. 1485-1492, 2014. http://dx.doi. org/10.1016/j.jhydrol.2014.09.014.
COLE, K.; BUFFLER, A.; CILLIERS, J. J.; GOVENDER, I.; HENG, J. Y. Y.; LIU, C.; PARKER, D. J.; SHAH, U. V.; VAN HEERDEN, M.; FAN, X. A surface coating method to modify tracers for positron emission particle tracking (PEPT) measurements of froth flotation. Powder Technology, v. 263, p. 26-30, 2014. http:// dx.doi.org/10.1016/j.powtec.2014.04.083.
CORLIN, L.; ROCK, T.; CORDOVA, J.; WOODIN, M.; DURANT, J. L.; GUTE, D. M.; INGRAM, J.; BRUGGE, D. Health effects and environmental justice concerns of exposure to uranium in drinking water. Current Environmental Health Reports, v. 3, n. 4, p. 434-442, 2016. http://dx.doi.org/10.1007/s40572-016-0114-z. PMid:27815781.
CORRÊA, J. N.; PASCHUK, S. A.; KAPPKE, J.; DENYAK, V.; SCHELIN, H. R.; CLARO, F. D.; PERNA, A. F. N.; REQUE, M.; ROCHA, Z.; SANTOS, T. O. Monitoramento da radioatividade alfa relacionada ao radônio-222 em águas de poços da região metropolitana de Curitiba (PR). Engenharia Sanitaria e Ambiental, v. 20, n. 2, p. 243-250, 2015. http://dx.doi.org/10.1590/S1413-41522015020000124599.
COSMA, C.; MOLDOVAN, M.; DICU, T.; KOVACS, T. Radon in water from Transylvania (Romania). Radiation Measurements, v. 43, n. 8, p. 1423-1428, 2008. http://dx.doi.org/10.1016/j. radmeas.2008.05.001.
COSTA, A. B.; AZEVEDO, A. E. G. Atividades de radônio-222 e
rádio-226 em águas subterrâneas de três regiões da Bahia: Camaçari, Ipirá e Caetité/Lagoa Real (antes do processamento de urânio).
Cadernos de Geociências, v. 9, n. 2, p. 125-129, 2012.
COZMA, A. I.; BACIU, C.; MOLDOVAN, M.; POP, I. C. Using natural tracers to track the groundwater flow in a mining area. Procedia Environmental Sciences, v. 32, p. 211-220, 2016. http://dx.doi. org/10.1016/j.proenv.2016.03.026.
DAVIS, S. N.; THOMPSON, G. M.; BENTLEY, H. W.; STILES, G. Ground-water tracers: a short review. Ground Water, v. 18, n. 1, p. 14-23, 1980. http://dx.doi.org/10.1111/j.1745-6584.1980. tb03366.x.
DRUMOND, M. M. A técnica de traçadores e sue potencial para ampliar
o conhecimento hidrológico sobre as bacias hidrográficas brasileiras: um estudo
aplicado a bacia representativa de Juatuba – MG. 2004. 199 p. Thesis (Doctorate in Sanitation, Environment and Hydro Resources) - Universidade Federal de Minas Gerais, Belo Horizonte, 2004.
DURRIGDE RADON INSTRUMENTATION. RAD7 Radon Manual. Revision 7.3.2. Boston: Durridge Company, 2015.
ETANI, R.; KATAOKA, T.; KANZAKI, N.; SAKODA, A.; TANAKA, H.; ISHIMORI, Y.; MITSUNOBU, F.; TAGUCHI, T.; YAMAOKA, K. Protective effects of hot spring water drinking and radon inhalation on ethanol-induced gastric mucosal injury in mice. Journal of Radiation Research, v. 58, n. 5, p. 614-625, 2017. http://dx.doi.org/10.1093/jrr/rrx021. PMid:28498931.
FERREIRA, V. V. M.; FONSECA, R. L. M.; ROCHA, Z.; OLIVEIRA, A. L.; MOREIRA, R. M.; LEMOS, N. C.; CHAGAS, C. J.; MENEZES, M. A. B. C.; SANTOS, T. O. Use of radon as water tracer at Juatuba Basin. Journal of Geography and Geology, v. 7, n. 3, p. 49-60, 2015. http://dx.doi.org/10.5539/jgg.v7n3p49.
FERREIRA, V. V. M.; SALIM, L. H.; BANDEIRA, J. V.; JUNQUEIRA, M. V.; CARVALHO, M. D.; MOTA, H. R.; BARBOSA, G. H. S. P. C. Evaluation of biological and sedimentological issues regarding a bottom discharge in the Paciência Small Hydro Power Plant – Brazil. International Journal of Sciences, v. 2, p. 70-85, 2013.
FONOLLOSA, E.; PEÑALVER, A.; BORRULL, F.; AGUILAR, C. Radon in spring waters in the south of Catalonia. Journal of Environmental Radioactivity, v. 151, n. Pt 1, p. 275-281, 2016. http:// dx.doi.org/10.1016/j.jenvrad.2015.10.019. PMid:26551586.
HUNT, R. J.; BORCHARDT, M. A.; BRADBURY, K. R. Viruses as groundwater tracers: using ecohydrology to characterize short travel times in aquifers. Ground Water, v. 52, n. 2, p. 187-193, 2014. http://dx.doi.org/10.1111/gwat.12158. PMid:24433472.
HYSTAD, P.; BRAUER, M.; DEMERS, P. A.; JOHNSON, K. C.; SETTON, E.; CERVANTES-LARIOS, A.; POPLAWSKI, K.; MCFARLANE, A.; WHITEHEAD, A.; NICOL, A. Geographic variation in radon and associated lung cancer risk in Canada. Canadian Journal of Public Health, v. 105, n. 1, p. e4-e10, 2014. http://dx.doi. org/10.17269/cjph.105.4002. PMid:24735695.
INÁCIO M., SOARES S., ALMEIDA P. Radon concentration assessment in water sources of public drinking of Covilhã’s county, Portugal. Journal of Radiation Research and Applied Sciences, v. 10, n. 2, p. 135-139, 2017.
JOBBÁGY, V.; ALTZITZOGLOU, T.; MALO, P.; TANNER, V.; HULT, M. A brief overview on radon measurements in drinking water. Journal of Environmental Radioactivity, v. 173, p. 18-24, 2017. http://dx.doi.org/10.1016/j.jenvrad.2016.09.019. PMid:27745714.
KREUZER, M.; FENSKE, N.; SCHNELZER, M.; WALSH, L. Lung cancer risk at low radon exposure rates in German uranium miners. British Journal of Cancer, v. 113, n. 9, p. 1367-1369, 2015. http://dx.doi.org/10.1038/bjc.2015.324. PMid:26393888.
LARA, E.; ROCHA, Z.; SANTOS, T. O.; RIOS, F. J.; OLIVEIRA, A. H. Soil features and indoor radon concentration prediction: radon in soil gas, pedology, permeability and 226Ra content. Radiation Protection Dosimetry, v. 167, n. 1-3, p. 126-129, 2015. http://dx.doi. org/10.1093/rpd/ncv228. PMid:25920786.
LE, C. H.; HUYNH, N. P. T.; NGUYEN, V. T.; LE, Q. B. Radon and radium concentrations in drinkable water supplies of the Thu Duc region in Ho Chi Minh City, Vietnam. Applied Radiation and Isotopes, v. 105, p. 219-224, 2015. http://dx.doi.org/10.1016/j. apradiso.2015.08.033. PMid:26334782.
LI, T.; WANG, N.; LI, S. Preliminary investigation of radon concentration in surface water and drinking water in Shenzhen City, South China. Radiation Protection Dosimetry, v. 167, n. 1-3, p. 59-64, 2015. http://dx.doi.org/10.1093/rpd/ncv207. PMid:25904699.
LLERENA, J. J.; CORTINA, D.; DURAN, I.; SORRIBAS, R. Impact of the geological substrate on the radiological content of Galician waters. Journal of Environmental Radioactivity, v. 116, p. 48-53, 2013. http://dx.doi.org/10.1016/j.jenvrad.2012.08.014. PMid:23103575.
MARTINEZ, J. L., RAIBER M., COX M. E. Assessment of groundwater–surface water interaction using long-term hydrochemical data and isotope hydrology: Headwaters of the Condamine River, Southeast Queensland, Australia. Science of The Total Environment, v. 536, n. 1, p. 499-516, 2015.
MITTAL, S.; RANI, A.; MEHRA, R. Radon levels in drinking water and soil samples of Jodhpur and Nagaur districts of Rajasthan,
India. Applied Radiation and Isotopes, v. 113, p. 53-59, 2016. http:// dx.doi.org/10.1016/j.apradiso.2016.04.017. PMid:27135605.
NASIR, T.; SHAH, M. Measurement of annual effective doses of radon from drinking water and dwellings by CR-39 track detectors in Kulachi City of Pakistan. Journal of Basic and Applied Sciences, v. 8, p. 528-536, 2012.
NIKOLOPOULOS, D.; LOUIZI, A. Study of indoor radon and radon in drinking water in Greece and Cyprus: Implications to exposure and dose. Radiation Measurements, v. 43, n. 7, p. 1305-1314, 2008. http://dx.doi.org/10.1016/j.radmeas.2008.03.043.
NRC – NATIONAL RESEARCH COUNCIL. Risk assessment of radon in drinking water. Washington, DC: National Academy Press, 1999.
OOMS, M.; CELEN, S.; KOOLE, M.; LANGLOIS, X.; SCHMIDT, M.; DE ANGELIS, M.; ANDRÉS, J. I.; VERBRUGGEN, A.; VAN LAERE, K.; BORMANS, G. Synthesis and biological evaluation of carbon-11 and fluorine-18 labeled tracers for in vivo visualization of PDE10A. Nuclear Medicine and Biology, v. 41, n. 8, p. 695-704, 2014. http://dx.doi.org/10.1016/j.nucmedbio.2014.05.138. PMid:25002365.
PINTI, D. L.; RETAILLEAU, S.; BARNETCHE, D.; MOREIRA, F.; MORITZ, A. M.; LAROCQUE, M.; GELINAS, Y.; LEFEBVRE, R.; HELIE, J. F.; VALADEZ, A. 222Rn activity in groundwater of the St. Lawrence Lowlands, Quebec, eastern Canada: relation with local geology and health hazard. Journal of Environmental Radioactivity, v. 136, p. 206-217, 2014. http://dx.doi.org/10.1016/j. jenvrad.2014.05.021. PMid:24973780.
RAVIKUMAR, P.; DAVIS, D.; MATHEW, S.; SOMASHEKAR, R. K.; PRAKASH, K. L. Spatio-temporal variation in radon concentration in groundwater with respect to rock types: A case study from Chitradurga district, Karnataka. Journal of the Geological Society of India, v. 83, n. 2, p. 156-164, 2014. http:// dx.doi.org/10.1007/s12594-014-0027-0.
SADAT-NOORI, M.; SANTOS, I. R.; SANDERS, C. J.; SANDERS, L. M.; MAHER, D. T. Groundwater discharge into an estuary using spatially distributed radon time series and radium isotopes. Journal of Hydrology (Amsterdam), v. 528, p. 703-719, 2015. http:// dx.doi.org/10.1016/j.jhydrol.2015.06.056.
SANTOS, T. O.; BONOTTO, D. M. O gás radônio em águas
subterrâneas do Aquífero Bauru na Região central do município
de São José do Rio Preto-SP. In: CONGRESSO BRASILEIRO DE GEOQUÍMICA, 13., 2011, Gramado. Anais... Gramado: CBGq, 2011.
TELAHIGUE, F.; AGOUBI, B.; SOUID, F.; KHARROUBI, A. Groundwater chemistry and radon-222 distribution in Jerba Island, Tunisia. Journal of Environmental Radioactivity, v. 182, p. 74-84, 2018. http://dx.doi.org/10.1016/j.jenvrad.2017.11.025. PMid:29202372.
TESTONI, R.; LEVIZZARI, R.; DE SALVE, M. Tracer use for the protection of water resources in nuclear sites. Energy Procedia, v. 74, p. 826-834, 2015. http://dx.doi.org/10.1016/j. egypro.2015.07.818.
TODOROVIC, N.; NIKOLOV, J.; FORKAPIC, S.; BIKIT, I.; MRDJA, D.; KRMAR, M.; VESKOVIC, M. Public exposure to radon in drinking water in SERBIA. Applied Radiation and Isotopes, v. 70, n. 3, p. 543-549, 2012. http://dx.doi.org/10.1016/j. apradiso.2011.11.045. PMid:22169679.
UNSCEAR – UNITED NATIONS SCIENTIFIC COMMITTEE ON THE EFFECTS OF ATOMIC RADIATION. Sources and Effects of Ionizing Radiation. New York; United Nations Publication, 2000.
VOLTAGGIO, M.; SPADONI, M.; CARLONI, S.; GUGLIETTA, D. 212Pb as tracer for PM deposition on urban vegetation. The Science of the Total Environment, v. 569-570, p. 9-15, 2016. http:// dx.doi.org/10.1016/j.scitotenv.2016.06.051. PMid:27323332.
WHO – World Health Organization. Guidelines for Drinking-Water Quality. Geneva: WHO Press, 2011.
WU, Y. Y.; MA, Y. Z.; CUI, H. X.; LIU, J. X.; SUN, Y. R.; SHANG, B.; SU, X. Radon concentrations in drinking water in Beijing City, China and contribution to radiation dose. International Journal of
Environmental Research and Public Health, v. 11, n. 11, p. 11121-11131, 2014. http://dx.doi.org/10.3390/ijerph111111121. PMid:25350007.
YALCIN, S.; GURLER, O.; AKAR, U. T.; INCIRCI, F.; KAYNAK, G.; GUNDOGDU, O. Measurements of radon concentration in drinking water samples from Kastamonu (Turkey). Isotopes in Environmental and Health Studies, v. 47, n. 4, p. 438-445, 2011. http:// dx.doi.org/10.1080/10256016.2011.618270. PMid:22004332.
Authors contributions
Vinícius Verna Magalhães Ferreira: Field experiments, laboratory readings, analysis and interpretation of the results, drafting of manuscript and critical revision.
Cláudio José Chagas: Field experiments, analysis and interpretation of the results.
Rubens Martins Moreira: Field experiments, analysis and interpretation of the results.
Zildete Rocha: Field experiments, laboratory readings, analysis and interpretation of the results.
Talita de Oliveira Santos: Field experiments, laboratory readings, analysis and interpretation of the results.