AN EMPIRICAL INVESTIGATION OF BRAND EQUITY: DRIVERS AND THEIR
CONSEQUENCES
Nebojsa S. Davcik
ISCTE Business School, University Institute of Lisbon (ISCTE – IUL), Lisbon, Portugal; [email protected], [email protected]
Acknowledgments: The author is very grateful to Francesco Favotto and Giacomo Boesso for their support during the early stage of research process. Comments and suggestions from Zoran Čajka are highly appreciated. Some parts of this study, in their early stage, were developed during the author’s doctorate programme at the University of Padova, Department of Economic Studies “Marco Fanno”. This research is partially funded by the PRIN 2006 of MIUR (Italian University & Research Ministry), grant #: 2006072800_003. All mistakes and misunderstandings are the author’s.
Structured Abstract:
PURPOSE
The author presents a model of the brand value drivers, measured by brand equity. The goal of this research is to identify the drivers, and determine how they influence brand equity performance in the researched industry, in order to develop a more effective brand strategy.
DESIGN/METHODOLOGY
The author studied an aggregate dataset for 739 food brands. Six predictors have been controlled for (i.e. marketing investments, price, revenue, perceived quality [organic and functional] and brand ownership), while the impact of the brand equity drivers on brand value has been estimated. The model has been formulated and estimated using a robust OLS procedure. Several data sources have been used in this study, such as market-based data from
ACNielsen, as well as information and variable constructs using data from the Bureau Van Dijk Electronic Publishing AIDA financial statements database.
FINDINGS
Results suggest that marketing investment, price, revenue, brand ownership and perceived quality are highly associated with brand equity, and consequently with a higher brand value in the food industry.
RESEARCH LIMITATIONS/IMPLICATIONS
This study has only studied one industry (food), one industry segment (enriched-food) and one country (Italy). ORIGINALITY/VALUE
The majority of marketing studies apply a single research approach and measures. This is the first study of brand equity that combines consumer, financial and marketing approaches. The model contributes to theory and practice in terms of suggesting which business drivers create brand value and what type of brand strategy a firm can apply in order to create brand value.
Keywords: brand equity, food industry, brand drivers, price, revenue, differentiation, perceived quality, panel data, OLS, organic food, functional food
Pre-print archiving statement: This is a pre-print of an article published in British Food Journal, 2013, 115(9); pp. 1342-1360. The definitive publisher-authenticated version is available online at:
http://dx.doi.org/10.1108/BFJ-01-2012-0005
Suggested citation: Davcik, N (2013), An empirical investigation of brand equity: drivers and their consequences, British Food Journal, 2013, 115(9); 1342-1360
AN EMPIRICAL INVESTIGATION OF BRAND EQUITY: DRIVERS AND
THEIR CONSEQUENCES
1. Introduction
Increasing interest in measures of marketing performance has arisen due to the necessity for marketers to justify the impact and expenditure of marketing efforts (O’Sullivan & Abela 2007; Mizik & Jacobson 2008). For instance, Mizik and Jacobson (2008, p. 15) have suggested that “the issue of quantifying the returns to marketing activities in financial terms is one of the greatest challenges facing marketing and brand managers today”. This is the case because marketers have shown a lack of accountability for marketing performance to shareholder value, which undermines marketers’ credibility (Rust et al. 2004; Mizik & Jacobson 2008) and the overall contribution of marketing activities to the firm’s performance.
The marketing performance measurement (MPM) approach represents the assessment of “the relationship between marketing activities and business performance” (Clark & Ambler 2001, p. 231; cf. O’Sullivan & Abela 2007). The underlying research problem in this study is the (in)ability to account for marketing activities and to assess brand performance (cf. O’Sullivan & Abela 2007; Rust et al. 2004; Hanssens et al. 2009). The measurement of brand equity (BEq) represents a dominant research stream in the marketing performance measurement approach (e.g. Ailawadi et al. 2003; O’Sullivan & Abela 2007, etc.). Brand equity is recognized as a key strategic business asset of a company in contemporary marketing theory and practice. Many researchers have offered different viewpoints on variables and drivers that influence and/or explain this construct. It has been discussed to a great extent in management literature and many definitions of and approaches to the brand equity concept have appeared in the last two decades (e.g. Farquhar 1989; Aaker 1991; Sriram et al. 2007; Ambler 1997, 2008). There is an overall agreement in the literature that the brand
equity approach has two major perspectives. The first is a customer-based perspective that is grounded in the market’s perception, behavioural intention and attitudes of consumers (e.g. Aaker 1991; Keller 1993; Kamakura & Russell 1993; Christodoulides & de Chernatony 2010; Sriram et al. 2007; etc.). The second is the financial-based brand equity approach, which represents the financial outcome of a company’s actions and marketing efforts in terms of enhancing the brand value (e.g. Simon & Sullivan 1993; Ailawadi et al. 2003; Sriram et al. 2007; etc.).
Ambler (2008, p. 414) has stated that measuring brand equity is the biggest obstacle in the assessment of marketing performance, because a quest “for a single performance indicator (the silver metrics) is misguided”; and there is no agreement within the academic community on a general brand equity construct. In this academic area exists a limited number of quantitative research that examines brand equity constructs which are based on solid empirical data (Atilgan et al. 2005; cf. Hanssens et al. 2009), despite numerous conceptual definitions and models of brand equity. The gap in the literature has been created because the researchers have applied only single research approaches and measures, which have prevented further conceptual and empirical developments in the field. In order to investigate this phenomenon in more detail, it is necessary to research the drivers and sources of brand equity in an industry-specific context, and to overcome the current conceptual and empirical limitations. Business drivers are processes, such as people, market forces, knowledge, etc., that affect a change or give impetus to a particular business phenomenon.
This paper serves to propose and validate the drivers that influence brand equity performance, and elucidate the manner of their influence, in order to help with the development of more effective business strategies. Variables are
described and computed for various food brands in the Italian market. The study makes several contributions to the existing body of marketing knowledge. First, existing studies apply a single research approach, such as consumer, financial, organizational, etc. The present study combines the consumer and financial approaches into one single model. Second, the current body of marketing knowledge is based on single measures, such as panel data, self-reporting data, financial-report data, etc. This study combines the national panel dataset and official financial reports from firms. Third, the present research approach is applicable to Small & Medium Enterprises (SMEs), rather than being suited only to multinational companies that are globally recognized or listed on a stock exchange. The research on brand equity metrics, applying the financial approach, is dominantly based on brand rankings, in which the value of the brand exceeds $1 billion and/or where the company is listed on a stock exchange (e.g. Simon & Sullivan 1993; Chu & Keh 2006; etc.). To the best of the researchers’ knowledge, this is the first study of brand equity that combines (i) a consumer approach, employing real consumption data, (ii) a financial approach, employing real financial data from firms’ financial reports, (iii) a marketing approach, creating a brand-based dataset that is aggregated from real life data, and (iv) an innovation approach, used as a proxy for perceived quality (e.g. Kamakura & Russell 1993; Aaker 1991; Yoo et al. 2000), studying the importance of innovation in an applied branding context. As a rare study of this kind, this article provides a solid starting point for further research about the interconnections among various drivers within the brand equity concept.
In the following section, the research framework relating to the proposed drivers and the brand equity concept is presented. Subsequently, we describe a research proposition and conceptual model, and these will be tested by conducting estimations using the brand equity model. The next section describes the collected data and provides a description of the data in this research. The results of the study are then described and interpreted, and conclusions are drawn with relation to implications
for practitioners, as well as some directions for future research in the field.
2. Research framework
2.1. Brand equity as a conceptual disarray Modern marketing theory and practice recognize brand equity as being a key business strategic asset of a company. Keller and Lehmann (2006) have argued that a brand represents its influence at three primary market levels – customer, product and financial – and that the value accrued by these markets can be called brand equity. The brand equity concept has been discussed to a great extent in marketing literature and many researchers have offered different approaches to the conceptualization and definition of brand equity (e.g. Aaker 1991; Ambler 1997; Farquhar 1989; Srinivasan et al. 2005; Sriram et al. 2007), as well as different viewpoints about the factors that influence it. The lack of consensus and generally accepted framework to support the brand equity construct has been presented in numerous measures and theoretical approaches, despite years of debate and research, and the academic debate is still intensive about the conceptual boundaries, essence and measures of brand equity. For instance, a consensus has not appeared on whether brand equity refers to the value of a brand name or the value of a brand that is marked with a brand name (Park et al. 2008). The same problem appears with regards to the creation of an appropriate theoretical and measurement approach, due to numerous research studies that have defined different, and sometimes even opposite, approaches: customer-based, product-based, financial-based, etc. (cf. Keller 1993; Ailawadi et al. 2003; Yoo et al. 2000; Salinas & Ambler 2009). There is, however, a high level of agreement in the literature about two brand equity research streams. The first uses a customer-oriented brand equity paradigm (e.g. Aaker 1991; Keller 1993). This research approach is based on the interaction between consumers and brand, as well as the consequences which yield that interrelationship. The second research approach uses a financial-oriented brand equity paradigm that is based on the
brand’s financial value (e.g. Simon & Sullivan 1993; Ailawadi et al. 2003; Chu & Keh 2006; etc.). Brand equity should be formally measured but, as mentioned above, searching for a single financial performance measure, the silver metric indicator, is a misleading approach (Ambler 2008; cf. Kamakura & Russell 1993). In contemporary marketing research practice, brands are commonly assessed by customer-oriented measures such as awareness, attitudes, behavioral intentions, etc. (Rust et al. 2004; Mizik & Jacobson 2008). These intermediate outcomes are inappropriate in many managerial and research instances because they do not convert customer value into financial value. As pointed out by Mizik & Jacobson (2008, p. 15), “mere assessment of brand attributes is insufficient”, because customer-oriented attributes must be linked to the financial value of the brand. However, financial performance measures are generally short-term oriented and do not include intangible brand assets, measured by brand equity (Rust et al. 2004; Ambler 2008); using only this type of brand performance assessment may jeopardize long-term business performance (Collins & Porras 2000). In other words, the brand measurement must include non-financial measures, such as consumer loyalty, which reflects consumer willingness to pay premium price (Ambler 2008), market share, brand awareness, purchase intentions, etc. (Keller 1993; Park & Srinivasan 1994; Lehmann & Reibstein 2006; cf. Veloutsou & McAlonan 2012).
This paper argues that brand equity has a dual role in marketing science and practice. This duality is evident i) at the micro level, where brand equity represents the value of the brand that is determined by consumers’ actions; and ii) at the macro level, where brand equity is a company asset that is driven by internal (organizational) and external (market) forces. The customer- and financial-based research streams are clearly interrelated (Ailawadi et al. 2003; Keller & Lehmann 2006), and research interconnection between two perspectives needs to be established.
2.2. Brand equity as a measure of brand value
The value of a brand is measured by brand equity. As explained above, despite decades of academic debate, no consensus has been reached regarding the boundaries and measures of brand equity (Park et al. 2008). Brand equity is a multidimensional construct (Aaker 1991) and each of its measures can have different drivers (Ailawadi et al. 2003). For instance, Kamakura & Russell (1993) have proposed a model in which the BEq measure is estimated using several situational factors such as price, perceived quality of product features and recent advertising.
This paper argues that brand equity must incorporate both research streams: consumer and financial. The first stepping-stone is based on the approach in which brand equity measurement is taken from the customer evaluation of the brand name (Aaker 1991; cf. Hoeffler & Keller 2003), which is measured by customer preference, attitude or intent to purchase. Equity is accrued when a consumer is already familiar with a brand and already has some favourability and/or strong and unique brand associations (Keller 1993). Here, this approach is partially modified by studying and proposing a quantitative brand equity framework rather than using a solely qualitative approach. Observations were conducted of purchases that were made by the consumer, e.g. consumption of existing brands in the market with well-known brand names and product characteristics (cf. ACNielsen 2008). In the present analysis, scanner data from real consumers will be used. A deductive approach will be applied, with an assumption that consumers have certain attitudes, levels of loyalty, brand awareness, and preferences; because they have the prior knowledge about the brand and are able to make consumer choices between different varieties of well-known (existing) brands (cf. Einav et al. 2010; Kamakura & Russell 1993). This hypothesis is in line with theoretical assumptions from the industrial organization, which is based on the principle that a consumer may resolve uncertainty about brand quality, price and utility only if the brand is purchased and consumed (cf. Schmalensee 1982). This consumer’s knowledge yields a utility payoff, signalling information about the value of the brand and future prices (Schmalensee 1982). There is a
general agreement in marketing literature that brand knowledge represents a set of associations in consumers’ minds regarding the brand’s features, benefits, uses, and overall attitude (e.g. Aaker 1991; Keller 1993; Broniarczyk and Gershoff 2003; Hoeffler & Keller 2003; Davcik & Rundquist 2012), and that knowledge about the brand arises as “a result of prior brand marketing activities and investments in advertising and promotion” (Broniarczyk and Gershoff 2003, p. 163).
The second stepping-stone is based on the study of Simon and Sullivan (1993) and their view on the significance of financial measurements and the importance of promotional efforts, such as advertising expenditure, patents, sales force expenditure and marketing research expenditure. Their methodology has three important features (p. 29): (i) brand equity is treated as an asset of the company, (ii) brand equity is measured in a forward-looking way (however, this study has not only focused on public companies, as theirs did, and this feature is a limitation for non-public and SME companies), and (iii) the value of a company’s brand changes as new information becomes available in the market. This information might be new brand investments, promotional activities, new advertising campaigns, etc. This methodology uses objective market-based measures (Simon & Sullivan 1993), which allows comparisons to be made as the research is being conducted during the time as well as across companies and industries. They also suggested that this technique implicitly incorporates the effect of market size and growth as well as the revenue-enhancing and cost-reducing capabilities of brand equity (Simon & Sullivan 1993; p. 30). They have justified their approach by presenting examples from the public companies studied, and investigated the market value of the firms’ securities. In their study, they researched the brand equity problem using the Coca-Cola and Pepsi brands. Unfortunately, this approach is not applicable to non-public companies or to SMEs. Another disadvantage of this approach is the assumption that there is a strong and efficient market (Salinas & Ambler 2009). Using their methodological approach as a valuable starting
point, this study modifies it to the extent that the brand equity concept is not influenced only by financial or limited marketing actions (such as advertising campaigns), but also by a comprehensive list of financial, strategic and marketing activities.
2.3. Drivers of brand equity
The literature on brand equity and its measures, constructs and antecedents is substantial, but fragmented and inconclusive (Christodoulides & de Chernatony 2010). Heterogeneity of approaches makes this field rather confusing and vague. Numerous researchers (e.g. Ailawadi et al. 2003; Aaker 1991; Temporal 2002; Keller 1993; Yoo et al. 2000) have created different brand equity constructs, however the strategic implication of brand equity is underestimated in academic literature. It is possible to generate brand value by strengthening the drivers of brand equity (Yoo et al. 2000), but there is very little research that directly or indirectly tackles this issue. In reference to this gap, Keller (1993, p. 18) has suggested that “effective strategies for integrating marketing communications in terms of advertising, promotion, publicity, direct marketing, and package design are especially needed”.
Marketing investments (MI) in a brand, measured by service expenditures that are related to the advertising, promotional activities, patents, licenses, etc., might have a long-term effect on the sales and value of a product. The spotlight is on marketing expenditures, such as marketing communications, promotions, etc., and how these expenditures influence the brand performance (Rust et al. 2004). A company can gain a lucrative position in the market if its marketing efforts in terms of its brand name are highly recognized, along with a strong reputation and effective marketing communications. This position can yield premium price and higher market share (cf. Davcik et al. 2010), but can also be understood as an entry barrier for competitors who have to overcome these well-performing incumbent companies (Chu & Keh 2006). Keller (1993, p. 9) has argued that the brand equity approach can be enhanced if a company creates a “favourable
response to pricing, distribution, advertising, and promotion activity for the brand” as well as with licensing, because it can influence positive brand image. Lagged advertising expenditures may generate returns in subsequent periods as well as potentially enhancing brand value (Simon & Sullivan 1993; Srinivasan et al. 2005; Chu & Keh 2006; Ambler 1997; Keller & Lehmann 2009; Peterson & Jeong 2010; cf. Aaker 1991). The boundary condition for consumer assessment of higher brand value is when a brand promotion is based on a high price (Kamakura & Russell 1993; Surri et al. 2002; cf. Keller & Lehmann 2009). Therefore, it is expected that a brand’s value will be higher if a company increases marketing investments in it.
Price (PR) represents the amount of money that consumers have to pay to obtain the product. More broad definitions depict price as “the sum of all the values that consumers exchange for the benefits of having or using the product or service” (Kotler & Armstrong 1999; p. 302). The research findings suggest that a higher brand value is associated with higher prices if those prices are associated with higher quality and differentiation (Sriram et al. 2007; Suri et al. 2002; Knox 2000; cf. Schmalensee 1982; Blattberg & Wisniewski 1989; Erdem et al. 2008; Erdem et al. 2010; Stiglitz 1987). Consumers may use the history of brand prices to assess the preferable price for a brand, which signals brand quality (Erdem et al. 2008; 2010). Davcik et al. (2010) have shown that investment in the brand value and marketing performance of a firm leads to premium price gains in the market. It is expected that higher price will increase the value of the brand’s equity.
Revenues (REV) represent the unit volume sold at a certain price. Ailawadi et al. (2003) have suggested that equity is influenced by sales, created by the marketing mix of company and competitors’ brands. In the model used in this research, the gross revenue variable is used, instead of the adjusted revenue variable (Ailawadi et al. 2003), because reliable data could not be obtained for the variable costs at firm level due to the proprietary characteristics of the data. Ailawadi et al. (2003) have suggested that gross revenue might be a more appropriate measure because it
depicts, in a more comprehensive way, general consumer demand rather than the company’s production costs. It is conventional expectation that increased revenue will increase the value of brand equity. However, here, brands have been studied that have an additional value in comparison to conventional food brands, and are therefore special and unique to the consumers, so that raising volume and brand availability may decrease their exclusivity. Therefore, it is expected that increased revenues due to the unit volume sold will decrease the value of brand equity.
Perceived quality (PQ) can be understood as a consumer’s subjective judgment about a product’s excellence (Zeithaml 1988; cf. Netemeyer et al. 2004). Subjective judgment of quality is based on personal product experience, unique needs and consumption situations (Ambler 1997; Yoo et al. 2000). Farquhar (1989, p. 27) has advocated that “quality is the cornerstone of a strong brand”, which leads to higher brand equity. Often, customers have no prior knowledge of product quality, and perceived quality may directly influence the purchase decision, especially when a buyer has no possibility to conduct a detailed analysis (Aaker 1991). In order to achieve a positive evaluation by the consumer, a company must create a brand that delivers “superior performance to the consumer” (Farquhar 1989; p. 27). Due to the fact that it is not possible to directly observe and measure the consumers’ assessments of perceived value, the applied innovation in the production process is used as a proxy for the perceived quality (Sriram et al. 2007; cf. Kamakura & Russell 1993; Aaker 1991; Yoo et al. 2000; Bogue & Sorenson 2009; Davcik & Rundquist 2012; cf. Sorenson & Bogue 2007). The modern food industry is based on sophisticated technological applications that allow consumers to consume high quality products over a long period of time and under different conditions. The technological aspect of consumption in the juice industry is especially important because producers can create different brand groups, such as juice drinks, nectars and 100% juices; or production technologies, such as conventional, organic and functional juices. A great array of brands in the dairy industry are based on added value, such as
beneficial bacteria, organic-based production, etc. It is expected here that brands with higher levels of innovation, such as organic and functional vs. conventional brands, will have a positive impact on brand equity.
The relevance of firm strategy and corporate culture on brand value is not well addressed in the existing literature (cf. Chu & Keh 2006). The fact that a brand is manufactured by a well-known producer might be used as a signal of brand quality. Brand awareness has been referred to in the literature (Aaker 1991; Yoo et al. 2001) as a signal of quality for the known manufacturer (brand owner). Brand awareness sustains familiarity with the brand; it is a signal of a company’s business commitment, local culture, community values, etc. Here, brand ownership (BO) has been used as a control variable, where the difference between the Italian and foreign food producers has been controlled for. Due to the strong national sentiment in food consumption, it is expected that Italian consumers will prefer Italian food brands over foreign food brands.
All brand value performance variables have been included in creating a model of estimation (e.g. Shepherd 1972):
(1) BEq = f (MI, PR, REV, pq, bo) This leads us to the following proposition:
P1: The brand equity is driven by a variety of factors, of which marketing investment in a brand, prices, revenues, perceived quality and brand ownership are most prominent.
3. Model
As has been clearly noted from previous discussions, BEq is defined in different ways, usually depending on the researchers’ approach to the problem and research goals.
The primary advantage of this approach is to allow decision makers in organizations to improve the value and competitive advantage of their brands. Though the major goal of any branding programme is to enhance the value of the brand, the second advantage might be a possible better understanding of the role of a specific driver in the
creation of brand value, which depends on different brand strategies created by firms.
In Table 1, the endogenous, exogenous and quality independent variables are presented. The endogenous variable is brand equity, which represents an asset that is constituted by research costs, patents, advertising efforts, licenses, trademarks, etc. This variable is derived from the accounting position BI, intangible assets, in the companies’ balance sheets (AIDA 2008). In order to set down this phenomenon on a brand level, the single brand share in a company brand portfolio has been calculated. In this way, we allocated brand equity from a company level to a specific (single) brand. This measurement approach allows managing and estimation of an individual brand in a multibrand firm (Park & Srinivasan 1994). (2) BEqj = BEqjk ( )
In equation 2, BEqj denotes brand j’s equity;BEqjk
represents company k’s equity from brand j; qij is
quantity sold of brand j to consumer i; and Qjk
denotes overall quantity sold of brand j from company k. The exogenous variable, marketing investments, represents expenses in advertising, promotional activities, licences, etc., which are intended to increase the quality and the reputation of the product. Due to the fact that this variable can be observed from the position of the brand, it can be understood that a firm makes this investment to improve the characteristics of the specific brand (cf. Simon & Sullivan 1993; Kamakura & Russell 1993; Srinivasan 2005). The value of this variable is observed from the accounting position B7, services, in the company’s income statement (cf. AIDA 2008). Similar to the brand equity measurement, this procedure was used to allocate marketing investments within a single brand.
(3) MIj = MIjk ( )
In equation 3, MIj denotes brand j’s marketing
investments and MIjk represents company k’s
the average brand price per kilogram, which is obtained in an observed period. Due to the possible presence of endogeneity issues between revenues and prices, variable revenue has been calculated as the brand revenue share in the company’s brand portfolio from the data obtained from AC Nielsen.
{TAKE IN TABLE 1}
Brand ownership is a quality independent variable that represents brand owners according to the qualitative values: 1 for Italian food producers and 0 for non-Italian producers in the Italian market. Perceived quality represents a type of the brand according to the mode of production, e.g. applied technology in the production of the brand. The value 1 represents conventional brands with added value, while 2 represents organic brands and 3 denotes functional brands. In order to extract information about the behaviour of applied technology, dummy variables will be used to estimate the relationships of the organic and functional brands in comparison with conventional brands. Using the ACNielsen data (ACNielsen 2008), it can be assumed that consumers are well informed about existing brands in the market and have a certain attachment to brands (cf. Einav et al. 2010).
The research instrument has been created in order to provide an estimation of the brand equity drivers, using the above-presented theoretical framework. This approach is presented in the formal econometric fashion using the model in section 3.1 (Eq. 4).
These estimations have been obtained using the Stata™ 11 SE statistical software.
3.1. Brand equity estimations
An estimate has been made of the relationships brand drivers have with brand value, as measured by brand equity. The model used here, as presented in equation 4, is estimated through standard ordinary least squares (OLS). The R-squared and adjusted R-squared values are reported to provide goodness-of-fit indicators of regression. Robust standard errors have been computed in order to
account for some eventual heteroskedasticity problems and to provide resistant estimates (cf. Zaman et al., 2001).
The basic model used at the aggregate level is: (4) Y ln (brand equityb) = c + δ1 dummy
brand ownershipb + δ2 dummy perceived
quality(organic)b + δ3 dummy perceived
quality(functional)b + β1 ln (marketing
investmentb) + β2priceb + β3revenuesb + ub
where b=1,…,B (brands). β and δ are the parameters that will be estimated. It is assumed that the variance of the error term ub, conditional
on regressors, is constant. The β coefficients measure the marginal effects of the presented independent variables on brand equity. In a similar manner, the δ coefficients measure the marginal effects of the presented quality independent variables on brand equity. The logarithmic transformation of brand equity and marketing investment was conducted because the data in the variables covers a large range of values, and use of log transformation reduces a wide range to more manageable values and thus gives more sense to the research.
3.2. Data collection
Two data sources have been used in this research. The first is market-based data from ACNielsen Italy research into the food buying patterns of 10,282 Italian households, which was collected in the period of June 2005-June 2007. The data was obtained from ACNielsen using Consumer Panel Solutions (CPS) and the Homescan® panel tool (ACNielsen 2008). The second source is data from the Bureau Van Dijk Electronic Publishing AIDA (AIDA 2008) database, which contains the financial statements of approximately 940,000 Italian companies. The framework has been expanded with the quality independent variables that have been defined and created as a combination of existing empirical data and observed quality characteristics.
This study is based on “enriched-food” brands. From the mode of production point of view, the
sample includes conventional food with added value (such as vitamins), functional, and organic food brands. This approach might be embedded into a broader category of healthy products, such as dietary, organic, functional, integrative, etc., in which each of these specific sub-groups have been characterized by a specific functional ingredient or trait (Boesso et al. 2009; cf. Mamalis 2009, Bogue & Sorenson 2009).
Data provided from the ACNielsen database were used as a panel dataset. In the empirical application, the marginal mean across time was considered in order to take into account time variability. By aggregating in this way (cf. Srinivasan et al. 2005), a sample of 91 brands in the enriched-juice segment, 350 brands in the yogurt segment, and 298 in the milk segment were obtained, which in total represents 739 brands in the enriched-food brand sample.
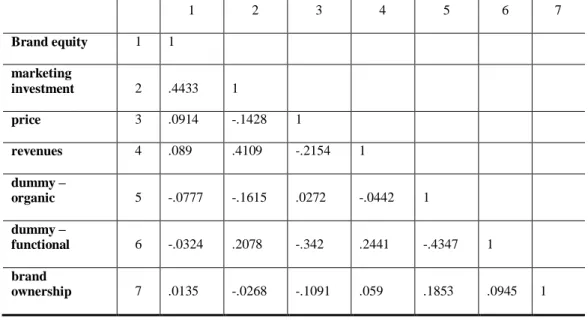
The descriptive statistics of the independent variables used with the enriched-food brand sample is presented in Table 2. All independent variables are presented with their names, mean value, standard deviation and minimum/maximum values. A correlation analysis, as presented in Table 3, reveals no major correlations among the estimated variables.
{TAKE IN TABLES 2 & 3} 4. Results
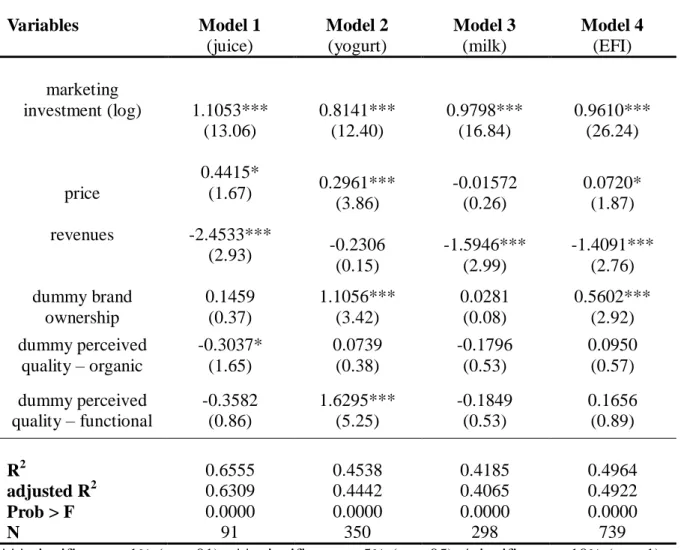
In order to assess information on brand value, brand equity is regressed on marketing investments (service expenses) in a brand, price, revenues, perceived quality and brand ownership. The benchmark model is described in a formal econometric fashion in equation 4, in section 3.1. The results of these estimations are reported in Table 4.
{TAKE IN TABLE 4}
The main question of our analysis is which, if any, of the brand equity drivers explain brand value. The results of our estimations are represented by four models, as shown in Table 4. Model 1 represents the enriched-juice sample
(N=91); model 2 represents the enriched-yogurt sample (N=350); model 3 represents the enriched-milk sample (N=298), and model 4 represents the whole enriched-food brand industry sample (N=739).
The M1 results report that variables – marketing investment in brand, price, revenues and perceived quality (organic) – have statistically significant effects on brand value. The goodness-of-fit test for the M1 shows that the adjusted R-squared value is 0.6309, and the R-R-squared value is 0.6555. For any 10% increase in marketing investment, an 11.11% increase in brand equity can be expected, and for a one-unit increase in price, about a 55.51% increase in brand equity can be expected, since exp (0.44153) = 1.5551. For a one-unit increase in revenue, we may expect an 8.60% decrease in brand equity. For brands in the juice segment, we may expect a 26.19% decrease in brand equity for the organic brands compared to the private-label brands. Other variables have negligible statistical effects.
The M2 results report that variables – marketing investment, price, brand ownership and perceived quality (functional) – have a significant statistical effect on brand value. Variables in revenue and perceived quality (organic) have no statistical effects. The adjusted R-squared value is 0.4442, and the R-squared value is 0.4538 in M2. An 8.07% increase in brand equity can be expected for any 10% increase in marketing investment. For a one-unit increase in price, a 34.46% increase in brand equity can be expected. An 80.4% decrease in brand equity can be expected for the functional brands compared to the private-label brands. A 202.1% increase in brand equity can be expected for brands that are managed by Italian food producers.
Model M3 reveals that marketing investment and revenues have a high significant effect on brand value. M3 shows that the adjusted R-squared value is 0.4065, and the R-squared value is 0.4185. For any 10% increase in marketing investment, about a 9.79% increase in brand equity can be expected. For a one-unit increase in revenue, a 20.3% decrease in brand equity can be expected.
Model M4 represents the whole enriched-food industry and the results report that all variables are
statistically significant, and that only the perceived quality has no statistical effect. The overall enriched-food industry, represented by M4, has an adjusted squared value of 0.4922, and an R-squared value of 0.4964. It can be said that for any 10% increase in marketing investment, a 9.6% increase in brand equity can be expected. For a one-unit increase in price, about a 7.5% increase in brand equity can be expected. An 8.6% decrease in brand equity can be expected for a one-unit increase in revenue. This result is anticipated because a brand with additional value can lose its exclusivity if it is sold on a massive scale. For brands that are managed by Italian companies, a 75.1% increase in brand equity can be expected, since exp (0.560195) = 1.7510, in comparison to brands that are managed by non-Italian Fast Moving Consumer Goods (FMCG) producers. This result is expected due to the strong national sentiment of Italian consumers.
All analyzed estimations have been presented in a synthesized fashion in Table 4, with relation to the research proposition P1, presented in section 3, applied to different food samples.
5. Conclusions, limitations and future research This study presents the results of an empirical analysis to determine the drivers of brand equity. Six predictors have been controlled for (i.e. marketing investments, price, revenue, perceived quality [organic and functional] and brand ownership), while the impact of the brand equity drivers on brand value has been estimated. In order to facilitate this approach, a model has been formulated and estimated using a standard and robust OLS procedure. From the standard OLS procedure, an adjusted R-squared value has been reported, while from a robust OLS procedure an R-squared value has been obtained. The model has been constructed to determine the drivers of brand value in brand strategy. In general, the estimated results showed that the conceptualized variables have an impact on brand value and that they are in line with what has been reported in the literature. The extensive literature review (e.g. Simon and Sullivan 1993; Srinivasan et al. 2005; Chu & Keh 2006; Keller & Lehmann 2009; Peterson & Jeong
2010; Suri et al. 2002; Knox 2002, etc.) has strongly suggested that marketing investment in the brand (or expenses for advertising, licenses, etc.), price, revenues, brand ownership (as a signal of quality and brand awareness) and perceived quality have all been key success drivers in developing brand value. In general, the brand model presented here strongly supports this viewpoint, as only the perceived quality (organic and functional) dummy variables have limited statistical effects.
It is conventional wisdom that firms must invest in a brand. Here, different layers of the brand concept have been presented, along with possible outcomes for managers and ways in which their actions in managing the brand might influence business strategy. The theory has a high level of concord with the idea that marketing investment in a brand is a pivotal dimension of brand value enhancement (e.g. Simon and Sullivan 1993; Srinivasan et al. 2005; Chu & Keh 2006; Keller & Lehmann 2009; Peterson & Jeong 2010; etc.). The results of this study strongly support this view. As has been presented with the brand equity model, operationalized with M1, M2, M3 and M4, marketing investment has a high statistical significance with respect to all four models. With a 10% increase in marketing investment, it is possible to expect an increase in BEq ranging from 8.07% to 11.11% in different FMCG food segments.
Revenue was identified as a potential variable that creates brand value by Ailawadi et al. (2003) and by Keller (1993), who suggested this idea indirectly in the context of favourable consumption response. The data here does support this approach, because there is evidence of statistical significance in various FMCG segments. As expected, an increase in revenue due to higher volumes sold will decrease the value of the brand. Our understanding is that this is the case because the special brands considered under the study become less unique and exclusive for consumers if they are widely available and may jeopardise existing price mechanism which will consequently have influence on brand equity. The limitation of our study is that we cannot estimate up to which point increasing availability of special, in
comparison to the conventional foods, has this effect1. The marketing and food literature in this matter is scarce and inconclusive, for instance Ailawadi et al. 2003 suggests scenarios in which revenue can have positive, positive and/or negative as well as negative sign to brand equity, and further research is needed.
The theory is in unison with suggesting that price is an important variable in the creation of brand value. Our models strongly support this view, because this variable is statistically significant in all models except M3. Our results suggest two conclusions. First, managers can use price as a tool in their managerial efforts with adjusting this variable according to the specific strategically need. Second, evidence that higher price increases the value of brand equity in the case of juice and yogurt segment means that these products have not reached saturated position in the EFI market, and managers can employ this fact to develop diverse consumers’ price approaches (price averse consumers, trade-driven consumers, etc.; cf. Krystallis & Chryssohoidis 2005; Kyriakopoulos & Oude Ophuis 1997; Calvo Dopico 2003). However, this approach would be more appealing if it were possible to show that price, as an important construct of brand equity, can achieve price premium. There are two possible approaches. The first one is related to special products, as in the sample here, where variability of data, as well as some variables in the model, is low, and studying qualitative differences (price, technology application, etc.) is a demanding task. The second approach might be related to the application of this model with more comprehensive data, which (in case of juice or the food industry) would include a wide range of the brands in the market (not only “special” ones, but also conventional, “ordinary” ones which we, as consumers, can reach more often) as well as a detailed study of distribution channels.
We have found that perceived quality is a statistically significant variable in some food segments. Due to the objective limitation of the available data, we measure perceived quality in an
1
The author is grateful to an anonymous reviewer for pointing out this mechanism.
indirect way through the dummy variables. Each of these dummy variables represents specific level of applied innovativeness, technological standards and quality, which allow us to distinguish between functional, organic and conventional plus brands. This suggests that more innovative brands are perceived by consumers as being brands that have a higher quality and are more desirable in comparison to “ordinary” brands. In the literature, this standpoint was suggested by Aaker (1991), Kamakura and Russell (1993), Temporal (2002), Calvo Dopico (2003) and Yoo et al. (2000). Zeithaml (1988) has identified perceived quality as a component of brand value and concluded that high perceived quality would lead consumers to buy the brand. If the degree of brand quality perceived by consumers is higher, it will increase the brand’s equity (e.g. Yoo et al. 2000; Chu & Keh 2006).
Researchers have not paid a lot of attention to the relevance of brand ownership and its implications for brand value. In the literature, this variable was used as a proxy for brand awareness (e.g. Aaker 1991; Yoo et al. 2000), as a certain signal of the “guaranteed” brand quality that comes with the fact that the brand is manufactured by a (well) known producer. This study has found that brand ownership has limited relevance in constructed models, because it is not significant in the juice and milk segment.
It is unlikely, if not impossible, for the single model of brand equity to satisfy all expectations of a general, or widely applicable, business model for managers or researchers (cf. Ailawadi et al. 2003). Our model contributes to theory and practice in terms of suggesting which business drivers create brand value and what type of brand strategy a firm can apply in order to create brand value. In practice, there are many different business focuses and applications in brand management. This study has presented what managers can expect in the FMCG sector, if their marketing focus is on brand value. We believe that managers can use this approach as a guide for the creation of successful brand strategy in agribusiness sector.
A clear limitation is the fact that this study has only studied one industry (food), one industry segment (enriched-food) and one country (Italy). A
limitation from the point of view of strategic decision-making is that this study cannot distinguish among a wide variety of technological issues, such as value-added characteristics, mode of production, possible target market, etc. The approach and data used here have allowed us only indirectly to observe consumer attitudes and choices, excluding cognitive or behavioural aspects of the market.
It would be valuable to expand this model to a wider sector (e.g. the conventional food industry) in order to obtain data that is more comprehensive. Otherwise, there might be a limited knowledge on the brand equity phenomenon and its constructs.
A valuable extension of this approach would be a study of the importance of distribution channels and how the brand equity concept would fit into the different distribution channels. Because this study has focused on “special” products, it would be important to study creation and change of BEq through the distribution channels.
In a logical continuation of this approach, a certain (necessary) enhancement must be a deeper study of the researched industry from the consumer point of view. That research should test the theoretical frameworks suggested by Aaker (1991) and Keller (1993), as well as to depict the qualitative side of the research problem. There are a few open questions, tackled by Aaker (1991), that do not have adequate responses in academic literature, nor in this model, such as switching cost, trade leverage, market share possibilities, etc. In other words, the future research should enlighten the problem of consumer response and market performance considered in our model.
References:
Aaker, David. A. (1991). Managing Brand Equity. New York, NY: The Free Press
Aaker, David. A., Kumar, V. and Day, G. (2004). Marketing Research, 8th ed. New York, NY: John Wiley & Sons
AC Nielsen (2008), last update: N/A, “Consumer Panel Solutions (CPS)”, online. Available:
http://www2.acnielsen.com/products/cps.shtml (accessed 2009, November 11)
AIDA (2008), last update: N/A, “Bureau Van Dijk Electronic Publishing AIDA financial statements database”, online. Available:
https://aida.bvdep.com/ (accessed 2009, December 20)
Ailawadi, K., Lehmann, D. and Neslin, S. (2003), “Revenue Premium as an Outcome Measure of Brand Equity”, Journal of Marketing, Vol. 67 (October), pp. 1-17
Ambler, Tim (1997), “How much of brand equity is explained by trust?”, Management Decision, Vol. 35 (4), pp. 283-292
Ambler, Tim (2008). Marketing metrics, In: Michael J. Baker and Susan J. Hart, (Ed.), The Marketing Book, 6th edition, Oxford: Butterworth-Heinemann
Ambler, Tim, C.B. Bhattacharya, Julie Edell, Kevin Lane Keller, Katherine N. Lemon and Vikas Mittal (2002), “Relating Brand and Customer Perspectives on Marketing Management”, Journal of Service Research, Vol. 5 (1), pp. 13-25
Atilgan, E., Safak A. and Serkan A. (2005), “Determinants of the brand equity: A
verification approach in the beverage industry in Turkey”, Marketing Intelligence & Planning, Vol. 23 (3), pp. 237-248
Blattberg, Robert C. and Kenneth J. Wisniewski (1989), “Price-Induced Patterns of Competition”, Marketing Science, Vol. 8 (4), pp. 291-309 Boesso, Giacomo, Nebojsa St. Davcik and Francesco
Favotto (2009), “Health-enhancing Products in the Italian Food Industry: Multinationals and SMEs Competing on Yogurt”, Journal of Agrobiotechnology Management and Economics, Vol. 12 (2), pp. 155-166
Bogue, Joe and Douglas Sorenson (2009), “Managing Customer Knowledge During the Concept Development Stage of the New Food Product Development Process”, Journal of
International Food & Agribusiness Marketing; Vol. 21 (2-3), pp. 149 - 165
Broniarczyk, S. M. and Gershoff, A. D. (2003), “The Reciprocal Effects of Brand Equity and Trivial Attributes”, Journal of Marketing Research, Vol. XL (May), pp. 161-175
Calvo Dopico, Domingo (2003), “Analysis of Brand Equity Supplied by Appellations of Origin”, Journal of International Food & Agribusiness Marketing, Vol. 14, No. 3, pp. 21-34
Christodoulides, George and Leslie de Chernatony (2010), “Consumer-based brand equity
conceptualization and measurement: A literature review”, International Journal of Market Research, Vol. 52 (1), pp. 43-66
Chu, Singfat and Hean Tat Keh (2006), “Brand value creation: Analysis of the Interbrand – Business Week brand value rankings”, Marketing Letters, Vol. 17(4), pp. 323-331
Clark, Bruce H. and Tim Ambler (2001), “Marketing Performance Measurement: Evolution of Research and Practice”, International Journal of Business Performance Management, Vol. 3 (Winter), pp. 231-244
Collins, J.C. and Porras, J.I. (2000). Built to last: Successful Habits of Visionary Companies, 3rd ed., London: Random House
Davcik, Nebojsa St., Boesso Giacomo and Favotto Francesco (2010). Does Branding Drive Price Differentiation? Functional, Organic & Wellness Food in Italy. In: George Christodoulides et al., (Eds.), Contemporary Issues in Brand Research (293-305). Athens: ATINER
Davcik, Nebojsa St. and Jonas Rundquist (2012), “An exploratory study of brand success: Evidence from the food industry”, Journal of International Food and Agribusiness Marketing, Vol. 24 (1), pp. 91-109; DOI:
10.1080/08974438.2012.645747
Einav, Liran, Ephraim Leibtag and Aviv Nevo (2010), “Recording discrepancies in Nielsen Homescan data: Are they present and do they matter”, Quantitative Marketing and Economics, Vol. 8 (2), pp. 207-239
Erdem, Tulin, Michael L. Katz and Baohong Sun (2010), “A simple test for distinguishing between internal reference price theories”, Quantitative Marketing and Economics, Vol. 8 (3), pp. 303-332
Erdem, Tulin, Keane, M. and Sun, B. (2008), “A dynamic model of brand choice when price and advertising signal product quality”. Marketing Science, Vol. 27(6), pp. 1111-1125
Erdem, Tulin and Joffre Swait (1998), “Brand Equity As a Signaling Phenomenon”, Journal of Consumer Psychology, Vol. 7(2), pp. 131-158
Erdem, Tulin, Joffre Swait, Susan Broniarczyk, Dipankar Chakravarti, Jean-Noel Kapferer, Michael Keane, John Roberts, Jan-Benedict Steenkamp and Florian Zettelmeyer (1999), “Brand Equity, Consumer Learning and Choice”, Marketing Letters, Vol. 10 (3), pp. 301-318
Farquhar, Peter H. (1989), “Managing Brand Equity”, Marketing Research, Vol. 1 (September), pp. 24-33
Hanssens, Dominique M., Roland T. Rust and Rajendra K. Srivastava (2009), “Marketing Strategy and Wall Street: Nailing Down Marketing’s Impact”, Journal of Marketing, Vol. 73 (November), pp. 115-118
Hoeffler, Steve and Kevin Lane Keller (2003), “The marketing advantages of strong brands”, The Journal of Brand Management, Vol. 10(6), pp. 421-445
Kamakura, Wagner A. and Gary J. Russell (1993), “Measuring brand value with scanner data”, International Journal of Research in Marketing, Vol. 10(1), pp. 9-22
Keller, Kevin L. (1993), “Conceptualizing, Measuring, and Managing Customer-Based Brand Equity”, Journal of Marketing, Vol. 57 (January), pp. 1-22
Keller, Kevin L. and Donald R. Lehmann (2006). Brands and Branding: Research Findings and Future Priorities. Marketing Science, 25 (Nov.-Dec.), 740-759
Keller, Kevin L. and Donald R. Lehmann (2009), “Assessing long-term brand potential”, Journal of Brand Management, Vol. 17 (1), pp. 6-17 Kotler, Philip (1999) Marketing Management; The
Millennium Edition. New Jersey: Prentice Hall International
Kotler, Philip and Armstrong, G. (1999), Principles of Marketing; 8th edition, New Jersey: Prentice Hall International
Krystallis, Athanasios and George Chryssohoidis (2005), “Consumers’ willingness to pay for organic food: Factors that affect it and variation per organic product type”, British Food Journal, Vol. 107, No. 5, pp. 320-343
Knox, Simon (2000). Branding and positioning. In Marketing Management: A Relationship Marketing Perspective by Cranfield School of Management, London: MacMillan Press Ltd.
Kyriakopoulos, Kyriakos and Peter A.M. Oude Ophuis (1997), “A Pre-Purchase Model of Consumer Choice for Biological Foodstuff”, Journal of International Food & Agribusiness Marketing, Vol. 8, No. 4, pp. 37-53
Lehmann, D.R. and Reibstein, D.J. (2006), “Marketing Metrics and Financial Performance”, Marketing Science Institute, Cambridge, Mass.
Mamalis, Spyridon (2009), “Critical Success Factors of the Food Service Industry”, Journal of
International Food & Agribusiness Marketing. Vol. 21 (2-3), pp. 191-206, doi:
10.1080/08974430802589709
Mizik, Natalie and Robert Jacobson (2008), “The Financial Value Impact of Perceptual Brand Attributes”, Journal of Marketing Research, Vol. XLV (February), pp. 15-32
Netemeyer, Richard G., Balaji Krishnan, Cris Pulig, Guangping Wang, Mehmet Yagci, Dwane Dean, Joe Ricks and Ferdinand Wirth (2004),
“Developing and validating measures of facets of customer-based brand equity”, Journal of Business Research, Vol. 57, pp. 209-224 O’Sullivan, Don and Andrew V. Abela (2007),
“Marketing Performance Measurement Ability and Firm Performance”, Journal of Marketing, Vol. 71 (April), pp. 79-93
Park, C. S. and Srinivasan, V. (1994). A Survey-Based Method for Measuring and Understanding Brand Equity and Its Extendibility. Journal of
Marketing Research, XXXI (May), 271-288 Park, C. Whan, Deborah J. MacInnis and Joseph
Priester (2008), “Brand attachment and a strategic brand exemplar”. In Schmitt, Bernd H. and David L. Rogers (Eds.), Handbook on Brand and Experience Management, Cheltenham, UK: Edward Elgar Pub
Peterson, Robert A. and Jaeseok Jeong (2010), “Exploring the impact of advertising and R&D expenditures on corporate brand value and firm-level financial performance”, Journal of the Academy of Marketing Science, Vol. 38 (6), pp. 677-690
Raggio, R. D. and Leone, R. P. (2007), “The theoretical separation of brand equity and brand value: Managerial implications for strategic planning”, Journal of Brand Management, Vol. 14 (5), pp. 380-395
Raggio, R. D. and Leone, R. P. (2009), “Chasing brand value: Fully leveraging brand equity to maximise
brand value”, Journal of Brand Management, Vol. 16 (1), pp. 248-263
Rust, Roland T., Tim Ambler, Gregory S. Carpenter, V. Kumar and Rajendra K. Srivastava (2004), “Measuring Marketing Productivity: Current Knowledge and Future Directions”, Journal of Marketing, Vol. 68 (October), pp. 76-89 Salinas, Gabriela and Tim Ambler (2009), “A
taxonomy of brand valuation practice:
Methodologies and purposes”, Journal of Brand Management. Vol. 17 (1), pp. 39-61
Schmalensee, Richard (1982), “Product Differentiation Advantages of Pioneering Brands”, The American Economic Review, Vol. 72(3), pp. 349-365
Shepherd, William G. (1972), “The Elements of Market Structure”, Review of Economics and Statistics, Vol. 54 (February), pp. 25-37
Simon, C. J. and Sullivan, M. W. (1993), “The Measurement and Determinants of Brand Equity: A Financial Approach”, Marketing Science, Vol. 12 (1), pp. 28-52
Sorenson, Douglas and Joe Bogue (2007), “Concept Optimisation in Innovation Through Conjoint Analysis”, Journal of International Food & Agribusiness Marketing, Vol. 19(2-3), pp. 53-75; doi: 10.1300/J047v19n02_04
Sriram, S., Subramanian, B. and Manohar, U. K. (2007), “Monitoring the Dynamics of Brand Equity Using Store-Level Data”, Journal of Marketing, Vol. 71 (April), pp. 61-78 Srinivasan, V., Chan Su Park and Dae Ryun Chang
(2005), “An Approach to the Measurement, Analysis, and Prediction of Brand Equity and Its Sources”, Management Science, Vol. 51(9), pp. 1433-1448
Stiglitz, Joseph E. (1987), “The cause and consequences of the dependence of quality on price”, Journal of Economic Literature, Vol. 25 (1), pp. 1-48 Suri, Rajneesh, Rajesh V. Manchanda and Chiranjeev
S. Kohli (2002), “Comparing fixed price and discounted price strategies: the role of affect on evaluations”, Journal of Product & Brand Management, Vol. 11 (3), pp. 160-173 Temporal, P. (2002). Advanced Brand Management:
From Vision to Valuation. Singapore: John Wiley & Sons
Veloutsou, Cleopatra and Alan McAlonan (2012), “Loyalty and or disloyalty to a search engine: the
case of young Millenials”, Journal of Consumer Marketing, Vol. 29 (2), pp. 125-135
Yoo, B., Donthu, N. and Lee, S. (2000), “An Examination of Selected Marketing Mix Elements and Brand Equity”, Journal of the Academy of Marketing Science, Vol. 28 (2), pp. 195-211
Zaman, Asad, Peter J. Rousseeuw, Mehmet Orhan (2001), “Econometric applications of high-breakdown robust regression techniques”, Economics Letters, Vol. 71(1), pp. 1-8 Zeithaml, V. A. (1998), “Consumer Perceptions of
Price, Quality, and Value: A Means-End Model and Synthesis of Evidence”, Journal of
Marketing, Vol. 52 (July), pp. 2-22
Tables
Table 1: Drivers of the Brand equity model
Variable Name Value Description Data
source
Brand equity BEq n/l
BEq value represents asset that is constituted by research costs, patents, advertising efforts, licenses, etc. (position
B. I – intangible assets in the company Balance sheets ) allocated on a brand
CFS
Marketing investments in
brand
MI n/l
MI in brand represent service expenses that are intended to increase the quality and the reputation of the brand (position
b7- services, in the company income statement) allocated on a brand
CFS
Price PR n/l
price represents paid amount of money for
a product by consumers Nielsen
Revenue share REV n/l
revenue share represents share of brand
revenue in the sample AR
(Nielsen)
Perceived
quality pq 1,2,3
perceived quality represents a type of the brand according to the mode of production, 1 – conventional with added
value, 2 – organic and 3 - functional
QIV (Nielsen)
Brand
ownership bo 0, 1
brand ownership represent difference among brands owned by Italian food producers (=1) and brands owned by international producers that have branches
in Italy (=0)
QIV (Nielsen)
Legend: AR – Author’s research, CFS – Company financial statements (balance sheet data and/or income
Table 2: Descriptive statistics
Variables
Descriptive statistics
mean standarddeviation min values max values
brand equity
2.470.000 18.400.000 488.833 268.000.000marketing investment
2.650.000 6.750.000 2.575,49 85.600.000
revenues
0,088 0,169 0,001 1price
3,952 1,985 0,202 11,91dummy perceived quality -
conventional
0,394 0,489 0 1dummy perceived quality -
organic
0,298 0,458 0 1dummy perceived quality -
functional
0,308 0,462 0 1brand ownership
0,724 0,447 0 1Table 3 – Correlation values
1 2 3 4 5 6 7 Brand equity 1 1 marketing investment 2 .4433 1 price 3 .0914 -.1428 1 revenues 4 .089 .4109 -.2154 1 dummy – organic 5 -.0777 -.1615 .0272 -.0442 1 dummy – functional 6 -.0324 .2078 -.342 .2441 -.4347 1 brand ownership 7 .0135 -.0268 -.1091 .059 .1853 .0945 1