1 This article was published Biofouling, 30, 535-546, 2014
1
http://dx.doi.org/10.1080/08927014.2014.890713 2
3 4
96-well microtiter plates for biofouling simulation in biomedical settings 5
6
LC Gomes1, JMR Moreira1, JS Teodósio1, JDP Araújo2, JM Miranda2, M Simões1, LF Melo1, FJ 7
Mergulhão1 8
1 LEPABE – Department of Chemical Engineering, Faculty of Engineering, University of Porto, Rua Dr. 9
Roberto Frias, Porto, Portugal 10
2 CEFT – Department of Chemical Engineering, Faculty of Engineering, University of Porto, Rua Dr. 11
Roberto Frias, Porto, Portugal 12 13 14 15 16 17
Corresponding author: Filipe J. M. Mergulhão, Department of Chemical Engineering, Faculty of 18
Engineering University of Porto, Rua Dr. Roberto Frias, 4200-465 Porto, Portugal. Phone: (+351) 19
225081668. Fax: (+351) 5081449. E-mail: [email protected]. 20 21 22 WORD COUNT 23 Text: 5802 words 24 References: 2062 words 25 Figures: 583 words 26 Tables: 12 words 27 TOTAL: 6397 words 28
2 Abstract
29
Microtiter plates with 96 wells are routinely used in biofilm research mainly because they 30
enable high-throughput assays. These platforms are used in a variety of conditions 31
ranging from static to dynamic operation using different shaking frequencies and orbital 32
diameters. The main goals of this work were to assess the influence of nutrient 33
concentration and flow conditions on Escherichia coli biofilm formation in microtiter 34
plates and to define the operational conditions to be used in order to simulate relevant 35
biomedical scenarios. Assays were performed in static mode and in incubators with 36
distinct orbital diameters using different concentrations of glucose, peptone and yeast 37
extract. Computational fluid dynamics (CFD) was used to simulate the flow inside the 38
wells for shaking frequencies ranging from 50 to 200 rpm and orbital diameters from 25 39
to 100 mm. Higher glucose concentrations enhanced E. coli adhesion in the first 24 hours, 40
but variation of peptone and yeast extract concentration had no significant impact on 41
biofilm formation. Numerical simulations indicate that 96-well microtiter plates can be 42
used to simulate a variety of biomedical scenarios if the operating conditions are carefully 43
set. 44
45
Keywords: Biofilm, Escherichia coli, microtiter plate, nutrient concentration, 46
computational fluid dynamics, shear strain rate 47
48
Introduction 49
Biofilms are responsible for many persistent and chronic bacterial infections in humans 50
(Hancock et al. 2007). Virtually all medical implants are prone to colonization by bacteria 51
and these biofilms often serve as a source of recurrent infections (Hancock et al. 2007). 52
About 60-70% of the hospital acquired infections are associated with some type of 53
3 implanted medical device (Bryers 2008) and urinary catheter infection is the most 54
common implant-related infection (Weinstein & Darouiche 2001). Pathogenic strains of 55
the Gram-negative bacterium Escherichia coli are responsible for 70 to 95% of urinary 56
tract infections (UTI), notably in catheterized patients (Dorel et al. 2006, Jacobsen et al. 57
2008). In fact, more than 30 million urinary catheters are inserted per year in the United 58
States alone and the infection rate is between 10-30% (Schinabeck & Ghannoum 2006). 59
The annual cost of caring for patients with catheter-associated UTIs is around $2 billion 60
(Foxman 2002). 61
Biofilm establishment and development are dynamic and complex processes regulated by 62
intrinsic biological properties and also by many environmental conditions (Donlan 2002). 63
It is known that hydrodynamics influence biofilm formation (Liu & Tay 2002, Stoodley 64
et al. 2001, Wäsche et al. 2002), not only in terms of nutrient and oxygen supply (Moreira 65
et al. 2013a), but also by the shear forces, which can modulate microbial cell adhesion to 66
a given surface (Busscher & van der Mei 2006, Simões et al. 2007, Teodósio et al. 2013, 67
van Loosdrecht et al. 1995). One of the key parameters affecting cell adhesion to a surface 68
is the shear rate at that surface (Busscher & van der Mei 2006, Teodósio et al. 2013). 69
Table 1 lists commonly found shear strain rates in biomedical and miscellaneous settings 70
where bacterial adhesion can occur. In medical devices, molecules and microorganisms 71
are constantly exposed to shear conditions caused by liquid flow (Fux et al. 2004, 72
Mukherjee et al. 2009). Urinary catheters and the human urinary tract are submitted to 73
significant hydrodynamic shear forces (adult humans produce 1-2 liters of urine per day, 74
which is expelled at average flow rates of 40-80 ml h-1) (Vejborg & Klemm 2008), but
75
adherence to surfaces enables E. coli to resist removal by urine flow and establish 76
infection (Hancock et al. 2007, Ulett et al. 2007). Besides the hydrodynamic conditions, 77
the nutrient/substrate concentration can have impact on biofilm growth, development and 78
4 detachment behavior (Rochex & Lebeault 2007, Stoodley et al. 2001, Telgmann et al. 79
2004). 80
Microtiter plates are often used for biofilm studies because small media volumes are 81
needed (Coenye & Nelis 2010), replicate tests are easily prepared using multi-channel 82
pipettors (Duetz 2007), and this closed (batch reactor-like) system lends itself to protocols 83
where different media compositions are simultaneously tested (Coenye & Nelis 2010). 84
The main goals of this work were to assess the influence of nutrient concentration and 85
flow conditions on Escherichia coli biofilm formation in 96-well microtiter plates and to 86
verify if the hydrodynamic conditions that can be attained with these systems are similar 87
to those normally encountered in diverse biomedical scenarios. A good comprehension 88
of the hydrodynamics that are found in the areas where biofilms naturally occur is crucial 89
for biofilm studies performed in laboratory-based devices. This enables the correct setting 90
of operational conditions in the lab in order to obtain biofilms that resemble those found 91
in natural environments. 92
93
Materials and Methods 94
Numerical simulations
95
Numerical simulations were made in Ansys Fluent CFD package (version 13.0). A 96
cylindrical well (diameter of 6.6 mm and height of 11.7 mm) was built in Design Modeller 97
13.0 and discretized into a grid of 18,876 hexahedral cells by Meshing 13.0. A grid 98
independence analysis was performed and the results show that reducing the cell 99
dimensions by half in all directions (corresponding to an 8 fold reduction of the cell 100
volume) has a negligible effect (about 7.7%) when compared to the uncertainty associated 101
with the biological data obtained in the experimental part of this work (see Supplementary 102
material, Table S1). For each simulation, the volume of the liquid phase inside the well 103
5 was set to 200 µL and the remaining volume was filled with gas. The properties of water 104
and air at 30 ºC were used for the liquid and gas phases, respectively (see Supplementary 105
material, Table S2). The surface tension was set equal to the surface tension of an 106
air/water system. 107
The volume of fluid (VOF) methodology (Hirt & Nichols 1981) was used to track the 108
liquid/gas interface and the precise locations of the interface were obtained by the Geo-109
Reconstruct method (Youngs 1982). The velocity-pressure coupled equations were 110
solved by the PISO algorithm, the QUICK scheme was used for the discretization of the 111
momentum equations and the PRESTO! scheme was chosen for pressure discretization. 112
In Ansys Fluent, the surface tension effects were modeled by the continuum surface force 113
(Brackbill et al. 1992), which were introduced through a source term in the momentum 114
equation. An accelerating reference frame was adopted, and the circular orbital motion 115
was taken into account by introducing another source term that represents the effect of 116
the force into the fluid resulting from this orbital motion. The no slip boundary condition 117
and a contact angle of 83º were considered for all the walls (Simões et al. 2010a). 118
Simulations were made for different shaking frequencies (50 to 200 rpm) and orbital 119
diameters (25 to 100 mm). For each case, 5 s of physical time were simulated with a fixed 120
time step of 2.5×10⁻⁴ s. The primary numerical results were the instantaneous velocity
121
components, the instantaneous pressure and the liquid or gas phase volume fractions. 122
These results were used to determine the shear rate, the location of the interface and the 123
air-liquid interfacial area. The magnitude of the shear strain rate was determined by Ansys 124
Fluent with the help of a built-in expression. For each simulation, after the steady state is 125
reached, the average shear strain rate was calculated by integrating an instantaneous 126
solution over the wetted area. The time averaged shear strain rate was obtained by 127
averaging the steady state shear rate of the liquid side during a complete orbit. 128
6 129
Bacterial strain
130
Escherichia coli JM109(DE3) from Promega (USA) was used for biofilm formation. Its
131
genotype is endA1, recA1, gyrA96, thi, hsdR17 (rk-, mk+), relA1, supE44, λ-,
Δ(lac-132
proAB), [F’,traD36, proAB, lacIqZΔM15], λ(DE3). E. coli CECT 434 (ATCC 25922), a
133
clinical isolate often used for antimicrobial susceptibility tests, was also used for 134
confirmation of the results in selected conditions. An overnight culture of E. coli was 135
prepared as described by Teodósio et al. (2011b). Cells were harvested by centrifugation 136
and appropriate dilutions in sterile saline (NaCl 0.85%) were performed to obtain an 137
optical density (OD) of approximately 0.4 at 610 nm. 138
139
Culture conditions and biofilm quantitation
140
Different media formulations were assayed using a reference medium recipe that had 141
already been tested for biofilm formation in a flow cell with the same strain (Teodósio et 142
al. 2011b). This reference medium consisted of 0.5 g l-1 glucose, 0.25 g l-1 peptone, 0.125
143
g l-1 yeast extract and phosphate buffer (0.188 g l-1 KH
2PO4 and 0.26 g l-1 Na2HPO4), pH
144
7.0. A glucose concentration of 0.15 g l-1 was also tested in that study and it was shown
145
that there were no significant changes in the amount of biofilm formed (Teodósio et al. 146
2011b). On that work, when the glucose concentration was reduced to 0.15 g l-1, the
147
peptone and yeast concentrations were also reduced to 0.07 and 0.03 g l-1, respectively.
148
Since preliminary results (Moreira et al. 2013b) had shown that glucose concentration has 149
a significant impact on the amount of biofilm formed in microtiter plates (concentrations 150
of 0.25 and 1 g l-1 were assayed), an intermediate concentration (0.5 g l-1) was also tested.
151
Additionally, since it was shown that in turbulent flow conditions higher nutrient loads 152
generally yield thicker biofilms (Teodósio et al. 2011a), the effect of increasing the 153
7 peptone and yeast extract concentrations independently was assessed starting from their 154
reference values of 0.25 and 0.125 g l-1, respectively. Thus a concentration range of 0.25,
155
0.5 and 1 g l-1 was used for glucose and peptone, whereas for yeast extract concentrations
156
of 0.125, 0.5 and 1 g l-1 were tested.
157
For each formulation, the reference culture medium (Teodósio et al. 2011b) was prepared 158
without the compound under study and then the appropriate volume of a concentrated 159
solution of that nutrient was added to obtain the desired concentration. 96-well 160
polystyrene microtiter plates were inoculated as described by Moreira et al. (2013b) and 161
incubated at 30 ºC in two separate orbital incubators operating at the same shaking 162
frequency (150 rpm). One of the incubators had a 50 mm orbital shaking diameter 163
(CERTOMAT® BS-1, Sartorius AG, Germany) and another had a 25 mm shaking 164
diameter (AGITORB 200, Aralab, Portugal). An additional set of experiments was 165
performed with no shaking (0 rpm) at 30 ºC. This temperature was chosen because in 166
previous works this particular E. coli strain was proven to be a good biofilm producer at 167
30 ºC (Teodósio et al. 2012). Biofilm formation was monitored for 60 h with plates being 168
removed from the incubators every 12 h for biofilm quantification (for time zero the plates 169
were not incubated at all). Three independent experiments were performed for each 170
shaking condition. For control, quantifications were also conducted in the absence of 171
bacteria, demonstrating that no biofilm growth occurred in the correspondent wells during 172
the experimental time. 173
Biofilm quantitation by crystal violet (CV) assay was performed as described by Moreira 174
et al. (2013b). The OD was measured at 570 nm using a microtiter plate reader 175
(SpectraMax M2E, Molecular Devices) and the biofilm amount was expressed as OD570
176
nm values. In order to confirm the results obtained by the CV method, biofilm quantitation
177
in selected conditions was also performed using viable plate counting (see Supplementary 178
8 material, Figure S1), as described by Simões et al. (2005). Both methods showed good 179
correlation (r2=0.988) as previously reported by Alnnasouri et al. (2011) and Sonak &
180
Bhosle (1995). 181
182
Scanning electron microscopy (SEM)
183
Microtiter plate wells containing biofilms were observed by SEM after 24 h of incubation 184
using the reference medium defined by Teodósio et al. (2011b). Prior to SEM 185
observations, biofilm samples were prepared as reported by Ganderton et al. (1992) and 186
wall sections were cut out and sputter-coated as described by Simões et al. (2007). SEM 187
observations were carried out using SEM/EDS (FEI Quanta 400FEG ESEM/EDAX 188
Genesis X4M). 189
190
Calculations and statistical analysis
191
The results presented in Figure 5 are an average of those obtained in three independent 192
experiments for each shaking condition (50 and 25 mm orbital shaking diameter at 150 193
rpm and no shaking). For a single experiment, the final value is an average of the readings 194
obtained in 6 replica wells within one plate. The following standard deviations (SDs) 195
were obtained for the glucose experiments, 34%, 22% and 27% (50 mm, 25 mm and no 196
shaking, respectively). For peptone 36%, 25% and 22%, and for yeast extract 19%, 25% 197
and 26% (in the same order). 198
With the aim of ascertaining the statistical significance, data was analysed using IBM 199
SPSS Statistics software version 19.0. The parametric Post Hoc Multiple Comparisons 200
Tests – Tukey and LSD – were used based on a confidence level of 95% (differences 201
reported as significant for P values < 0.05). The following statistical analysis were 202
conducted: a - comparison between 1 g l-1 and 0.5 g l-1 glucose or peptone or yeast extract,
9 b - comparison between 1 g l-1 and 0.25 g l-1 glucose or peptone, c - comparison between
204
0.5 g l-1 and 0.25 g l-1 glucose or peptone, d - comparison between 0.5 g l-1 and 0.125 g l
-205
1 yeast extract, e - comparison between 1 g l-1 and 0.125 g l-1 yeast extract (see Figure 5).
206
Paired t-test analysis was also performed when appropriate. 207
208
Results 209
CFD modelling of shaken 96-well microtiter plates
210
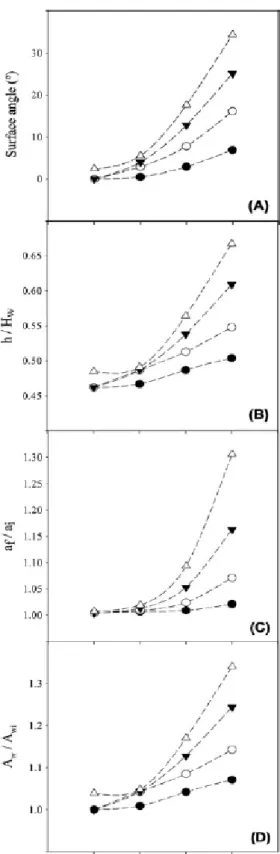
In an orbital shaker, the inclination of the air-liquid interface increases with the increase 211
of the shaking frequency and the orbital diameter. This effect can be quantified by 212
measuring the angle of the surface formed with the horizontal (Figure 2A). A maximum 213
angle of 34º was obtained for the largest orbital diameter and shaking frequency. The 214
maximum height of the interface (ℎ), normalized by the height of the well (𝐻𝑤), is 215
represented in Figure 2B as a function of the shaking frequency for different orbital 216
diameters. This dimensionless parameter is an indication of the volume of the well 217
occupied by the liquid. Values ranging from 46 to 67% were obtained (with the highest 218
values corresponding to the larger orbital diameter and shaking frequency), indicating 219
that the liquid does not overflow from the well in any of the simulated situations. As the 220
slope of the interface increased, the interfacial area also increased. Figure 2C shows the 221
ratio between the specific surface area in a moving well (𝑎𝑓) and the specific surface area 222
in a stationary well (𝑎𝑖) for several shaking frequencies and orbital amplitudes. When the 223
𝑎𝑓⁄ ratio is greater than 1, this means that an area gain is obtained with the orbital 𝑎𝑖
224
motion. The area gain was negligible (less than 2%) for the smaller orbital diameter 225
regardless of the shaking frequency. For all the orbital diameters, area gains ranging from 226
0.4-2% were obtained for shaking frequencies up to 150 rpm (except for 75 and 100 mm 227
at 150 rpm where the gains were of 5 and 8%, respectively). The highest area gain (of 228
10 31%) was obtained for the largest orbital diameter and shaking frequency. It is also 229
possible to observe from Figure 2C that the slope of area gain increased significantly with 230
the orbital diameter from 150 to 200 rpm. The evolution of the wetted area (𝐴𝑤)
231
normalized by the wetted area for a stationary well (𝐴𝑤𝑖) is represented on Figure 2D. It 232
follows the same trend that was observed for the maximum height of the interface (Figure 233
2B), representing the available area for biofilm formation. At lower shaking frequencies 234
(50 and 100 rpm), the wetted area remained practically constant at different orbital 235
diameters (area gains less than 5%), but for higher frequencies area gains ranging from 4 236
to 34% were determined. 237
The increase of the amplitude of the interfacial surface oscillation led to an increase in 238
the fluid velocity and, consequently, to an increase of the shear strain rate near the walls 239
of the well. Figure 3 compares the time averaged wall strain rate distribution for several 240
orbital diameters and shaking frequencies. The wall strain rate was not uniform, being 241
much higher in the liquid side near the interface. A zone of wall strain rate above 30 s-1
242
was visible for all the systems shown in Figure 3, and was delimited by the region where 243
the interface oscillates. The extension of this region increased as the shaking frequency 244
and orbital diameter increased. For all orbital diameters, the average strain rate is around 245
12 s-1 when a shaking frequency of 50 rpm is used (Figure 4). However, when an
246
incubator with 25 mm of shaking amplitude is used, this value can be increased 3 fold 247
under a shaking frequency of 200 rpm. A wider range of shear rate conditions can be 248
experienced with incubators of 50 or 75 mm orbital diameters, where numerical 249
simulations predicted an increase of 6 to 7 fold at the highest tested frequency when 250
compared to the value obtained at 50 rpm. Indeed, as the orbital diameter increased the 251
shear strain range widened, spanning from 10 to 142 s-1 (Figure 4).
252 253
11
Biofilm formation
254
The combined effects of shear forces and nutrient levels on biofilm formation were 255
assessed by crystal violet assay (Figure 5). Polystyrene 96-well microtiter plates were 256
placed in orbital incubators with shaking diameters of 25 and 50 mm (at the same shaking 257
frequency of 150 rpm) and also without shaking (0 rpm). Simultaneously, the influence 258
of three concentrations of the main nutrients (glucose, peptone and yeast extract) was 259
studied. 260
Figures 5A, B and C, concerning the effect of glucose, show that the initial biofilm 261
production (until 12 h) was 51% higher on the lower concentration media (0.25 and 0.5 g 262
l-1) for the highest shaking amplitude. Opposite results were observed for the lower
263
amplitude and also for the static condition (statistically significant differences were 264
obtained between the two extreme concentrations in all shaking conditions). For the 265
highest glucose concentration (1 g l-1), a maximum in biofilm formation was attained at
266
24 h in all shaking conditions. Above 24 h, whilst the biofilm amount decreased from the 267
maximum in both shaking conditions (in particular for the higher shaking amplitude), this 268
maximum amount was relatively the same on the static condition. Interestingly, 269
approximately the same maximum amount of biofilm was formed in all hydrodynamic 270
conditions (P = 0.41) for the highest glucose concentration tested. 271
When analysing the oscillatory behavior in detail for the highest shaking amplitude 272
(Figure 5A), it is possible to see that the decrease in the biofilm amount in the culture 273
medium with 1 g l-1 glucose was abrupt between 24 and 36 h, reaching the level obtained
274
with the intermediate glucose concentration at the end of the experiment (60 h). For 0.5 275
g l-1 glucose, the fluctuations were also observed (the maximum was reached at 36 h),
276
nevertheless with a smoother decrease than the one found for the most concentrated 277
medium. 278
12 When an orbital shaker with 25 mm diameter at 150 rpm was used (Figure 5B), the 279
general trend is that the amount of biofilm formed increased with increasing glucose 280
concentrations. For this hydrodynamic condition and with 1 g l-1 glucose, the decrease of
281
biofilm amount between 24 and 36 h was less pronounced than in the larger diameter 282
incubator (35% versus 74% decrease, respectively). Then, the amount of biofilm 283
stabilized until the end of the experiment, and similar values to those obtained with the 284
larger shaking diameter were achieved (P = 0.45). 285
Concerning the effect of peptone concentrations (Figures 5D, E and F), the maximum 286
biofilm amount was obtained at 36 h (P < 0.05) for the highest concentration (1 g l-1) and
287
shaking diameter (Figure 5D). From this moment onwards, the amount of biofilm 288
obtained with this growth medium markedly decreased (80%) to the final level of the 289
remaining media. Except for this maximum value, the differences found when varying 290
peptone concentrations were not statistically significant for the majority of the time points 291
in both agitated conditions (Figures 5D and E). For the static condition (Figure 5F), it can 292
be seen that increasing the concentration of this compound promoted biofilm growth in 293
the early stages of biofilm development. 294
Figures 5G, H and I show the effect of yeast extract concentrations on biofilm formation 295
under the tested hydrodynamic conditions. In terms of statistical significance, the results 296
indicate that this is the nutrient for which less significant differences were obtained under 297
the experimented concentrations (0.125, 0.25 and 1 g l-1). Comparing the results for each
298
concentration of yeast extract between both orbital shaking diameters, the growth profiles 299
were very similar (P > 0.05 for 87% of time points), showing that the orbital shaking 300
diameter had negligible impact on E. coli biofilm formation when different levels of yeast 301
extract were used. 302
13 Figure 6 shows the biofilm distribution on the vertical wall of 96-well microplates. 303
Biofilms consisting of cell clumps (Figure 6A) were observed in the liquid side near the 304
interface where, according to the CFD modeling, cells are exposed to higher magnitudes 305
of shear strain rate (Figure 3). Outside this wall region, the biofilm cell density decreased 306
and E. coli single cells were homogeneously distributed on the surface (Figure 6B). A 307
similar cell pattern was observed for the static condition albeit with a lower cell density 308 (Figure 6C). 309 310 Discussion 311
CFD modelling of shaken 96-well microtiter plates
312
Because hydrodynamics have such a great impact on biofilm formation in terms of 313
nutrient and oxygen transfer, and also influence cell attachment to and removal from 314
surfaces (Simões et al. 2007, Stoodley et al. 1998, Teodósio et al. 2013), it is interesting 315
to estimate by CFD several hydrodynamic parameters such as the average strain rate, the 316
specific air-liquid surface area and the wetted area available for cell adhesion. 317
As previously suggested by Hermann et al. (2003) and Kensy et al. (2005), the angle of 318
the liquid surface in the wells increases exponentially with increasing shaking intensities 319
(shaking diameters and shaking frequencies at constant filling volume), and an 320
enlargement of the specific air-liquid mass transfer area (𝒂𝒇⁄ ) is obtained. The 𝒂𝒊
321
numerical results also show that, at lower shaking frequency and especially for the lowest 322
shaking amplitude tested, the surface tension force dominates and keeps the liquid surface 323
nearly in the horizontal state. This corroborates the experimental results obtained by 324
Ortiz-Ochoa et al. (2005) and Hermann et al. (2003). Images acquired with a CCD-camera 325
for wells filled with 200 µl water and shaken at a shaking diameter of 25 mm showed no 326
liquid movement below 200 rpm (Hermann et al. 2003). In this study, a change of the 327
14 hydrodynamic flow is visible above 100 rpm (approximately the critical shaking 328
frequency) when the increased centrifugal force starts to gain relevance when compared 329
to surface tension. With a further increase of shaking frequency, the maximum liquid 330
height also increases and an expansion of the air-liquid mass transfer area is obtained 331
(Hermann et al. 2003), providing better oxygen transfer to the liquid. From these results, 332
it is reasonable to conclude that the surface tension has a strong influence on the 333
hydrodynamic flow and likely on the mass transfer in 96-well microtiter plates. 334
The experimental shaking conditions chosen for this work (𝒅𝒐= 25 and 50 mm, 150 rpm)
335
can reproduce the hydrodynamics of urinary catheters where E. coli typically adheres. 336
The shear strain rate found on these devices is of approximately 15 s-1 (Bakker et al. 2003,
337
Velraeds et al. 1998), which is only slightly lower than the range obtained under the 338
experimented conditions, according to the numerical results (23-46 s-1). With the shaking
339
amplitudes and frequencies used for biofilm formation in microtiter plates, it is also 340
possible to attain the shear strain rates that are found in the oral cavity, arteries and veins 341
(Table 1). For instance, the shear strain rate in the oral cavity can be simulated with the 342
same incubators shaking at frequencies up to 150 rpm. In order to reproduce the shear 343
rates resulting from the blood flow in arteries, it is vital to work with larger orbital 344
diameters (75 or 100 mm) at shaking frequencies around 100 rpm or with shaking 345
frequencies above the simulated ones for all shaking amplitudes. In this latter case, one 346
must bear in mind that a splashing phenomenon can occur for larger diameters and 347
frequencies above 200 rpm. This is not experimentally feasible due to contamination and 348
loss of growth medium and cells. Regarding the non-biomedical scenarios, it is possible 349
to attain the same shear rates encountered on a ship hull in a harbor with the 50 mm 350
incubator at 150 rpm or with the other incubators of larger diameter at velocities around 351
15 100 rpm. Finally, the liquid flow in biofilm channels should be simulated under the 352
shaking conditions already indicated for the blood flow in arteries. 353
Possible improvements of the system described in this work may come from the use of 354
orbital shakers with larger shaking amplitudes (eg 75 or 100 mm) at the same frequency 355
(150 rpm). In these incubators there is a higher gain in the wetted area and the air-liquid 356
interface area during shaking, which possibly results in relatively high specific oxygen 357
transfer rates and further increase in microbial growth (Duetz 2007, Duetz et al. 2000). 358
Although microtiter plates have been extensively used for biofilm studies in the last years 359
(Castelijn et al. 2012, Leroy et al. 2007, Rodrigues & Elimelech 2009, Shakeri et al. 360
2007), little is known about the flow pattern inside the wells. In fact, few papers have 361
been published applying computational fluid dynamics to simulate flow in microtiter 362
plates (Barrett et al. 2010, Zhang et al. 2008) during biofilm formation. Azevedo et al. 363
(2006) simulated the flow inside 6-well plates to test the influence of shear stress, 364
temperature and inoculation concentration on the adhesion of Helicobacter pylori to 365
stainless steel and polypropylene coupons. Kostenko et al. (2010) studied Staphylococcus 366
aureus deposition in the same plate format using different filling volumes and agitation
367
frequencies. This latter system was further analyzed by CFD by Salek et al. (2012) using 368
a flow topology analysis to explain biofilm accumulation, morphology and orientation of 369
endothelial cells. Since the 96-well format is currently one of the favorite platforms for 370
biofilm studies, it is intriguing why such a lack of information exists for this system. Our 371
research group started to study its hydrodynamics by monitoring the influence of two 372
shaking conditions on E. coli biofilm development (Moreira et al. 2013b). This simulation 373
was now extended in order to define which operational conditions should be chosen for 374
each particular application. When trying to produce “artificial” biofilms in laboratory 375
reactors one has to make sure that these biofilms resemble those that are formed in natural 376
16 environments. If that is not the case, then important experiments regarding antibiotic 377
susceptibilities, resistance to mechanical treatment, biocide efficacy assays and other tests 378
will not produce reliable results that are indeed applicable to the “natural” biofilms that 379
need to be controlled (Buckingham-Meyer et al. 2007). Since some knowledge about the 380
hydrodynamics of the locations where “natural” biofilms form is already available, it is 381
important that laboratory experiments are carried out in a way that mimics those 382
conditions. The information presented on this work defines the applicability range of 96-383
well microtiter plates in the simulation of several natural scenarios where biofilms form. 384
385
Biofilm formation
386
In this work, the effects of glucose, peptone and yeast extract concentrations on biofilm 387
development were tested. The reference concentration of each nutrient that was used on 388
the previous study (Teodósio et al. 2011b) and higher concentrations of the three main 389
nutrients were tested because it has been reported that high nutrient concentrations can 390
favor biofilm formation (Frias et al. 2001, Klahre & Flemming 2000, Volk & 391
LeChevallier 1999). 392
In preliminary studies, the effect of incubation temperature on biofilm formation was 393
studied in selected conditions. A wide range of medical devices are currently used 394
including indwelling (Donlan 2001), partially implantable and external devices (Newman 395
2008). A temperature of 37 ºC is more appropriate for simulating indwelling devices in 396
body core sites and temperatures closer to 25 ºC are best suited for external devices. 397
Therefore, an average temperature of 30 ºC is a good approximation for a partially 398
implantable device in body peripheral/skin sites (Andersen et al. 2010). Experiments 399
assaying the effect of temperature have shown that biofilm formation at 30 ºC is usually 400
favored when compared to 37 ºC for the tested conditions, but the results obtained are not 401
17 statistically different (data not shown). The influence of temperature on the 402
hydrodynamics was also investigated. CFD simulations shown that it is negligible and 403
even when the average strain rates are compared at the two temperatures (see 404
Supplementary material, Figure S2), the differences are on average below 5% (for the 405
150 rpm case used in the experimental part of this work, the difference is 0.4%). Since 406
microtiter plate assays are often used to screen compounds for antimicrobial activity 407
(Shakeri et al. 2007) and biofilm formation seems to be promoted at 30 ºC, this 408
temperature was chosen as an average for simulating conditions found in indwelling, 409
external and partially implantable devices. 410
The overall results of the glucose experiments indicate that higher glucose concentrations 411
may be beneficial for E. coli adhesion in the first 24 hours, independently of the shaking 412
conditions. Despite the lack of information on E. coli biofilms, it has been reported 413
(Bühler et al. 1998) that the total yield of cells growing in a biofilm increased linearly 414
with increase of glucose up to 2 g l-1. For Pseudomonas species, independent groups noted
415
that an increase in nutrient concentration is associated with an increase of cell attachment 416
(Peyton 1996, Simões et al. 2010b). For Pseudomonas putida, Rochex and Lebeault 417
(2007) observed an increase in biofilm thickness when increasing glucose concentration 418
up to a certain limit (0.5 g.l-1), above which an additional increase of substrate reduced
419
the biofilm accumulation rate as a consequence of a higher detachment. 420
In most cases E. coli cells took more time to establish on the surface under static 421
conditions. On the other hand, after the initial period of adhesion, the amount of biofilm 422
formed under static conditions remained constant while that accumulated under shaking 423
conditions dropped, in particular for the glucose experiments. This corroborates what has 424
been postulated by several authors (Percival et al. 1999, Pereira & Vieira 2001, Vieira et 425
al. 1993), that higher flow rates can cause two phenomena of opposite nature: on the one 426
18 hand, they favor the transport of nutrients to the surface, contributing to cell growth in 427
the microbial layer and to the production of exopolymers and, on the other hand, with 428
increasing flow velocity the shear rates increase and that can cause further erosion and 429
detachment of biofilm portions, and the consequent decrease in the amount of biomass 430
attached to the surface. The interplay between these two effects (including the increase in 431
surface area available for oxygenation) explains the higher growth followed by the more 432
abrupt drop in biomass when the highest glucose concentration was used. Besides that, it 433
is also known that E. coli, under certain conditions, adheres more strongly to surfaces 434
with increasing fluid velocities due to the action of the lectin-like adhesin FimH (Thomas 435
et al. 2002) or of the flagella (McClaine & Ford 2002). 436
Biofilms seemed to have entered a state of dynamic equilibrium at the highest shaking 437
amplitude and for the two highest concentrations of glucose, probably as a consequence 438
of the combined effects of hydrodynamics and carbon levels. The cyclical biofilm 439
maturation and subsequent dispersal pattern probably occurred because it was no longer 440
profitable for the bacterium to participate in the biofilm, due to several reasons such as 441
shear forces, lack of nutrients and accumulation of toxic metabolic by-products (Dunne 442
2002). 443
The data presented in this work indicates that variation of peptone and yeast extract 444
concentrations has no significant impact on the amount of attached cells, in the range of 445
concentrations and hydrodynamic conditions tested. As glucose is the main carbon source 446
in the tested culture media, peptone is the most important nitrogen source since its 447
nitrogen content exceeds 13% (Merck, product information ref. 107214). Yeast extract 448
also provides nitrogen (> 10 %) to bacteria besides vitamins, amino acids and carbon 449
(Merck, product information, ref. 103753). In reactors for biological waste gas treatment, 450
biofilm growth seems to respond strongly to the amount of available nitrogen (Holubar 451
19 et al. 1999). A similar behavior was observed for P. putida strain isolated from a paper 452
machine (Rochex & Lebeault 2007). The rate and extent of biofilm accumulation 453
increased with nitrogen concentration (from carbon/nitrogen = 90 to carbon/nitrogen = 454
20). Additionally, it is known that when the carbon/nitrogen ratio on the nutrient supply 455
is increased, the polysaccharide/protein ratio generally increases (Huang et al. 1994). 456
Delaquis et al. (1989) showed that the depletion of nitrogen led to the active detachment 457
of cells from P. fluorescens biofilm. Since different E. coli strains are capable of causing 458
UTI (Salo et al. 2009), selected experiments were performed to see if the results obtained 459
with strain JM109(DE3) were also confirmed with another strain. E. coli CECT 434 (a 460
clinical isolate) was used for this purpose and in general there were no statistically 461
significant differences between the results obtained for the two strains (see 462
Supplementary material, Figure S3). 463
Although the wetted area predicted for cell adhesion was 2 fold higher for the 50 mm 464
incubator when compared to the 25 mm incubator (at 150 rpm), the maximum biofilm 465
amount detected by the crystal violet assay was very similar for the three operational 466
conditions used. Thus, an increase in wetted area did not cause an increase in the amount 467
of biofilm. 468
The simulation results indicate that the strain rates under which the E. coli biofilms 469
develop changed drastically along the cylindrical wall. The higher strain rates below the 470
interface were associated with the formation of dispersed cell aggregates, while a decrease 471
in the strain rate values resulted in a homogeneous distribution of single cells on the wall. 472
Kostenko et al. (2010) also shown that biofilm deposition and morphology in microtiter 473
plates is non-uniform and that the biofilm characteristics correlate strongly with local 474
shear stress mean and fluctuation levels. It has been shown that biofilms in the human 475
body are naturally heterogeneous as a result of the shear stress variations. Thus, microtiter 476
20 plates are ideally suited to mimic these natural variations in the shear stress field in 477
biomedical scenarios. 478
Taking together the results obtained from the numerical simulation and those obtained 479
during biofilm formation studies, it is possible to conclude that if the right operational 480
conditions are used, the microtiter plate is a powerful platform for biofilm simulation in 481
a variety of applications including biomedical scenarios. 482
483
Acknowledgments 484
The authors acknowledge the financial support provided by Operational Programme for 485
Competitiveness Factors – COMPETE, European Fund for Regional Development – 486
FEDER and by the Portuguese Foundation for Science and Technology – FCT, through 487
Projects PTDC/EQU-FTT/105535/2008 and PTDC/EBB-BIO/104940/2008. Luciana 488
Gomes acknowledges the receipt of a Ph.D. grant from FCT (SFRH/BD/80400/2011) and 489
José Araújo acknowledges the financial support from FCT through the Grant 490 SFRH/BPD/64148/2009. 491 492 Nomenclature 493
𝑎𝑓 Final specific surface area (m-1)
494
𝑎𝑖 Initial specific surface area (m-1)
495
𝐴𝑤 Wetted area (m2)
496
𝐴𝑤𝑖 Wetted area for a stationary well (m2)
497
𝑑𝑜 Shaking diameter (m)
498
𝐷 Well or vessel diameter (m) 499
ℎ Maximum height of the interface (m) 500
𝐻 Well height (m) 501
21 𝜃 Surface angle (º) 502 503 References 504
Aleviadrou BR, McIntire LV. 1995. Rheology. In: Loscalzo J, Schafer A, editors. 505
Thrombosis and hemorrhage. Cambridge (MA): Blackwell Sciences; p. 369–384. 506
Alnnasouri M, Dagot C, Pons M-N. 2011. Comparison of four methods to assess biofilm 507
development. Water Sci Technol. 63(3):432-439. 508
Andersen TE, Kingshott P, Palarasah Y, Benter M, Alei M, Kolmos HJ. 2010. A flow 509
chamber assay for quantitative evaluation of bacterial surface colonization used to 510
investigate the influence of temperature and surface hydrophilicity on the biofilm forming 511
capacity of uropathogenic Escherichia coli. J Microbiol Methods. 81(2):135-140. 512
Azevedo NF, Pinto AR, Reis NM, Vieira MJ, Keevil CW. 2006. Shear stress, 513
temperature, and inoculation concentration influence the adhesion of water-stressed 514
Helicobacter pylori to stainless steel 304 and polypropylene. Appl Environ Microbiol.
515
72(4):2936-2941. 516
Bakker D, van der Plaats A, Verkerke G, Busscher H, van der Mei H. 2003. Comparison 517
of velocity profiles for different flow chamber designs used in studies of microbial 518
adhesion to surfaces. Appl Environ Microbiol. 69(10):6280-6287. 519
Bark DL, Para AN, Ku DN. 2012. Correlation of thrombosis growth rate to pathological 520
wall shear rate during platelet accumulation. Biotechnol Bioeng. 109:2642-2650. 521
Barrett TA, Wu A, Zhang H, Levy MS, Lye GJ. 2010. Microwell engineering 522
characterization for mammalian cell culture process development. Biotechnol Bioeng. 523
105(2):260-275. 524
Brackbill JU, Kothe DB, Zemach C. 1992. A continuum method for modeling surface 525
tension. J Comput Phys. 100(2):335-354. 526
22 Bryers JD. 2008. Medical biofilms. Biotechnol Bioeng. 100(1):1-18.
527
Buckingham-Meyer K, Goeres DM, Hamilton MA. 2007. Comparative evaluation of 528
biofilm disinfectant efficacy tests. J Microbiol Methods. 70(2):236-244. 529
Bühler T, Ballestero S, Desai M, Brown MRW. 1998. Generation of a reproducible 530
nutrient-depleted biofilm of Escherichia coli and Burkholderia cepacia. J Appl 531
Microbiol. 85(3):457-462. 532
Busscher HJ, van der Mei HC. 2006. Microbial adhesion in flow displacement systems. 533
Clin Microbiol Rev. 19(1):127-141. 534
Castelijn GAA, van der Veen S, Zwietering MH, Moezelaar R, Abee T. 2012. Diversity 535
in biofilm formation and production of curli fimbriae and cellulose of Salmonella 536
Typhimurium strains of different origin in high and low nutrient medium. Biofouling. 537
28(1):51-63. 538
Chesterton AKS, Moggridge GD, Sadd PA, Wilson DI. 2011. Modelling of shear rate 539
distribution in two planetary mixtures for studying development of cake batter structure. 540
J Food Eng. 105(2):343-350. 541
Coenye T, Nelis HJ. 2010. In vitro and in vivo model systems to study microbial biofilm 542
formation. J Microbiol Methods. 83(2):89-105. 543
Delaquis PJ, Caldwell DE, Lawrence JR, McCurdy AR. 1989. Detachment of 544
Pseudomonas fluorescens from biofilms on glass surfaces in response to nutrient stress.
545
Microbial Ecol. 18(3):199-210. 546
Donlan RM. 2001. Biofilm formation: a clinically relevant microbiological process. Clin 547
Infect Dis. 33(8):1387-1392. 548
Donlan RM. 2002. Biofilms: microbial life on surfaces. Emerg Infect Dis. 8(9):881-890. 549
23 Dorel C, Lejeune P, Jubelin G. 2006. Role of biofilms in infections caused by Escherichia 550
coli. In: Pace JL, Rupp ME, Finch R, editors. Biofilms, infection, and antimicrobial
551
therapy. Boca Raton (USA): Taylor & Francis; p. 73-80. 552
Duetz WA. 2007. Microtiter plates as mini-bioreactors: miniaturization of fermentation 553
methods. Trends Microbiol. 15(10):469-475. 554
Duetz WA, Ruedi L, Hermann R, O'Connor K, Buchs J, Witholt B. 2000. Methods for 555
intense aeration, growth, storage, and replication of bacterial strains in microtiter plates. 556
Appl Environ Microbiol. 66(6):2641-2646. 557
Dunne WM, Jr. 2002. Bacterial Adhesion: Seen Any Good Biofilms Lately? Bacterial 558
Adhesion: Seen Any Good Biofilms Lately? 15(2):155-166. 559
Foxman B. 2002. Epidemiology of urinary tract infections: incidence, morbidity, and 560
economic costs. Dis Mon. 49(2):53-70. 561
Frias J, Ribas F, Lucena F. 2001. Effects of different nutrients on bacterial growth in a 562
pilot distribution system. Antonie Van Leeuwenhoek. 80(2):129-138. 563
Fux CA, Wilson S, Stoodley P. 2004. Detachment characteristics and oxacillin resistance 564
of Staphyloccocus aureus biofilm emboli in an in vitro catheter infection model. J 565
Bacteriol. 186(14):4486-4491. 566
Ganderton L, Chawla J, Winters C, Wimpenny J, Stickler D. 1992. Scanning electron 567
microscopy of bacterial biofilms on indwelling bladder catheters. Eur J Clin Microbiol 568
Infect Dis. 11(9):789-796. 569
Hancock V, Ferrières L, Klemm P. 2007. Biofilm formation by asymptomatic and 570
virulent urinary tract infectious Escherichia coli strains. FEMS Microbiol Lett. 571
267(1):30-37. 572
Hermann R, Lehmann M, Büchs J. 2003. Characterization of gas-liquid mass transfer 573
phenomena in microtiter plates. Biotechnol Bioeng. 81(2):178-186. 574
24 Hirt CW, Nichols BD. 1981. Volume of fluid (VOF) method for the dynamics of free 575
boundaries. J Comput Phys. 39(1):201-225. 576
Holubar P, Andorfer C, Braun R. 1999. Effects of nitrogen limitation on biofilm 577
formation in a hydrocarbon-degrading trickle-bed filter. Appl Microbiol Biotechnol. 578
51(4):536-540. 579
Huang C-T, Peretti SW, Bryers JD. 1994. Effects of medium carbon-to-nitrogen ratio on 580
biofilm formation and plasmid stability. Biotechnol Bioeng. 44(3):329-336. 581
Inauen W, Baumgartner H, Bombeli T, Haeberli A, Straub P. 1990. Dose- and shear rate-582
dependent effects of heparin on thrombogenesis induced by rabbit aorta subendothelium 583
exposed to flowing human blood. Arterioscler Thromb Vasc Biol. 10(4):607-615. 584
Jacobsen SM, Stickler DJ, Mobley HLT, Shirtliff ME. 2008. Complicated catheter-585
associated urinary tract infections due to Escherichia coli and Proteus mirabilis. Clin 586
Microbiol Rev. 21(1):26-59. 587
Kensy F, Zimmermann HF, Knabben I, Anderlei T, Trauthwein H, Dingerdissen U, 588
Büchs J. 2005. Oxygen transfer phenomena in 48-well microtiter plates: determination 589
by optical monitoring of sulfite oxidation and verification by real-time measurement 590
during microbial growth. Biotechnol Bioeng. 89(6):698-708. 591
Klahre J, Flemming HC. 2000. Monitoring of biofouling in papermill process waters. 592
Water Res. 34(14):3657-3665. 593
Kostenko V, Salek MM, Sattari P, Martinuzzi RJ. 2010. Staphylococcus aureus biofilm 594
formation and tolerance to antibiotics in response to oscillatory shear stresses of 595
physiological levels. FEMS Immunol Med Microbiol. 59(3):421-431. 596
Leroy C, Delbarre C, Ghillebaert F, Compere C, Combes D. 2007. Effects of commercial 597
enzymes on the adhesion of a marine biofilm-forming bacterium. Biofouling. 24(1):11-598
22. 599
25 Liu Y, Tay J-H. 2002. The essential role of hydrodynamic shear force in the formation of 600
biofilm and granular sludge. Water Res. 36(7):1653-1665. 601
Mareels G. 2007. Experimental and numerical modeling of flow and mass transport in a 602
bioartificial liver [PhD]. Ghent (BE): Ghent University. 603
Mareels G, Kaminsky R, Eloot S, Verdonck PR. 2007. Particle image velocimetry-604
validated, computational fluid dynamics-based design to reduce shear stress and 605
residence time in central venous hemodialysis catheters. ASAIO J. 53(4):438-446 606
McClaine JW, Ford RM. 2002. Characterizing the adhesion of motile and nonmotile 607
Escherichia coli to a glass surface using a parallel-plate flow chamber. Biotechnol
608
Bioeng. 78(2):179-189. 609
Michelson AD. 2002. Platelets. New York (USA): Academic Press/Elsevier Science. 610
Moreira JMR, Teodósio JS, Silva FC, Simões M, Melo LF, Mergulhão FJ. 2013a. 611
Influence of flow rate variation on the development of Escherichia coli biofilms. 612
Bioprocess Biosyst Eng.1-10. 613
Moreira JMR, Gomes LC, Araújo JDP, Miranda JM, Simões M, Melo LF, Mergulhão FJ. 614
2013b. The effect of glucose concentration and shaking conditions on Escherichia coli 615
biofilm formation in microtiter plates. Chem Eng Sci. 94(0):192-199. 616
Mukherjee PK, Chand DV, Chandra J, Anderson JM, Ghannoum MA. 2009. Shear stress 617
modulates the thickness and architecture of Candida albicans biofilms in a phase-618
dependent manner. Mycoses. 52(5):440-446. 619
Newman DK. 2008. Internal and external urinary catheters: a primer for clinical practice. 620
Ostomy Wound Manag. 54(12):18-35. 621
Ortiz-Ochoa K, Doig SD, Ward JM, Baganz F. 2005. A novel method for the 622
measurement of oxygen mass transfer rates in small-scale vessels. Biochem Eng J. 623
25(1):63-68. 624
26 Percival SL, Knapp JS, Wales DS, Edyvean RGJ. 1999. The effect of turbulent flow and 625
surface roughness on biofilm formation in drinking water. J Ind Microbiol Biot. 626
22(3):152-159. 627
Pereira MO, Vieira MJ. 2001. Effects of the interactions between glutaraldehyde and the 628
polymeric matrix on the efficacy of the biocide against Pseudomonas fluorescens 629
biofilms. Biofouling. 17(2):93-101. 630
Peyton BM. 1996. Effects of shear stress and substrate loading rate on Pseudomonas 631
aeruginosa biofilm thickness and density. Water Res. 30(1):29-36.
632
Rochex A, Lebeault JM. 2007. Effects of nutrients on biofilm formation and detachment 633
of a Pseudomonas putida strain isolated from a paper machine. Water Res. 41(13):2885-634
2892. 635
Rodrigues DF, Elimelech M. 2009. Role of type 1 fimbriae and mannose in the 636
development of Escherichia coli K12 biofilm: from initial cell adhesion to biofilm 637
formation. Biofouling. 25(5):401-411. 638
Salek M, Sattari P, Martinuzzi R. 2012. Analysis of fluid flow and wall shear stress 639
patterns inside partially filled agitated culture well plates. Ann Biomed Eng. 40(3):707-640
728. 641
Salo J, Sevander JJ, Tapiainen T, Ikaheimo I, Pokka T, Koskela M, Uhari M. 2009. 642
Biofilm formation by Escherichia coli isolated from patients with urinary tract infections. 643
Clin Nephrol. 71(5):501-507. 644
Schinabeck MK, Ghannoum MA. 2006. Biofilm-related indwelling medical device 645
infections. In: Pace JL, Rupp ME, editors. Biofilms, infection, and antimicrobial therapy. 646
Boca Raton (USA): Taylor & Francis; p. 39-48. 647
27 Shakeri S, Kermanshahi RK, Moghaddam MM, Emtiazi G. 2007. Assessment of biofilm 648
cell removal and killing and biocide efficacy using the microtiter plate test. Biofouling. 649
23(2):79-86. 650
Simões L, Simões M, Vieira M. 2010a. Adhesion and biofilm formation on polystyrene 651
by drinking water-isolated bacteria. Antonie van Leeuwenhoek. 98(3):317-329. 652
Simões M, Pereira MO, Vieira MJ. 2005. Validation of respirometry as a short-term 653
method to assess the efficacy of biocides. Biofouling. 21(1):9-17. 654
Simões M, Simões LC, Vieira MJ. 2010b. A review of current and emergent biofilm 655
control strategies. LWT-Food Sci Technol. 43(4):573-583. 656
Simões M, Pereira MO, Sillankorva S, Azeredo J, Vieira MJ. 2007. The effect of 657
hydrodynamic conditions on the phenotype of Pseudomonas fluorescens biofilms. 658
Biofouling. 23(4):249-258. 659
Singh PK, Marzo A, Howard B, Rufenacht DA, Bijlenga P, Frangi AF, Lawford PV, 660
Coley SC, Hose DR, Patel UJ. 2010. Effects of smoking and hypertension on wall shear 661
stress and oscillatory shear index at the site of intracranial aneurysm formation. Clin 662
Neurol Neurosurg. 112(4):306-313. 663
Sonak S, Bhosle NB. 1995. A simple method to assess bacterial attachment to surfaces. 664
Biofouling. 9(1):31-38. 665
Stoodley P, Dodds I, Boyle JD, Lappin-Scott HM. 1998. Influence of hydrodynamics and 666
nutrients on biofilm structure. J Appl Microbiol. 85(S1):19S-28S. 667
Stoodley P, Wilson S, Hall-Stoodley L, Boyle JD, Lappin-Scott HM, Costerton JW. 2001. 668
Growth and detachment of cell clusters from mature mixed-species biofilms. Appl 669
Environ Microbiol. 67(12):5608-5613. 670
Telgmann U, Horn H, Morgenroth E. 2004. Influence of growth history on sloughing and 671
erosion from biofilms. Water Res. 38(17):3671-3684. 672
28 Teodósio JS, Simões M, Mergulhão FJ. 2012. The influence of nonconjugative 673
Escherichia coli plasmids on biofilm formation and resistance. J Appl Microbiol
113:373-674
382. 675
Teodósio JS, Simões M, Melo LF, Mergulhão FJ. 2011a. The influence of the nutrient 676
load on the formation of Escherichia coli biofilms. In: Berhardt LV, editors. Advances in 677
Medicine and Biology. New York (USA): Nova Science Publishers, Inc.; p. 153-168. 678
Teodósio JS, Simões M, Melo LF, Mergulhão FJ. 2011b. Flow cell hydrodynamics and 679
their effects on E. coli biofilm formation under different nutrient conditions and turbulent 680
flow. Biofouling. 27(1):1-11. 681
Teodósio JS, Silva FC, Moreira JMR, Simões M, Melo LF, Alves MA, Mergulhão FJ. 682
2013. Flow cells as quasi ideal systems for biofouling simulation of industrial piping 683
systems. Biofouling.1-14. 684
Thomas WE, Trintchina E, Forero M, Vogel V, Sokurenko EV. 2002. Bacterial adhesion 685
to target cells enhanced by shear force. Cell. 109(7):913-923. 686
Tran V, Fleiszig S, Evans D, Radke C. 2011. Dynamics of fagellum- and pilus-mediated 687
association of Pseudomonas aeruginosa with contact lens surfaces. Appl Environ 688
Microbiol. 77(11):3644-3652. 689
Tranoudis I, Efron N. 2004. Tensile properties of soft contact lens materials. Cont Lens 690
Anterior Eye. 27(4):177-191. 691
Ulett GC, Mabbett AN, Fung KC, Webb RI, Schembri MA. 2007. The role of F9 fimbriae 692
of uropathogenic Escherichia coli in biofilm formation. Microbiology. 153(7):2321-693
2331. 694
van Loosdrecht MCM, Eikelboom D, Gjaltema A, Mulder A, Tijhuis L, Heijnen JJ. 1995. 695
Biofilm structures. Water Sci Technol. 32(8):35-43. 696
29 Vejborg RM, Klemm P. 2008. Blocking of bacterial biofilm formation by a fish protein 697
coating. Appl Environ Microbiol. 74(11):3551-3558. 698
Velraeds M, van de Belt-Gritter B, Van der Mei H, Reid G, Busscher H. 1998. Interface 699
in initial adhesion of uropathogenic bacteria and yeasts to silicone rubber by a 700
Lactobacillus acidophilos biosurfactant. J Med Microbiol. 47:1081-1085.
701
Vieira MJ, Melo LF, Pinheiro MM. 1993. Biofilm formation: hydrodynamic effects on 702
internal diffusion and structure. Biofouling. 7(1):67-80. 703
Volk CJ, LeChevallier MW. 1999. Impacts of the reduction of nutrient levels on bacterial 704
water quality in distribution systems. Appl Environ Microbiol. 65(11):4957-4966. 705
Wäsche S, Horn H, Hempel DC. 2002. Influence of growth conditions on biofilm 706
development and mass transfer at the bulk/biofilm interface. Water Res. 36(19):4775-707
4784. 708
Weinstein RA, Darouiche RO. 2001. Device-associated infections: a macroproblem that 709
starts with microadherence. Clin Infect Dis. 33(9):1567-1572. 710
Yataghene M, Pruvost J, Fayolle F, Legrand J. 2008. CFD analysis of the flow pattern 711
and local shear rate in a scraped surface heat exchanger. Chem Eng Process. 47(9-712
10):1550-1561. 713
Youngs DL. 1982. Time-dependent multi-material flow with large fluid distortion. In: 714
Morton KW, Baibnes MJ, editors. Numerical methods for fluid dynamics. New York 715
(USA): Academic Press; p. 273-285. 716
Zhang H, Lamping SR, Pickering SCR, Lye GJ, Shamlou PA. 2008. Engineering 717
characterisation of a single well from 24-well and 96-well microtitre plates. Biochem Eng 718
J. 40(1):138-149. 719
30 721
Figure 1. Schematic representation of a well. Dark grey area represents the wetted area in 722
a stationary well (𝐴𝑤𝑖) and light grey area represents the area increase upon shaking (𝐴𝑤). 723
𝐷is the well diameter, ℎ is the maximum height of the interface, 𝐻 is the well height and 724
𝜃 is the surface angle. 725
31 726
Figure 2. Simulation results of the effect of shaking frequency and amplitude on the (A) 727
surface angle, (B) maximum height of the interface (ℎ) normalized by the well height (𝐻), 728
(C) specific air-liquid surface area (𝑎𝑓⁄ ), (D) ratio between the wetted area for a 𝑎𝑖
729
dynamic (𝐴𝑤) and a stationary well (𝐴𝑤𝑖). Open triangles () - 100 mm shaking 730
diameter, closed inverted triangle () - 75 mm shaking diameter, open circles () - 50 731
mm shaking diameter, closed black circle () - 25 mm shaking diameter. 732
32 733
734
Figure 3. Time averaged strain rates on a 96-well microtiter plate at different orbital 735
shaking diameters and shaking frequencies. The diameter of the circle is proportional to 736
the diameter of the orbit described by each well of the plate when placed on an orbital 737
incubator with the indicated orbital shaking diameter. Strain rates below 20 s-1 are not
738
represented. 739
33 740
Figure 4. Numerical results of the shear strain rate as a function of the shaking frequency 741
for different orbital shaking diameters: open triangles () - 100 mm, closed inverted 742
triangle () - 75 mm, open circles () - 50 mm, closed black circle () - 25 mm. The 743
grey shading include some shear rates found in biomedical () and other scenarios () 744
(references on Table 1). 745
34 747
Figure 5. E. coli biofilm formation (absorbance at 570 nm) in 96-well microtiter plates 748
under dynamic (𝑑𝑜= 50 mm or 25 mm, 150 rpm) and static conditions: (A), (B) and (C) 749
effect of glucose; (D), (E) and (F) effect of peptone; (G), (H) and (I) effect of yeast extract. 750
Three nutrient concentrations were tested: closed inverted triangle () - 1 g l-1 of glucose,
751
peptone and yeast extract; open circle () - 0.5 g l-1 of glucose, peptone and yeast extract;
752
closed black circle () - 0.25 g l-1 of glucose and peptone; closed gray circle () - 0.125
753
g l-1 of yeast extract. Results are an average of three independent experiments for each
754
condition. Average SDs were < 30% for 50 mm shaking diameter, < 24% for 25 mm 755
shaking diameter and < 25% for no shaking conditions. Statistical analysis corresponding 756
to each time point is represented for a confidence level greater than 95% (P < 0.05): a - 757
comparison between 1 g l-1 and 0.5 g l-1 glucose or peptone or yeast extract, b - comparison
758
between 1 g l-1 and 0.25 g l-1 glucose or peptone, c - comparison between 0.5 g l-1 and
759
0.25 g l-1 glucose or peptone, d - comparison between 0.5 g l-1 and 0.125 g l-1 yeast extract,
760
e - comparison between 1 g l-1 and 0.125 g l-1 yeast extract.
761 762
35 Table 1. Characteristic shear strain rates found in biomedical and other settings
763
Phenomenon Shear strain rate
(s-1) Reference
Eyes
Blinking of an eye 0.35
(Bakker et al. 2003, Tranoudis & Efron 2004)
On-eye contact lens
motion 1,000 (Tran et al. 2011)
Mouth
Fluid on oral cavity 0.1-50
(Bakker et al. 2003) On teeth, while biting
an apple 200
Urinary tract Urinary flow in a
catheter 15
(Bakker et al. 2003, Velraeds et al. 1998)
Cardiovascular System
Blood flow in veins 20-800
(Aleviadrou & McIntire 1995, Inauen et al. 1990, Michelson 2002)
Blood flow in arteries 50-650
(Aleviadrou & McIntire 1995, Bark et al. 2012,
Michelson 2002) Central venous
hemodialysis catheters 1,900-2,400 (Mareels et al. 2007) Blood flow in little
blood vessels 2,000-5,000
(Aleviadrou & McIntire 1995, Mareels 2007) Brain Cerebral circulation > 100 (Singh et al. 2010)
Other
Flow of a film over a
vertical plate 0.1 (Bakker et al. 2003)
Annular space of a scraped surface heat exchanger
< 40 (Yataghene et al. 2008)
Tumbling or pouring 10-100 (Bakker et al. 2003) Wall of a planetary
mixer during cake batters 20-500 (Chesterton et al. 2011) Ship in harbor 50 (Bakker et al. 2003) Channels within a biofilm 60-300 764 765