1Palestra Sinfruit 109 - Simpósio Internacional de Fruticultura - Avanços na Fruticultura (17 a 21 Outubro) 2Universidad de Talca and Sociedad Chilena de Fruticultura. E-mail: [email protected]
WORLD TEMPERATE FRUIT PRODUCTION:
CHARACTERISTICS AND CHALLENGES
1JORGE B. RETAMALES2
ABSTRACT - In the last 30 years world population has increased 70% but per capita global fruit consumption is only 20% higher. Even though tropical and temperate fruit have similar contributions to the 50 kg/person/ year of US consumption of fresh fruit, in the last 30 years this has been slightly greater for temperate fruit. Within fruit consumption, the largest expansion has been for organic fruit which increased more than 50% in the 2002-2006 period. The largest expansion of area planted in the 1996-2006 has been for kiwi (29%) and blueberries (20%), while apples (-24%) and sour cherries (-13%) have had the largest reductions. Nearly 50% of the total global volume of fruit is produced by 5 countries: China, USA, Brazil, Italy and Spain. The main producer (China) accounts for 23% of the total. While the main exporters are Spain, USA and Italy, the main importers are Germany, Russia and UK. Demands for the industry have evolved towards quality, food safety and traceability. The industry faces higher productions costs (labor, energy, agrichemicals). The retailers are moving towards consolidation while the customers are changing preferences (food for health). In this context there is greater pressure on growers, processors and retailers. Emerging issues are labor supply, climate change, water availability and sustainability. Recent developments in precision agriculture, molecular biology, phenomics, crop modelling and post harvest physiology should increase yields and qual-ity, and reduce costs for temperate fruit production around the world.
Index terms: production,fruits,consumption.
PRODUÇÃO MUNDIAL DE FRUTAS DE CLIMA
TEMPERADO:CARACTERISTICAS E DESAFIOS
RESUMO - Nos últimos 30 anos a população mundial cresceu 70 %, mas o consumo per capita de frutas somente 20 %. Apesar de haver um equilíbrio entre o consumo de frutas tropicais e temperadas, de cerca de 50 kg/pessoa/ano,nos EUA, com 50 % cada uma, nos últimos 30 anos o consumo de frutas frescas temperadas tem sido um pouco maior. No consumo de frutas frescas, o de orgânicas teve o maior aumento, com cerca de 50% entre 2002 e 2006. A maior expansão nos plantios entre 1996 e 2006 foi na área plantada de kiwi, com 29 %, blueberries, com 20 %, enquanto maçã, com -2,4 % e cereja ácida, com -13 % tiveram as maiores reduções. Cerca de 50 % do total mundial de produção de frutas, em volume, é por apenas 5 paises, China, USA, Brasil, Itália e Espanha. O maior produtor é a China, com 23 % e os maiores exportadores são a Espanha, USA e Itália. Os maiores importadores são a Alemanha, Rússia e UK. As maiores demandas são em relação à qualidade,
sanidade e rastreabilidade. Os desafios são os maiores custos de energia, mão de obra e agroquímicos, pois
as exigências tem sido na direção às mudanças de preferência, saúde e sustentabilidade. Recente evolução na
agricultura de precisão, biologia molecular, fenômica, modelagem e fisiologia de pós-colheita devem aumentar
a produtividade e qualidade nas culturas,com redução de custos para as frutas de clima temperado.
Termos para indexação: produção,frutas,consumo.
INTRODUCTION
Temperate fruit production requires specific
environmental conditions which are found naturally in zones with Mediterranean climate. These areas comprise California (USA), zones surrounding the Mediterranean Sea (Northern Africa, southern Europe, Greece, Turkey and Middle East), portions of Australia, the southern tip of Africa and Central Chile (Figure 1).
TRENDS IN AREA PLANTED
TO TEMPERATE FRUIT
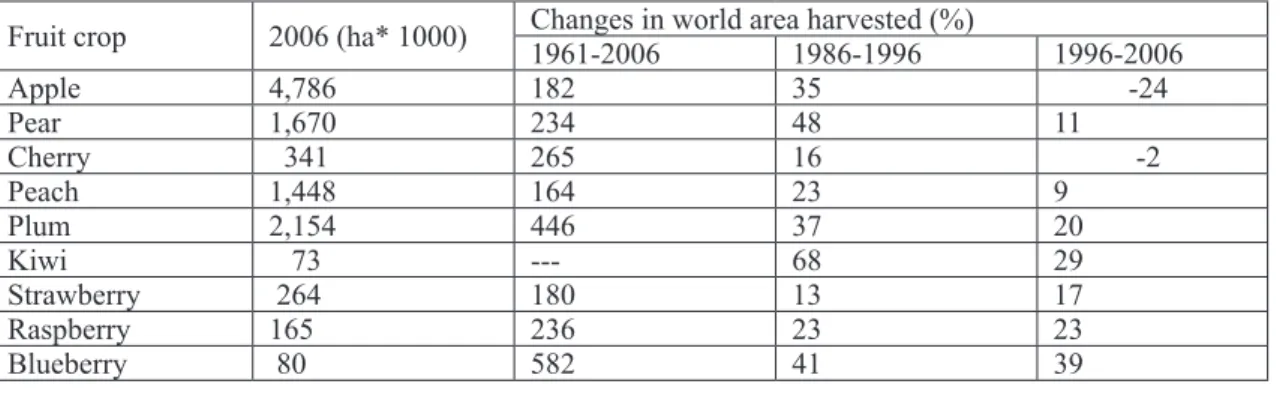
(182%) were the species with slowest growth (Table 1). In the case of apples, despite a marked expansion in the 1986-1996 period (35%), in the following decade (1996-2006) there was a 24% reduction in the area planted to this crop. Blueberries show a steady rate of expansion in both periods, while kiwi expanded strongly in the 1986-1996 period (68%), but the pace slowed down (29%) in the following decade (Table 1).
WORLD PRODUCTION OF FRUIT
The volume of fruit produced in the world (million of metric tons) has grown steadily in the last years (Figure 2).
Around 50% of the total volume of fruit
produced in the world is concentrated in only five
countries: China, USA, Brazil, India and European Union. The main producer is China which generates 23% of the total. The importance of China as world supplier of fruit has being growing steadily in the last years (Figure 3).
MARKETS FOR FRESH FRUIT
When the world growth in terms of value is analyzed by group of species of fresh fruit in the 2005-2009 period, the expansion is lead by dates, pineapples and avocados (53.8%), followed by ber-ries and kiwis (52.9%) and, with similar variations in term of average growth of imports (30-35%) are grapes, citrus, pome and stone fruits, coconuts-cashew nuts, and bananas (Figure 4). The only groups of species that grew at a lower rate than average were pawpaw and nuts (Bravo, 2011).
In the 2005-2009 period, the world market for imports of fresh fruit of Mediterranean climate has had a 7.3% expansion in volume; the volume moved from 27.9 to 30 million ton. The value of these fruit increased by 34.6% during the same period, from US$ 24,324 to 32,737 million. The largest increments in volume in the world market were for blueberries (44%), cherries (37%), avocados (36%) and man-darins (21%). Oranges were the only species that had a reduction in value (1.6%) during this period (BRAVO, 2011).
The growth in value of world imports has been lead by imports of blueberries (90%), avocados (73%), mandarins (51%) and cherries (45%). The rest
of the crops had a fluctuating growth (20-30%) during
the period under analysis. This growth has occurred despite the important drop in the average price of all species, except avocados and mandarins, during 2009 as compared to 2008. This fall was mainly caused
by the international financial crisis and the general -ized reduction in the demand from the main world economies (Bravo, 2011).
The export market is growing largely due to increased consumption and the development of technologies to facilitate trade in fresh fruits. Demand for fresh fruits on a year-round basis is increasing, and consumers are willing to pay higher prices for off-season fresh fruit. The development and adoption of new transportation and controlled atmosphere technologies allow fresh fruit to travel greater dis-tances and still maintain its freshness. The increased demand and the development of new technologies facilitate increased international trade in fresh fruit, providing consumers with greater choices of quality fresh fruit on a year-round basis (USDA, 2006).
The export market for fresh fruits is highly competitive among the top exporters. Gaining access to foreign markets is critical to countries that are large exporters. Free trade agreements are one means to provide increased market access and encourage increased exports. In addition to negotiating trade agreements, top exporters also use various export promotion and marketing techniques to increase their market share in foreign markets.
The ratio between volume and value is an indi-cator of the quality of the exported fruit; thus, the lower the ratio, the higher the relative quality. This ratio is highest for New Zealand (near 1); between 1 and 2 for fruit exports from USA, Europe, Chile, Argentina and Turkey; ranges from 2 to 3 for South Africa and Brazil, and evidences the lowest quality (values > 3), for China, Colombia and Philippines (Figure 6).
The main world markets importing fresh fruit, including minimally processed fruit, are lead by USA, Germany, Holland, UK, and the Russian Federation. Among the 15 main importing countries it can be seen an expansion lower than the average for the 2005-2009 period in the most traditional markets, especially European (which were affected by the 2009 international crisis), and a growth higher than average for fruit imports into China (161%), the United Arab Emirates (129%), Hong Kong (108%), the Russian Federation (105%) and Holland (74%) (Bravo, 2011) (Figure 7).
Argentina, Turkey, Colombia, Philippines, China and Brazil have between 5 and 2% of the world fruit market (Figure 8). On the other hand, the market share evolved in the 2001-2003 period; again, in
this issue three groups of countries can be identified. The first group, constituted by USA and Argentina,
decreased in their market share. The largest number of important fruit exporting countries belong to the second group, which showed little or no change in market share (European Union, New Zealand, Chile, Mexico, Colombia, Turkey, Philippines and Brazil. Finally, the countries that in this period increased their market share were South Africa and China (Figure 8).
Chile is the country which exports the Chile is the country which exports the high-est proportion of its fruit (45%), followed by South Africa (38%), Colombia (25%), and Philippines (17%). On the other extreme, countries like China, Brazil and the European Union destine most of the fruit they produce to the domestic market (> 95% of their fruit production). In an intermediate condition are USA and Mexico, in which around 10% of their fruit production is exported (Figure 9).
FRUIT CONSUMPTION TRENDS:
Factors such as income, aging of a population, market promotion, and consumer awareness of the importance of fruit, greater year round availability have contributed to increased fresh fruit consump-tion. The consumption of fruit has been increasing in the last years due to changes in consumer prefer-ences and promotion campaigns by international organizations and governmental agencies (KING et al., 1999). In the 1975-2005 period, the expan-sion in consumption of temperate fruit in the USA, which should be indicative of a world trend, has been proportionally greater than the one for tropi-cal fruit (Figure 10). Temperate fruit consumption would currently amount for over 30 kg/person/year in the USA (GRANATSTEIN et al., 2008); nearly 14% of this total was apple (8% fresh; 6% apple juice), the level of fruit consumption is about half of the recommended by the USDA. Even though fresh fruit represent 45% of fruit consumption in USA, the increment was greater for fresh fruit consumption than for processed fruit in the 1970-1995 period (27 vs. 20% increase) (KING et al.,1999).
The expansion in fruit consumption has varied according to income. Greater increment in the 1961-1998 period occurred for mid and high income countries (Table 2). Consumption of fresh fruits is increasing in the major economies and is expected to continue to expand. The greater increase
in fresh fruit consumption in these countries has partly been a result of greater availability of out of season imports. In the sixties, only citrus, bananas, and apples were available in the supermarkets during the winter months. Since the mid-eighties, however, improved transportation, storage and increased pro-duction in Southern Hemisphere countries made certain temperate fruit, previously unavailable in the Northern Hemisphere, now common year round. With increased globalization, higher income and the associated changes in lifestyles, demand for fruit in developing countries is expected to increase and will likely be shaped by the same factors that have affected high income countries for these products. Availability, affordability, convenience, and health
concerns will probably influence future consumption
of fruit across the world (POLLACK, 2000). The expansion in fruit consumption in the 1961-1998 period varied according to average per capita income of the country. Thus, as reported by Pollack (2000), mid and high income countries had a greater expansion (14%) in fruit and vegetable consumption than low income countries (11%) (Table 2). This expansion in fruit consumption due
to greater per capita income is exemplified by China,
where the recent economical growth of the country has generated not only migration from rural areas to the cities (with less labor available for highly de-manding sectors such as fruit production), but also greater demand for quantity and quality of fruit as well as greater volumes of imports, and changes in all components of the supply chain (WOOLSEY et al., 2010).
According to Bravo (2011), the major trends in fruit consumption are:
• Changes in preferences of the consumers that trans -late into greater concerns about safety
traceability and contamination, which provides con-ditions for niche markets (i.e. specialty foods and organic produces).
• Population growth increases the demand for food
and the greater income in some countries expand the demand for foods with greater economic elasticity (i.e. fruit, meat).
• The changes in preferences of the consumers
translate into greater regulations in the international markets. These are promoted by NGO`s and
govern-ments, which finally translate into growing levels of
non-tariff components in the price of foods.
• The consolidation and integration of large retailers
generates greater power to the last part of the value chain, and this component exerts greater pressure to growers and processors.
Europe, a group of more than 200 scientists from 16 countries developed ISAFRUIT project between 2006 and 2010. The activities of ISAFRUIT focalized in the following pillars (BRAVO, 2011; ISAFRUIT, 2005):
• Pillar 1 – Improve the response of the supply chain
to consumer demands
• Pillar 2 – Develop greater understanding of the link
between fruit consumption and health
• Pillar 3 – Improve the attractiveness and nutritive
value of processed fruit
• Pillar 4 – Improve quality, security and sustain -ability of fruit production component
• Pillar 5 – Develop greater quality and sustainability
of the post-harvest fruit chain
• Pillar 6 – Study the genetic basis for fruit quality
and develop better fruit cultivars
• Pillar 7 – Improve the transfer of knowledge • Pillar 8 – Generate greater coordination among
projects and with the citizens
FUTURE CHALLENGES FOR
THE FRUIT INDUSTRY
Due to changes in markets, environments, economical developments, human nutrition and pref-erences, the situation of the fruit is evolving and this establishes various challenges into the future. These include:
Climate Change: Climate change and vari-ability is a major driver for all crops. This has implications on irrigation (both water quantity and quality), heat stress and lack of chilling hours, rising input costs, major crop losses from severe weather events, increased risks of exotic disease incursions and changes in the distribution of pests and diseases. Increased global trade is both a threat and an oppor-tunity. The need for international competitiveness is a major driver for the industries impacted. At the same time, increased imports heighten the biosecurity risk of exotic pest and disease incursions (NHRN-AUSTRALIA, 2010).
Labor: Issues related to labor (availability, productivity, and cost) have a major impact on the fruit industry- especially those that are faced with the challenge of being globally competitive. The fruit industry is labor intensive. Mechanization to replace labor and machines or techniques to make
existing labor more efficient are major drivers for
the fruit industry (Bravo, 2011; NHRN-Australia, 2010). However, for long distance export of fresh fruit mechanization might not be a viable alternative. Supply Chain: The fruit industry is moving towards reduction in supply chain costs and losses and mini-mal time to market (NHRN-AUSTRALIA, 2010). Of the many improvements that are needed, post-harvest handling, storage and marketing are salient aspects that need immediate attention, since there is dynamism in the industry as new areas and cultivars that are constantly being developed to face the new conditions and demands (GEORGE, 1999). There is a need for more communication and transparency between seller and producer (BRAVO, 2011). These changes have raised issues related to traceability and identity of produce and has given rise to innovation in IT systems for supply chain management (NHRN-AUSTRALIA, 2010).
Consumer expectations: Increased expecta-tions related to high product quality (e.g. appear-ance and size, freedom from residues, eating quality and shelf life), competitive pricing and year round supply are a major challenge for all components of the fruit production and marketing chain. This will require new plant material, innovative production and handling techniques, as well as postharvest and processing procedures. Recent developments in precision agriculture, molecular biology, phenomics, crop modelling and post harvest physiology should provide substantial advances in these issues.
Increasing availability of information requires all the components of the fruit chain to keep records and develop practices that are both sustainable for the environment and safe for the consumers.
TABLE 1 - World area planted to temperate fruit production and changes in different periods. Source: FAO, 2006; Granatstein et al., 2008.
Fruit crop 2006 (ha* 1000) Changes in world area harvested (%)
1961-2006 1986-1996 1996-2006
Apple 4,786 182 35 -24
Pear 1,670 234 48 11
Cherry 341 265 16 -2
Peach 1,448 164 23 9
Plum 2,154 446 37 20
Kiwi 73 --- 68 29
Strawberry 264 180 13 17
Raspberry 165 236 23 23
TABLE 2 - Global trends for the 1961-1998 period of fruit and vegetable supply according to income. Source: Pollack, 2000.
I n c o m e o f countries
Fruit and vegetable supply (kg/person/year)
1961 1970 1980 1990 1998 Expansion (%) 1961-1998
Low 78 79 80 81 86 11
Mid 120 132 154 161 170 14
High 148 178 194 214 223 14
FIGURE 1 - Areas of the world with Mediterranean climate Source: Vio et al., 2009.
FIGURE 3 - Main fruit producers for the 1996-2003 period. Source: USDA, 2006.
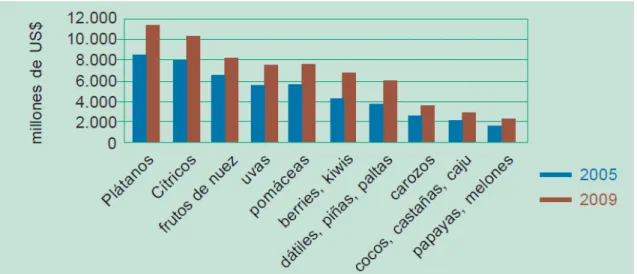
FIGURE 5- Value of world imports for some the most important fruit species in the 2005-2009 period. Source: Bravo, 2011.
FIGURE 7 - Main fruit (fresh + processed) importing countries for the 2005-2009 period. Source: Bravo, 2011
FIGURE 9 - Percentage of fresh fruit production for export, 2003, by quantity. Source: USDA, 2006.
FIGURE 10 - Consumption of fresh fruit (tropical and temperate) in the USA for the 1975-2005 period. Source: Granatstein et al., 2008.
CONCLUDING REMARKS
Temperate fruit production occupied 23.5 million ha in 2009. The rate of growth was higher for blueberries and plums. Nearly 50% of total pro-duction is concentrated in China, USA, Brazil and European Union. In recent years, global value of fruit has increased despite lower prices. Year-round fruit demand by consumers and improved post harvest technologies have promoted international fruit trade. The main markets for fruit exports are USA, Europe and Russian Federation. USA, Europe and Chile have each > 10% of market share. Chile is the country that exports the highest proportion of its fruit production (45%); in the other extreme, Brazil and China export < 2%. About half of the fruit consumed worldwide
is from temperate crops. Consumption has expanded
due to higher income, health benefits and promotion.
However, consumption is less than half of medically desirable. The mid- and high-income countries have expanded fruit consumption at a faster rate than low income countries. The fruit industry has important challenges or drivers that have to be faced in order to remain competitive, among them are: 1.- Climate change (irrigation, diseases, water and temperature stress, greater losses and increased costs), 2.- labor
(cost, availability, efficiency), which should promote
REFERENCES
BRAVO, J.. El mercado de fruta fresca 2010. In: Disponível em: <www.odepa.cl/odepaweb/publi-caciones/doc/2474.pdf> . Aceeso em: 12 jul. 2011 FAO. Agricultural statistics. 2009. Disponível em: <www.faostat.fao.org/site/567/DesktopDefault. aspx?PageID=567#ancor>. Acesso em: 23 jun. 2011.
GEORGE, A.P. Deciduous fruit production in Australia. 1999. Disponível em: <www.fao.org/ docrep/004/ab985e/ab985e00.htm>. Acesso em: 18 jul. 2011.
GRANATSTEIN, D; KIRBY, E;. WILLER, H.
Current world status of organic temperate fruits. 2008. Disponível em: <organic.tfrec.wsu.edu/or-ganicstats/granatstein_world_status_june08.pdf >. Acesso em: 23 jun. 2011
ISAFRUIT.2005.Disponívelem:<www.eufrin. obstpage.de/Documents/Update_ISAFRUIT_Calle-son_17.11.05.pdf>. Acesso em: 18 jul. 2011
KING, B. S.; TIETYEN, J. L.; VICKNER, S.S. Food and agriculture: consumer trends and opportunities: fruits. 1999. Disponível em: <www.ca.uky.edu/agc/ pubs/ip/ip58d/ip58d.htm>. Acesso em: 18 jul. 2011.
NHRN. National Horticultural Research Network.
National RD&E framework for horticulture: A plan for future investment in Australia`s horticul-tural industries. 2010. Disponível em: <www.daff.
gov.au/__data/assets/pdf_file/.../npi-_national-hort --strategy.pdf >. Acesso em: 18 jul. 2011.
POLLACK, S.L. Consumer demand for fruit and vegetables: The U.S. example. 2000. Disponível em: <www.ers.usda.gov/publications/wrs011/wrs011h. pdf>. Acesso em: 18 jul. 2011.
USDA. The World fresh fruit market. 2006. Disponível em: <www.fas.usda.gov/htp/Hort_Cir-cular/2006/0206/World%20Fresh%20Fruit%20 Market%202004.pdf>. Acesso em: 13 jul. 2011.
VIO, M., ETCHEGARAY, M.J. ; IOANNIDIS, D.; FERREIRA, Y I. Formación de capacidades huma-nas en biotecnología aplicable a la fruticultura en Chile: diagnóstico. Santiago de Chile: Programa de Investigación Asociativa de Conicyt, 2009. 266 p.