CHEMICAL CHANGES IN ARGISOLS UNDER IRRIGATED
GRAPE PRODUCTION IN THE CENTRAL SÃO FRANCISCO
RIVER VALLEY, BRAZIL
(1)R. J. HECK(2), H. TIESSEN(3), M. C. SANTOS(4), I. H. SALCEDO(5) & R. J. T. ALVES(6)
SUMMARY
This study compares the chemical composition of the solution and exchange complex of soil in a 3-year-old irrigated vineyard (Vitis vinifera L., Red Globe cultivar) with that of adjacent clearing in the native hyperxerophyllic ‘caatinga’ vegetation. The soils are classified as Plinthic Eutrophic Red-Yellow Argisol; according to Soil Taxonomy they are isohyperthermic Plinthustalfs. Detailed physiographic characterization revealed an impermeable gravel and cobble covering the crystalline rocks; the relief of this layer was more undulating than the level surface. Significant higher concentrations of extractable Na, K, Mg and Ca were observed within the vineyard. Lower soil acidity, higher Ca/Mg ratios, as well as lower sodium adsorption and Na/K ratios reflected additions of dolomitic lime, superphosphate and K-bearing fertilizers. As the water of the São Francisco River is of good quality for irrigation (C1S1), the increases in Na were primarily attributed to capillary rise from the saline groundwater table. None of the soil in the study area was found to be sodic. About 62% of the vineyard had an Ap horizon with salinity levels above 1.5 dS m-1 (considered detrimental for grape production); according to average values for this horizon, a potential 13% reduction in grape production was predicted. Differences in chemical composition in function of distance to the collector canals were observed in the clearing, but not in the vineyard. The influence of differences in the elevations of the surface and impermeable layers, as well as pediment thickness, was generally weaker under irrigation. Under irrigation, soil moisture was greater in points of convergent surface waterflow; the effect of surface curvature on chemical properties, though less consistent, was also stronger in the vineyard.
Index terms: vineyard, physiography, moisture content, exchangeable cations, electrical conductivity, soluble cations, sodicity, acidity.
(1) Financiado pelo convênio UFRPE/UofS/CIDA e apresentado no XXV Congresso Brasileiro de Ciência do Solo, Viçosa, 1995.
Rece-bido para publicação em março de 1999 e aprovado em julho de 2001.
(2) Professor Assistente, University of Guelph, Guelph (ON), N1G 2W1, Canada.
(3) Professor, University of Saskatchewan, 51 Campus Drive, Saskatoon (SK), S7N 5A8, Canada.
(4) Professor Adjunto da Universidade Federal Rural de Pernambuco – UFRPE. Rua Dom Manoel de Medeiros, s/n, Dois Irmãos,
CEP 52171-900 Recife (PE).
(5) Professor Titular da Universidade Federal de Pernambuco – UFPE. Rua Luiz Guimarães 326, CEP 52061-000 Recife (PE).
Bolsista do CNPq.
(6) Mestrando em Agronomia, UFRPE.
RESUMO: MUDANÇAS QUÍMICAS EM ARGISSOLOS SOB VITICULTURA IRRIGADA NO VALE DO MÉDIO RIO SÃO FRANCISCO
O estudo compara a composição química da solução e o complexo de troca catiônica de Argissolos Vermelho-Amarelos eutróficos plínticos (isohyperthermic Plinthustalf em Soil Taxonomy) com cultura irrigada de uva (Vitis vinifera L., cultivar “Red Globe”), com solos similares de área contígua, desmatada de sua vegetação natural de caatinga hiperxerófila. Levantamento fisiográfico da área caracterizou os relevos de superfície e subsuperfície e as condições de microvariações em direcionamento e curvaturas do relevo superficial. O relevo subsuperficial, mais ondulado que o de superfície, é definido pela oscilação de camada impermeável com espessura variável, constituída de cascalhos e calhaus de quartzo, base do pedimento que recobre o embasamento cristalino na região. O efeito das curvaturas do relevo superficial foi evidente na maior umidade do solo da área irrigada e menos consistente em suas propriedades químicas. Grande parte dos acréscimos observados nos teores de Ca, Mg e K, extraídos por NH4Cl, foi atribuída ao manejo dos solos com irrigação, fertilizações
e corretivos; acréscimos nos teores de Na indicam ascensão capilar de água do lençol freático à razão aproximada anual de 60 L m-2. Não foram detectados teores críticos de sódio, mas
foram observados horizontes salinos, empecialmente nos Ap, estimando-se que devem contribuir para um decréscimo de cerca de 13% no potencial produtivo de uvas. Decréscimos em acidez dos solos e acréscimos nas razões Ca/Mg refletiram adições de calcário dolomítico e fertilizantes fosfatados. Foram, também, observadas variações em propriedades dos solos conforme a distância para o canal de drenagem, atribuídas à deposição de detritos durante escavações deste canal.
Termos de indexação: videira, fisiografia, umidade do solo, cations trocáveis, condutividade elétrica, cátions solúveis, sodicidade, acidez.
INTRODUCTION
Irrigated grape (Vitis vinifera L.) production is
one of the most economically important agricultural activities in the Central São Francisco River Valley. Harvest normally occurs twice a year: in July or August after 120-130 days of vegetative growth and in late December after 100 days of vegetative growth (Lakatos, 1995). But, given the favorable climatic conditions, up to two and one-half productive cycles can be induced each year (Magalhães, 1995); in such situations, annual production varies from 34 to 40 t ha-1.
At planting, the soils are limed and fertilized according to an initial soil analysis. Subsequent soil management is based on production cycles (Magalhães, 1995); soil analyses are conducted every second year, but recommendations are adjusted according to foliar analysis done during every flowering. Applications are normally divided throughout the production cycle: eight days before pruning, at budding (20 days), after thinning (45-50 days), then again at 70 and 90 days after pruning. The traditional fertilizers applied are urea and superphosphate as well as potassium chloride, which, due to chloride toxicity, is now being substituted by potassium sulfate. As indicated by Pereira & Cordeiro (1987), the São Francisco River water presents no salinity or sodicity hazards for irrigation (classified as C1S1, according to Richards [1954]).
Pereira & Cordeiro (1987) evaluated the impact of such grape production on certain chemical properties of Vertisols. After 17 years, the surface horizon had suffered a decrease in pH, an increase in electrical conductivity and exchangeable K, but only minimal changes in exchangeable Ca, Mg and Na. Despite these changes, production had not been significantly jeopardized. According to Maas (1986), however, the growth of grapes will be decreased at a
rate of 9.6% per dS m-1, for levels of salinity above
1.5 dS m-1.
have influenced the spatial variability of salinity and acidity of these Argisols. Understanding the cause of this variability is fundamental to developing suitable soil monitoring and management schemes. A similar study was conducted by Heck et al. (2001) under irrigated mangos. Recognizing the impact that variations in local physiography can have on soil properties (Pennock et al., 1987; Pennock & De Jong, 1991), results are evaluated with respect to surface landform, pediment thickness as well as elevation of the impermeable (actually gravel and cobble) layer. Special consideration is also given here to the influence of distance to collector canals and grapevines.
MATERIAL AND METHODS
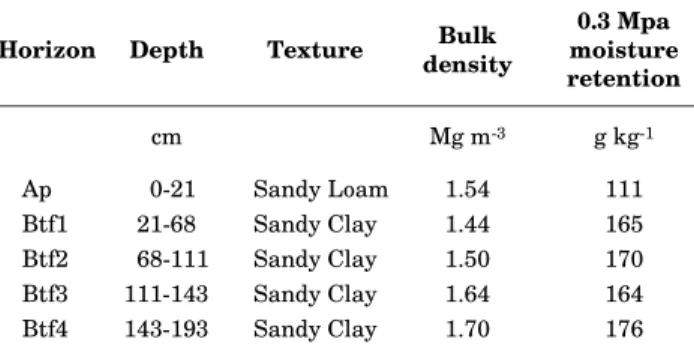
The area selected for this study is ‘Fazenda Garibaldina’ (9° 4’ S, 40° 8’ W), a large grape plantation located in the municipality of Lagoa Grande, Pernambuco. According to the Köeppen classification system, the climate of the area is Bswh’, very hot (mean annual temperature 26°C) and semi-arid; the majority of the annual precipitation (400 mm) falls during the winter season (Jacomine et al., 1973; CODEVASF, 1976). The natural vegetation is hyperxerophyllic ‘caatinga’. The soils are developed on level medium over clayey textured pediments, and are classified as Argissolo Vermelho-Amarelo eutrófico plíntico (Plinthic Eutrophic Red-Yellow Argisol) (EMBRAPA, 1999). According to Soil Taxonomy, they are classified as isohyperthermic Plinthustult (Soil Survey Staff, 1998). Selected physical characteristics of this soil are provided in table 1. At the time of sampling (April, 1994), the
area consisted of a 3 year-old irrigated vineyard (Vitis
vinifera L., Red Glode cultivar), with approximately 3 x 3.5 m plant spacing, adjacent to a recent clearing in the native ‘caatinga’ vegetation. Artificial drainage was accomplished by collector canals about 1.3 m deep, 0.5 m wide and spaced by 30 m.
Table 1. Selected physical characteristics of the soil studied(1)
(1) Based on Souto Maior (1996).
Horizon Depth Texture densityBulk moisture0.3 Mpa retention
cm Mg m-3 g kg-1
Ap 0-21 Sandy Loam 1.54 111
Btf1 21-68 Sandy Clay 1.44 165
Btf2 68-111 Sandy Clay 1.50 170
Btf3 111-143 Sandy Clay 1.64 164
Btf4 143-193 Sandy Clay 1.70 176
At planting time, approximately 55 kg ha-1 of
urea, 504 kg ha-1 of superphosphate and 44 kg ha-1
of potassium chloride had been applied (data based on personal communication with plantation agronomist at sampling time). During subsequent
production cycle, approximately 154 kg ha-1 of urea,
132 kg ha-1 of superphosphate and 395 kg ha-1 of
potassium sulfate were usually applied as fertigation, as well as 50 kg of dolomitic lime per row (approximately 100 m long). Normally, about 6 mm of irrigation water was applied daily during production, though adjacent lines were activated on an eight-day cycle.
Prior to sampling, a 12 x 12 grid was demarcated; roughly 60% in the vineyard and 40% in the clearing. While the east-west distance between points was 10 m, the north-south distance varied slightly since they were placed in every third row of vines (about 10 m); the total area covered was 1.21 ha. Thus, the distance between sampling points and grapevines varied from 0.3 to 1.8 m; one half occurred at less than 1 m distance. A theodolite was used to measure the surface elevation of each node, relative to a local datum (lowest point measured). The depth to the underlying impermeable layer was also determined through auger holes at each node point.
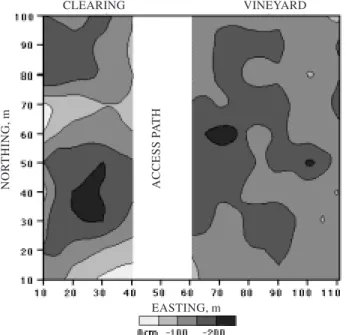
Contour maps of soil properties were generated from the elevation data, by the ‘moving weighted least squares’ gridding method of the software MacGridzo (1990). The surface of the study area is plan with an overall slope of less than 1% (Figure 1). Though the pediment overlying the impermeable layer was less than 0.6 m thick in the southeast quadrant, it exceeded 1 m in most of the study area. The elevation of the underlying impermeable layer is also not significantly different in the two sub-areas (Figure 2), but it is more undulating than the surface and contains several depressions, some of which would not be completely drained by the collector channels.
analysis. Following gravimetric determination of field moisture, the soil samples were air dried and crushed to pass a 2 mm sieve. Electrical conductivity
Figure 1. Surface elevation map of the Fazenda Garibaldina study site. The lowest relative elevation measured is taken as the local datum. Arrows indicate slope direction calculated from the digital elevation model by the program TOPO (see text); thick parallel lines represent collector canals.
Figure 2. Elevation map of the subsurface impermea-ble layer. The local datum is the same as in figure 1.
CLEARING VINEYARD
NOR
THING, m
ACCESS P
A
TH
EASTING, m
CLEARING VINEYARD
EASTING, m
NOR
THING, m
ACCESS P
A
TH
was determined in water (1:1 and saturated paste)
extracts, pH in 1 mol L-1 KCl and water extracts by
direct potentiometry, and extractable bases were
obtained by 24 hr reaction with 1 mol L-1 NH
4Cl
solution in a 1:10 ratio. The concentration of soluble and extractable cations were determined by atomic emission (Na and K) or atomic absorption (Mg and Ca) spectroscopy. Sodium adsorption ratios (SAR) were calculated from cation concentrations according to the equation:
SAR = [Na] / ([Ca] + [Mg])0.5 (1)
where [ ] signifies solution concentration in mmol L-1.
Statistical analysis of differences were conducted using the non-parametric tests Wilcoxon Signed-Rank (for comparison of values in the two horizons), Mann-Whitney U (for comparison of values in groupings of values based on sub-area, distance from grapevine stems and surface curvature) and Kruskal-Wallis (for comparison of groupings of values based on distance to the collector canals and quartiles of other properties) of the software ‘STATVIEW SE + GRAPHICS’ (1988). The Spearman rank correlation test was used to obtain coefficients
of correlation (rs) between groups of data. In general,
statistical probabilities of up to 10% were considered to be significant; unless specifically indicated, however, the level was less than 5%. The use of less rigorous probability levels (up to 20%) is well accepted in landscape-based studies (Pennock et al., 1994; Corre et al., 1996; Beckie et al., 1997).
RESULTS AND DISCUSSION
Production inputs
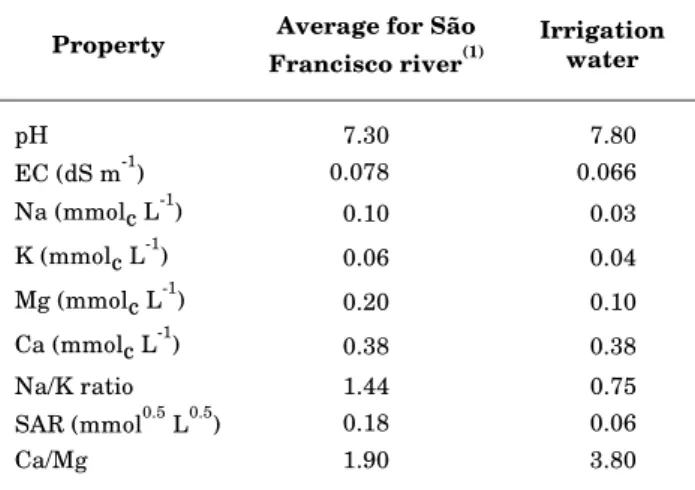
The water sample obtained from the active irrigation system was slightly less saline and sodic than the average reported for the São Francisco River (Table 2). Assuming 230 days of irrigation per
year (Lakatos, 1995), about 4.100 L m-2 would have
been applied in the three years since planting. Based on the average composition of the river water, this
would have contributed about 0.41 mol m-2 of Na,
0.25 of K, 0.41 of Mg and 0.78 of Ca to the soil. Superphosphate fertilizer applied to soils in Pernambuco generally contains 18% Ca and the potassium chloride fertilizer contains 48% K (Cavalcanti, 1998). Therefore, approximately, about
0.23 mol m-2 of Ca and 0.06 mol m-2 of K would have
been applied at planting. Assuming further that the potassium sulfate fertilizer contains 40% K and 0.6%
Mg, a total of 0.36 mol m-2 of Ca, 2.67 mol m-2 of K
and 0.06 mol m-2 of Mg would have also been applied
Table 2. Chemical composition of the São Francisco River water and irrigation water at the study site
urea applied during this period had the potential to
neutralize 0.08 kg m-2 of CaCO
3 (Cavalcanti, 1998),
equivalent to about 0.09 kg m-2 of dolomitic lime
(assuming 82% dolomite according to the Ca assay); this is much less than the lime added.
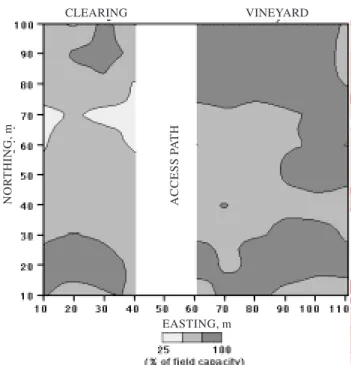
Soil moisture
The soil in the vineyard contained more moisture at all depths than that in the clearing (Table 3), regardless of distance to collector canals or grapevines. Furthermore, rows with active irrigation lines at sampling time (at 10, 30, 50, 70 and 90 m northing in the figures) contained more moisture; this difference was statistically significant for the
(1) From Pereira & Cordeiro (1987).
Property Average for São Francisco river(1)
Irrigation water
pH 7.30 7.80
EC (dS m-1) 0.078 0.066
Na (mmolc L-1) 0.10 0.03
K (mmolc L-1) 0.06 0.04
Mg (mmolc L-1) 0.20 0.10
Ca (mmolc L-1) 0.38 0.38
Na/K ratio 1.44 0.75
SAR (mmol0.5 L0.5) 0.18 0.06
Ca/Mg 1.90 3.80
(1) 0.3 Mpa. (2) Numbers in parentheses represent coefficients of variation. (3) Capital letters compare sub-areas; small letters,
distances to grapevines; and Greek letters, horizons.
Clearing Vineyard
Distance to collector canals (m)
Distance to collector canals (m)
Distance to plant (m) Horizon All
0-5 5-10 10-15
All
0-5 5-10 10-15 0-1 1-2
Cases: 40 16 8 16 60 24 12 24 30 30
Absolute, g kg-1
Ap 56 (25)(2) Bγ(2) 57 Baγ 60 Baβ 53 Baβ 93 (26) Aγ 102 Aaγ 92 Aabβ 85 Abγ 100 Aaγ 87 Abγ
Btf1 100 (20) Bβ 108 Baβ 98 Babα 94 Bbα 128 (17) Aβ 133 Aaβ 124 Aaα 126 Aaβ 131 Aaβ 126 Aaβ
Btf2 110 (22) Bα 125 Baα 103 Bbα 96 Bbα 140 (16) Aα 146 Aaα 125 Abα 141 Aaα 142 Aaα 138 Aaα
Relative to field capacity(1)
Ap 0.50 (22) Bβ 0.52 Baβ 0.48 Baα 0.49 Baα 0.86 (24) Aα 0.88 Aaα 0.83 Aaα 0.86 Aaα 0.97 Aaα 0.78 Abα
Btf2 0.64 (24) Bα 0.73 Baα 0.59 Abα 0.57 Bbα 0.77 (12) Aβ 0.80 Aaα 0.70 Abα 0.77Aabα 0.78 Aaβ 0.76 Aaα
Table 3. Field soil water content(1), according to sub-area as well as distance to collector canals and plants
Ap horizons. Moderate correlations in absolute
(rs =0.36*) and relative (rs =0.36) moisture content
were observed between the Ap and Btf2 horizons in the clearing; however, correlations in the vineyard were not significant. Apparently irrigation has had a stronger impact near the soil surface.
In both sub-areas, the absolute soil moisture content increased with depth (Table 3). A similar trend was observed relative to field capacity only in the clearing; in the vineyard, and especially closer to the grapevines, the Ap horizon was wetter than the Btf2. This larger retention of water is likely due to a greater organic matter content near the grapevines (Heck et al., 2001). The Btf2 horizons were also generally wetter near the collector canals, possibly due to standing water in the canals. In the vineyard, the Ap horizon also contained more moisture near the collector canals but showed no difference relative to field capacity; this can be attributed to the increase in moisture retention resulting from the deposition of fine-textured material during excavation (Santos et al., 2001).
comparison of figures 3 and 1 also revealed greater moisture in points where water converges from several landscape elements.
NH4Cl-Extractable basic cations
According to quartile analysis, none of the four basic cations (Na, K, Mg, Ca) extracted from the Ap
horizon (both sub-areas) by NH4Cl solution exhibited
a significant relationship to the relative elevation of the soil surface, to the thickness of the pediment, nor to the elevation of the impermeable layer. Sodium in the Btf1 and Btf2 horizons also did not exhibit a significant relationship to these features. Greater concentrations of K did occur in the Btf2 horizon at the highest points (and vice versa) in the clearing, but not in the vineyard. In both sub-areas, the larger K concentrations were found where the pediment was thinnest and the impermeable layer was highest. Though not evident in the clearing, the highest points in the vineyard also exhibited
Table 4. Comparison of selected properties between landscape elements with concave and convex surface curvature
(1) Ext = NH
4Cl-solution extractable; 1:1 = 1:1 water extracts;
KCl = 1 mol L-1 KCl-solution extractable; sat = saturated paste
extracts. (2) Soil water content at sampling time. (3) Inequality
symbols indicate significant differences at p < 10%; nd = not determined.
Profile curvature Plan curvature
Property
horizon(1) Ap Btf1 Btf2 Ap Btf1 Btf2
Concave x convex
Water(2)Grapes = = = > > >
Naext Grapes <(3) = = = = =
Clearing = = > = = =
Kext Grapes < = = = = >
Caext Grapes < < = = = =
Clearing = = = < < =
Mgext Grapes < < = = = =
Clearing < = = = = =
Ca/Mgext Clearing = = = < = =
pH 1:1 Grapes = = = > > =
pHKCl Clearing = < = = = =
∆pH Grapes = = = = > >
pHsat Grapes < nd = = nd >
Ksat Grapes = nd = > nd =
Clearing = nd = = nd >
Casat Grapes = nd < = nd =
Mgsat Grapes < nd < = nd =
Na/Ksat Grapes = nd > = nd =
Clearing = nd = = nd <
Ca/Mgsat Grapes < nd = = nd =
Clearing > Nd = = nd =
SARsat Grapes = Nd > = nd =
larger concentrations of Ca in the Btf1 horizon (and vice versa), but no significant relationship to pediment thickness or impermeable layer depth. The trends observed with K and Ca are consistent with the retention of water. In contrast, Mg concentrations in the Btf1 horizons of the clearing were generally smaller where the pediment was thinnest and the impermeable layer the highest (and vice versa).
A comparison of NH4Cl-extractable cation
concentrations, in function of surface curvature, also reveals trends consistent with the notion of convergence of water in concave elements (Table 4). Landscape elements with concave profile curvature and, to a lesser extent, with concave plan curvature, exhibited smaller concentrations in the Ap and Btf1 horizons; especially within the vineyard. A subsequent tendency for accumulation of monovalent cations in the Btf2 was also observed.
With the exception of K in the clearing, no
significant differences were observed in NH4
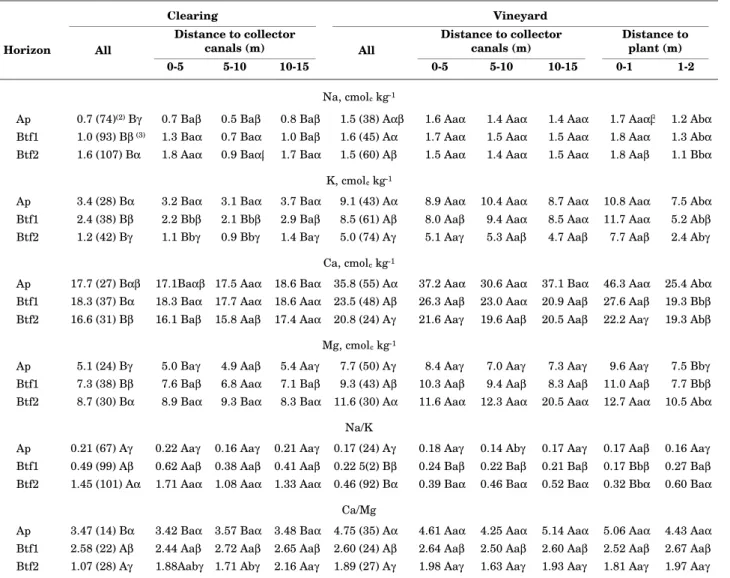
Cl-extractable cation concentrations in relation to distance from the collector canals in either sub-area (Table 5). While profile trends observed for Mg (increase with depth) as well as K and Ca (decrease with depth) in the vineyard were similar to that observed in the clearing, the increase in Na with depth observed in the clearing was absent under grape production. Within the vineyard, greater cation concentrations were also consistently found closer to the grapevines; this can be attributed to both the localized application of fertilizer and extraction of soil water by plant roots.
CLEARING VINEYARD
NOR
THING, m
ACCESS P
A
TH
EASTING, m
Unlike the findings of Pereira & Cordeiro (1987)
on Vertisols, concentrations of NH4Cl -extractable
cations were generally significantly greater in the vineyard than in the clearing, especially for points closer to the grapevines (Table 5). Considering the bulk density for each horizon as indicated in table 1,
the increase in content of NH4Cl-extractable cations
to a depth of 0.9 m was about 5.8 mol m-2 of Na,
6.9 mol m-2 of K, 1.7 mol m-2 of Mg and 6.2 mol m-2
of Ca. The increases in Ca and Mg contents can be explained by considering the production inputs described above. In the case of K and especially Na, however, the inputs calculated from the information available fall short of the increase observed in the soil. The change in the Na content is more than ten times the amount apparently applied in the irrigation water. Part of this increase may also be
Table 5. Average composition of 1 mol L-1 NH
4Cl-extractable cations, according to sub-area as well as distance to collector canals and plants(1)
(1) Based on Alves (1997). (2) Numbers in parentheses represent coefficients of variation. (3) Capital letters compare sub-areas; small
letters, distances to grapevines; and Greek letters, horizons.
derived from the groundwater table; according to Souto Maior (1996), saturation extracts from the Btf4 horizons of a profile in this vineyard contained more
than 3 cmol L-1 of Na. For the observed change in
Na content to have originated from the groundwater
table, about 180 L m-2 of capillary rise must have
occurred. On an annual basis this is about 60 L m-2
(60 mm) or more than twice that estimated for slightly lighter textured soils under mango production (Heck et al., 2001).
Salinity
Despite the spatial differences in moisture holding capacity at saturation (Santos et al., 2001),
the EC of the 1:1 (EC1:1) and the saturated paste
(ECe) extracts exhibited very strong correlations in
both the Ap (rs = 0.96***) and Btf2 (rs = 0.95***)
Clearing Vineyard
Distance to collector
canals (m) Distance to collectorcanals (m) Distance toplant (m) Horizon All
0-5 5-10 10-15
All
0-5 5-10 10-15 0-1 1-2
Na, cmolc kg-1
Ap 0.7 (74)(2) Bγ 0.7 Baβ 0.5 Baβ 0.8 Baβ 1.5 (38) Aαβ 1.6 Aaα 1.4 Aaα 1.4 Aaα 1.7 Aaαβ 1.2 Abα
Btf1 1.0 (93) Bβ (3) 1.3 Baα 0.7 Baα 1.0 Baβ 1.6 (45) Aα 1.7 Aaα 1.5 Aaα 1.5 Aaα 1.8 Aaα 1.3 Abα
Btf2 1.6 (107) Bα 1.8 Aaα 0.9 Baαβ 1.7 Baα 1.5 (60) Aβ 1.5 Aaα 1.4 Aaα 1.5 Aaα 1.8 Aaβ 1.1 Bbα
K, cmolc kg-1
Ap 3.4 (28) Bα 3.2 Baα 3.1 Baα 3.7 Baα 9.1 (43) Aα 8.9 Aaα 10.4 Aaα 8.7 Aaα 10.8 Aaα 7.5 Abα
Btf1 2.4 (38) Bβ 2.2 Bbβ 2.1 Bbβ 2.9 Baβ 8.5 (61) Aβ 8.0 Aaβ 9.4 Aaα 8.5 Aaα 11.7 Aaα 5.2 Abβ
Btf2 1.2 (42) Bγ 1.1 Bbγ 0.9 Bbγ 1.4 Baγ 5.0 (74) Aγ 5.1 Aaγ 5.3 Aaβ 4.7 Aaβ 7.7 Aaβ 2.4 Abγ
Ca, cmolc kg-1
Ap 17.7 (27) Bαβ 17.1Baαβ 17.5 Aaα 18.6 Baα 35.8 (55) Aα 37.2 Aaα 30.6 Aaα 37.1 Baα 46.3 Aaα 25.4 Abα
Btf1 18.3 (37) Bα 18.3 Baα 17.7 Aaα 18.6 Aaα 23.5 (48) Aβ 26.3 Aaβ 23.0 Aaα 20.9 Aaβ 27.6 Aaβ 19.3 Bbβ
Btf2 16.6 (31) Bβ 16.1 Baβ 15.8 Aaβ 17.4 Aaα 20.8 (24) Aγ 21.6 Aaγ 19.6 Aaβ 20.5 Aaβ 22.2 Aaγ 19.3 Abβ
Mg, cmolc kg-1
Ap 5.1 (24) Bγ 5.0 Baγ 4.9 Aaβ 5.4 Aaγ 7.7 (50) Aγ 8.4 Aaγ 7.0 Aaγ 7.3 Aaγ 9.6 Aaγ 7.5 Bbγ
Btf1 7.3 (38) Bβ 7.6 Baβ 6.8 Aaα 7.1 Baβ 9.3 (43) Aβ 10.3 Aaβ 9.4 Aaβ 8.3 Aaβ 11.0 Aaβ 7.7 Bbβ
Btf2 8.7 (30) Bα 8.9 Baα 9.3 Baα 8.3 Baα 11.6 (30) Aα 11.6 Aaα 12.3 Aaα 20.5 Aaα 12.7 Aaα 10.5 Abα
Na/K
Ap 0.21 (67) Aγ 0.22 Aaγ 0.16 Aaγ 0.21 Aaγ 0.17 (24) Aγ 0.18 Aaγ 0.14 Abγ 0.17 Aaγ 0.17 Aaβ 0.16 Aaγ
Btf1 0.49 (99) Aβ 0.62 Aaβ 0.38 Aaβ 0.41 Aaβ 0.22 5(2) Bβ 0.24 Baβ 0.22 Baβ 0.21 Baβ 0.17 Bbβ 0.27 Baβ
Btf2 1.45 (101) Aα 1.71 Aaα 1.08 Aaα 1.33 Aaα 0.46 (92) Bα 0.39 Baα 0.46 Baα 0.52 Baα 0.32 Bbα 0.60 Baα
Ca/Mg
Ap 3.47 (14) Bα 3.42 Baα 3.57 Baα 3.48 Baα 4.75 (35) Aα 4.61 Aaα 4.25 Aaα 5.14 Aaα 5.06 Aaα 4.43 Aaα
Btf1 2.58 (22) Aβ 2.44 Aaβ 2.72 Aaβ 2.65 Aaβ 2.60 (24) Aβ 2.64 Aaβ 2.50 Aaβ 2.60 Aaβ 2.52 Aaβ 2.67 Aaβ
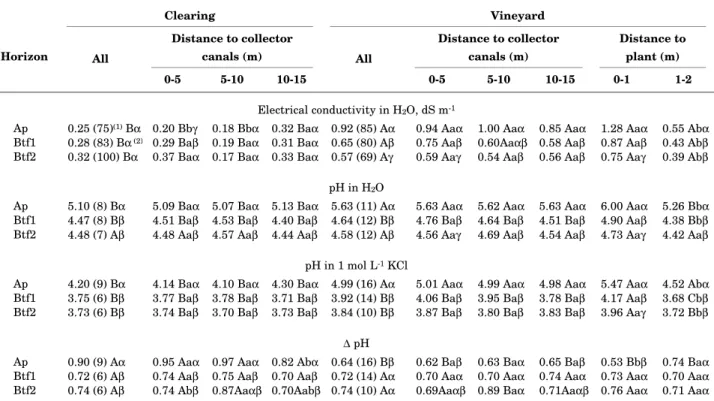
horizons. Results from both measures revealed a significantly higher degree of salinity in the vineyard than in the clearing (Tables 6 and 7). Such a change was not observed by Pereira & Cordeiro (1987) on the Vertisols they studied. Specifically, the area with
Ece > 1.5 dS m-1 (point at which grape production
begins to suffer, according to Maas, 1986) for the Ap horizon increased from 20 to 62%, for Btf2 from 13 to 33% and for both horizons from 10 to 28%.
Considering the average ECe of the Ap horizon
within 1 m of the plants (Table 6), the relation of Maas (1986) suggests a potential decrease in grape production of more than 13%.
The decrease in EC (for both extracts) observed with depth in the vineyard, but not in the clearing, also reflects a preferential salinization of the Ap horizon. In contrast, the trend observed for points up to 5 m from the collector canal in the clearing, suggests an enhanced leaching of salts. Despite
these differences, the correlation of EC1:1 values in
the Ap with those in the Btf1 and Btf2 were stronger
in the vineyard (rs = 0.75*** and 0.65*** respectively)
than in the clearing (rs = 0.65*** and 0.32*); the
correlation between the two Btf horizons was also
stronger in the vineyard (rs = 0.90*** vs 0.59***).
These results can be attributed directly to the application of chemical inputs, combined with an
intensification of moisture flux through the soil profile with irrigation and drainage.
Values of ECe were generally well correlated with
the concentrations of cations (especially the bivalent)
in the saturated paste extracts in the vineyard (rs =
0.88*** and 0.90*** for Ca in the Ap and Btf2 respectively; 0.83*** and 0.96*** for Mg; 0.45*** and 0.76*** for Na; 0.71*** and 0.55*** for K) and clearing
(rs = 0.95*** and 0.92*** for Ca in the Ap and Btf2
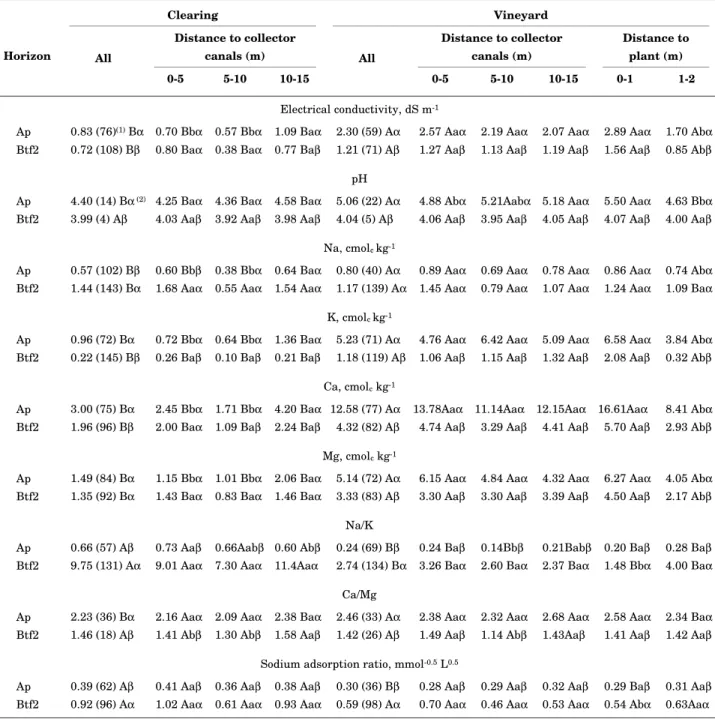
respectively; 0.96*** and 0.95*** for Mg; 0.81*** and 0.79*** for Na; 0.93*** and 0.42** for K). Accordingly, all four cations exhibited significantly larger concentrations in the vineyard than in the clearing, as well as closer to the grapevines (Table 7).
Furthermore, unlike the NH4Cl-extractable cations,
the concentration of all cations in the saturate paste extracts exhibited significantly lower values for the Ap horizons near the collector canals in the clearing. The lack of a similar difference in the vineyard can be attributed to relatively uniform fertigation and
liming. As with the NH4Cl-extractable cations,
however, the greater EC and cations concentrations of the saturate paste extracts near the grapevines also suggest a preferential accumulation due to water extraction by the plant roots.
In general, no significant influence of the elevation of the impermeable layer or thickness of
Table 6. Average composition of 1:1 soil extracts, according to sub-area as well as distance to collector canals and plants
(1) Numbers in parentheses represent coefficients of variation. (2) Capital letters compare sub-areas; small letters, distances to
grapevines; and Greek letters, horizons.
Clearing Vineyard
Distance to collector canals (m)
Distance to collector canals (m)
Distance to plant (m) Horizon All
0-5 5-10 10-15
All
0-5 5-10 10-15 0-1 1-2
Electrical conductivity in H2O, dS m-1
Ap 0.25 (75)(1) Bα 0.20 Bbγ 0.18 Bbα 0.32 Baα 0.92 (85) Aα 0.94 Aaα 1.00 Aaα 0.85 Aaα 1.28 Aaα 0.55 Abα
Btf1 0.28 (83) Bα (2) 0.29 Baβ 0.19 Baα 0.31 Baα 0.65 (80) Aβ 0.75 Aaβ 0.60Aaαβ 0.58 Aaβ 0.87 Aaβ 0.43 Abβ
Btf2 0.32 (100) Bα 0.37 Baα 0.17 Baα 0.33 Baα 0.57 (69) Aγ 0.59 Aaγ 0.54 Aaβ 0.56 Aaβ 0.75 Aaγ 0.39 Abβ
pH in H2O
Ap 5.10 (8) Bα 5.09 Baα 5.07 Baα 5.13 Baα 5.63 (11) Aα 5.63 Aaα 5.62 Aaα 5.63 Aaα 6.00 Aaα 5.26 Bbα
Btf1 4.47 (8) Bβ 4.51 Baβ 4.53 Baβ 4.40 Baβ 4.64 (12) Bβ 4.76 Baβ 4.64 Baβ 4.51 Baβ 4.90 Aaβ 4.38 Bbβ
Btf2 4.48 (7) Aβ 4.48 Aaβ 4.57 Aaβ 4.44 Aaβ 4.58 (12) Aβ 4.56 Aaγ 4.69 Aaβ 4.54 Aaβ 4.73 Aaγ 4.42 Aaβ
pH in 1 mol L-1 KCl
Ap 4.20 (9) Bα 4.14 Baα 4.10 Baα 4.30 Baα 4.99 (16) Aα 5.01 Aaα 4.99 Aaα 4.98 Aaα 5.47 Aaα 4.52 Abα
Btf1 3.75 (6) Bβ 3.77 Baβ 3.78 Baβ 3.71 Baβ 3.92 (14) Bβ 4.06 Baβ 3.95 Baβ 3.78 Baβ 4.17 Aaβ 3.68 Cbβ
Btf2 3.73 (6) Bβ 3.74 Baβ 3.70 Baβ 3.73 Baβ 3.84 (10) Bβ 3.87 Baβ 3.80 Baβ 3.83 Baβ 3.96 Aaγ 3.72 Bbβ
∆ pH
Ap 0.90 (9) Aα 0.95 Aaα 0.97 Aaα 0.82 Abα 0.64 (16) Bβ 0.62 Baβ 0.63 Baα 0.65 Baβ 0.53 Bbβ 0.74 Baα
Btf1 0.72 (6) Aβ 0.74 Aaβ 0.75 Aaβ 0.70 Aaβ 0.72 (14) Aα 0.70 Aaα 0.70 Aaα 0.74 Aaα 0.73 Aaα 0.70 Aaα
Table 7. Average composition of saturated paste extracts, according to sub-area as well as distance to collector canals and plants
the pediment was encountered for the salinity of the
water extracts. Similarly to the NH4Cl-extracts,
however, water soluble K in the Btf2 horizon of the vineyard exhibited the smallest values in the third quartile of pediment thickness. Lower EC and smaller concentrations of the bivalent cations were also generally encountered in the Ap horizon in the highest and lowest quartile of points in the clearing;
Clearing Vineyard
Distance to collector canals (m)
Distance to collector canals (m)
Distance to plant (m) Horizon All
0-5 5-10 10-15
All
0-5 5-10 10-15 0-1 1-2
Electrical conductivity, dS m-1
Ap 0.83 (76)(1) Bα 0.70 Bbα 0.57 Bbα 1.09 Baα 2.30 (59) Aα 2.57 Aaα 2.19 Aaα 2.07 Aaα 2.89 Aaα 1.70 Abα
Btf2 0.72 (108) Bβ 0.80 Baα 0.38 Baα 0.77 Baβ 1.21 (71) Aβ 1.27 Aaβ 1.13 Aaβ 1.19 Aaβ 1.56 Aaβ 0.85 Abβ
pH
Ap 4.40 (14) Bα (2) 4.25 Baα 4.36 Baα 4.58 Baα 5.06 (22) Aα 4.88 Abα 5.21Aabα 5.18 Aaα 5.50 Aaα 4.63 Bbα
Btf2 3.99 (4) Aβ 4.03 Aaβ 3.92 Aaβ 3.98 Aaβ 4.04 (5) Aβ 4.06 Aaβ 3.95 Aaβ 4.05 Aaβ 4.07 Aaβ 4.00 Aaβ
Na, cmolc kg-1
Ap 0.57 (102) Bβ 0.60 Bbβ 0.38 Bbα 0.64 Baα 0.80 (40) Aα 0.89 Aaα 0.69 Aaα 0.78 Aaα 0.86 Aaα 0.74 Abα
Btf2 1.44 (143) Bα 1.68 Aaα 0.55 Aaα 1.54 Aaα 1.17 (139) Aα 1.45 Aaα 0.79 Aaα 1.07 Aaα 1.24 Aaα 1.09 Baα
K, cmolc kg-1
Ap 0.96 (72) Bα 0.72 Bbα 0.64 Bbα 1.36 Baα 5.23 (71) Aα 4.76 Aaα 6.42 Aaα 5.09 Aaα 6.58 Aaα 3.84 Abα
Btf2 0.22 (145) Bβ 0.26 Baβ 0.10 Baβ 0.21 Baβ 1.18 (119) Aβ 1.06 Aaβ 1.15 Aaβ 1.32 Aaβ 2.08 Aaβ 0.32 Abβ
Ca, cmolc kg-1
Ap 3.00 (75) Bα 2.45 Bbα 1.71 Bbα 4.20 Baα 12.58 (77) Aα 13.78Aaα 11.14Aaα 12.15Aaα 16.61Aaα 8.41 Abα
Btf2 1.96 (96) Bβ 2.00 Baα 1.09 Baβ 2.24 Baβ 4.32 (82) Aβ 4.74 Aaβ 3.29 Aaβ 4.41 Aaβ 5.70 Aaβ 2.93 Abβ
Mg, cmolc kg-1
Ap 1.49 (84) Bα 1.15 Bbα 1.01 Bbα 2.06 Baα 5.14 (72) Aα 6.15 Aaα 4.84 Aaα 4.32 Aaα 6.27 Aaα 4.05 Abα
Btf2 1.35 (92) Bα 1.43 Baα 0.83 Baα 1.46 Baα 3.33 (83) Aβ 3.30 Aaβ 3.30 Aaβ 3.39 Aaβ 4.50 Aaβ 2.17 Abβ
Na/K
Ap 0.66 (57) Aβ 0.73 Aaβ 0.66Aabβ 0.60 Abβ 0.24 (69) Bβ 0.24 Baβ 0.14Bbβ 0.21Babβ 0.20 Baβ 0.28 Baβ
Btf2 9.75 (131) Aα 9.01 Aaα 7.30 Aaα 11.4Aaα 2.74 (134) Bα 3.26 Baα 2.60 Baα 2.37 Baα 1.48 Bbα 4.00 Baα
Ca/Mg
Ap 2.23 (36) Bα 2.16 Aaα 2.09 Aaα 2.38 Baα 2.46 (33) Aα 2.38 Aaα 2.32 Aaα 2.68 Aaα 2.58 Aaα 2.34 Baα
Btf2 1.46 (18) Aβ 1.41 Abβ 1.30 Abβ 1.58 Aaβ 1.42 (26) Aβ 1.49 Aaβ 1.14 Abβ 1.43Aaβ 1.41 Aaβ 1.42 Aaβ
Sodium adsorption ratio, mmol-0.5 L0.5
Ap 0.39 (62) Aβ 0.41 Aaβ 0.36 Aaβ 0.38 Aaβ 0.30 (36) Bβ 0.28 Aaβ 0.29 Aaβ 0.32 Aaβ 0.29 Baβ 0.31 Aaβ
Btf2 0.92 (96) Aα 1.02 Aaα 0.61 Aaα 0.93 Aaα 0.59 (98) Aα 0.70 Aaα 0.46 Aaα 0.53 Aaα 0.54 Abα 0.63Aaα
(1) Numbers in parentheses represent coefficients of variation. (2) Capital letters compare sub-areas; small letters, distances to
grapevines; and Greek letters, horizons.
Ca/Mg ratios
As indicated in tables 5 and 7, the ratio of Ca/Mg
in the NH4Cl - and saturated paste extracts was
higher in the Ap horizon and decreased with depth in both sub-areas. This pattern can be partially attributed to preferential uptake of Ca by plants.
In the NH4Cl extracts, as well as in the saturated
paste extracts, the Ca/Mg ratios in the Ap horizon of the vineyard were usually significantly larger than in the clearing. These changes are most likely due to the addition of dolomitic lime and, to a lesser extent to the irrigation water and fertilizers, all of which contained more Ca than Mg.
Despite the localized addition of superphosphate at planting, no significant differences in Ca/Mg ratios were observed in the extracts as a function of distance from the grapevines (Tables 5 and 7). Point within 1 m of the grapevines did, however, exhibit significantly larger ratios for the Ap horizon than those in the clearing. Consequently, in both sub-areas, no significant correlations were observed between the Ap and Btf2 horizons for the two extracts. Moreover, no consistent influence of canal distance was evident in the vineyard, while in the clearing smaller ratios were encountered in the Btf2 horizon for points within 10 m.
No significant influence of pediment thickness was observed for the Ca/Mg ratios in either the
NH4Cl or saturated paste extracts. The elevation of
the impermeable layer and soil surface also did not exert any detectable influence in the vineyard. In the clearing, however, larger ratios were found in saturated paste extracts of the Ap horizon at the points where the surface and impermeable layer elevations were lower (and vice versa). The same
behavior was also observed in the NH4Cl extracts
in relation to elevation of the surface. Similarly, only the ratios in the Ap horizons exhibited differences related to surface profile curvature (Table 4).
Sodicity
The ratios of Na/K in both the NH4Cl and
saturated paste extracts were generally significantly smaller in the Ap than in the Btf horizons (Table 5 and 7). As with the Ca/Mg ratios, this behavior can be partially attributed to preferential cycling of K by plants. The smaller Na/K ratios observed in the vineyard, as well as closer to the grapevines, were most likely caused by the addition of K-bearing fertilizers. Fertilizer-induced decreases in the Na/ K ratio have also been reported for irrigated Latosols (Pereira & Siqueira, 1979) and Vertisols (Pereira & Cordeiro, 1987) in the region. A lack of significant differences in Na/K ratios for the Ap horizon, between the two sub-areas, as well as in function of distance to the grapevines, likely reflects sodification from the irrigation and groundwater. The larger Na/ K ratios observed in the saturate paste extracts in the Ap horizons closer to the collector canals could
be attributed to the deposition of more sodium rich sub-surface material during canal construction (Santos et al., 2001) and a subsequent retardation of moisture infiltration.
Sodium adsorption ratios of the saturate paste extracts behaved similarly to Na/K in relation to profile depth and distance to grapevines, but showed no influence of distance to collector canals (Table 7). Furthermore, only the Ap horizon exhibited significantly smaller SAR in the vineyard than in the clearing. Though the values in the Ap horizon were less variable in the vineyard, the correlation between this horizon and the Btf2 were weaker in
the vineyard (rs = 0.30* vs rs = 0.61** in the clearing).
These results reflect the lower solubility and mobility of the Ca and Mg applied as superphosphate and dolomitic lime, as compared with the fertilizer K. None of the points examined were considered sodic (SAR > 13).
Neither the Na/K ratios nor the SAR were significantly influenced by the elevation of the impermeable layer in either sub-area. Pediment thickness also exerted no apparent influence in the clearing, but in the vineyard the Na/K ratios were significantly smaller in the quartile of points with next-to-thinnest pedimentary cover. In contrast, the influence of surface elevation was evident only in the clearing, where larger SAR and Na/K were found in the Ap horizons at lower points. Only the Btf2 horizons in the vineyard exhibited significant differences in both Na/K and SAR, due to landform (Table 4): larger values were found in elements with concave compared with convex profile curvature.
Acidity
As indicated by the pH measured in the water
(pH1;1, pHe) and 1 mol L-1 KCl (pHKCl) extracts, the
Ap horizons were less acid and contained less
exchangeable acidity (smaller ∆pH) in the vineyard
than in the clearing; no such significant differences occurred in the Btf horizons (Table 6 and 7). Consequently, the amount of exchangeable acidity in the vineyard was also significantly less in the Ap than the Btf horizons. These changes can be attributed directly to the application of lime. In contrast, the Vertisols studied by Pereira & Cordeiro (1987) were not limed and experienced an increase in acidity with the application of urea and ammonium fertilizers.
Like EC, the correlation between soil acidity in the Ap and the two Btf horizons was generally
stronger in the vineyard (rs = 0.63* and 0.25p = 0.06
for pHKCl in the Btf1 and Btf2; 0.54*** and 0.25**
for pH1:1; 0.42** and 0.42** for ∆pH) than in the
clearing (rs = 0.34* and 0.14 for pHKCl in the Btf1
and Btf2; 0.32* and 0.04 for pH1:1; 0.48** and 0.33*
attributed to localized lime applications; indeed,
larger pH and smaller ∆pH were observed closer to
the grapevines. Soil acidity was not noticeably influenced by distance to the collector canals.
Pediment thickness and depth to the impermeable layer did exert limited influence on acidity, but only
the pHKCl of the Btf1 horizon in the clearing
exhibited significantly lower values where the pediment was thinner. The acidity of the Ap horizon in the clearing was also related to surface elevation: significantly higher pH was observed at higher
elevations and lower ∆pH was observed in the
intermediate elevations. In the vineyard, only the
pHKCl was influenced by surface elevation, with the
lowest values being observed the next-to-lowest quartile of points. Though more frequent in the vineyard, the influence of landform on acidity was also limited (Table 4): elements with convex profile curvature and those with concave plan curvature were less acid.
CONCLUSIONS
1. Three years of irrigated grape production decreased soil acidity, but also caused slight increases in sodicity and significant increases in the degree of salinity; these changes were generally greater near the grapevines.
2. While the increase in the proportion of Ca and K could be associated with production inputs, the increase in Na was attributed to capillary rise from the saline groundwater table.
3. Preferential leaching of the Ap horizon near the collector canals was evident in the clearing, but not in the vineyard.
4. Though pediment thickness exerted minimal effect on the salinity of these soils, surface and impermeable layer elevation as well as surface curvature influenced variability.
LITERATURE CITED
ALVES, R.J.T. Efeito do cultivo e da irrigação na variabilidade espacial de bases trocáveis em dois solos Podzólicos de Pernambuco. Recife, Universidade Federal Rural de Pernambuco, 1997. 71p. (Tese de Mestrado)
BECKIE, H.J.; MOULIN, A.P. & PENNOCK, D.J. Strategies for variable rate nitrogen fertilization in hummocky terrrain. Can. J. Soil Sci., 77:589-595, 1997.
BURGOS, N.; SANTOS, J.C.P.; FILHO, J.C.A. & CAVALCANTI, A.C. Solos: Caracterização e ocorrência. In: CAVALCANTI, F.J.A., ed. Recomendações de adubação para o estado de Pernambuco. 2a Aproximação. Recife, Empresa
Pernambucana de Pesquisa Agropecuária-IPA, 1998. p.1-28.
CAVALCANTI, F.J.A. Recomendações de adubação para o estado de Pernambuco. 2º Aproximação. Empresa Pernambucana de Pesquisa Agropecuária-IPA, 1998. 198p.
COMPANHIA DE DESENVOLVIMENTO DO VALE DO SÃO FRANCISCO - CODEVASF. Projeto Massangano. Levantamento pedológico detalhado e classificação de terra para irrigação. Recife, GEOTÉCNICA S.A., 1976. v.1. CORRE, M.D.; VAN KESSEL, C. & PENNOCK, D.J. Landscape
and seasonal patterns of nitrous oxide emissions in a semiarid region. Soil Sci. Soc. Am. J., 60:1806-1815, 1996 EMPRESA BRASILEIRA DE PESQUISA AGROPECUÁRIA -EMBRAPA. Centro Nacional de Pesquisa de Solos. Sistema brasileira de classificacão de solos. Rio de Janeiro, 1999. 412p.
GOMES, H.A. Programa Levantamentos Geológicos Básicos do Brasil: carta geológica, carta metalogenética previsional. Escala 1:100 000 (folha SC.24-V-D-I Itamotinga) Estados de Pernambuco e Bahia. Brasilia, DNPM/CPRM, 1990. 115p. HECK, R.J.; TIESSEN, H.; ALVES, R.J.T.; SALCEDO; I.H. & SANTOS, M.C. Chemical Changes in Argisols under Irrigated Mango Production in the Central São Francisco River Valley, Brazil. J. Environ.Qual., 2001.
JACOMINE, P.K.T., CAVALCANTI, A.C., BURGOS, N. & PESSOA, S.C.P. Levantamento exploratório-reconhecimento de solos do estado de Pernambuco, Recife, MA/DNPEA-SUDENE/DRN, 1973. v.1 (Boletim Técnico, 26)
LAKATOS, T. Grape growing and wine making in tropical Brazil. J. Small Fruit Vitic., 3:3-14, 1995.
MAAS, E.V. Salt tolerance of plants. Appl. Agric. Res., 1:12-25, 1986.
MAGALHÃES, A.F. Manejo da fertilidade dos solos irrigados: produtividade, degradação e correção. In: PEREIRA, J.R. & FARIA, C.M.B., eds. Fertilizantes: Insumo básico para agricultura e combate á fome. In: REUNIÃO BRASILEIRO DE FERTILIDADE DO SOLO E NUTRIÇÃO DE PLANTAS, 21., Petrolina, 1995. Anais. Petrolina, EMBRAPA/CPATSA/SBCS, 1995. p.72-86.
MACGRIDZO. Gridding, contouring and base map plotting software for the macintosh. Version 3.04. Rockware, 1990. PENNOCK, D.J. A guide to the use of Program TOPO. Saskatoon, Department of Soil Science, University of Saskatchewan, 1993. 17p.
PENNOCK, D.J.; ANDERSON, D.W. & DE JONG, E. Landscape - scale changes in indicators of soil quality due to cultivation in Saskatchewan, Canada. Goederma, 64:1-19, 1994. PENNOCK, D.J. & DE JONG, E. Spatial pattern of soil
redistribution in Boroll landscapes, Southern Saskatchewan, Canada. Soil Sci., 150:867-873, 1991. PENNOCK, D.J.; ZEBARTH, B.J. & DE JONG, E. Landform
classification and soil distribution in hummocky terrain, Saskatchewan, Canada. Geoderma, 40:297-315, 1987. PEREIRA, J.R. & CORDEIRO, G.G. Efeito da irrigação e
PEREIRA, J.R. & SIQUEIRA, F.B. Alterações nas características químicas de um Oxissolo sob irrigação. Pesq. Agropec. Bras., 14:189-195, 1979.
RICHARDS, L.A. Diagnosis and improvement of saline and alkali soils. Washington, USA, Salinity Laboratory, 1954. 160p. SANTOS M.C., HECK R.J. & TIESSEN H. Variability of Texture and Water Retention in Irrigated Argisols in the Central São Francisco Valley, Brazil. R. Bras. Ci. Solo, 2001. (em composição)
SOIL SURVEY STAFF. Keys to soil taxonomy. 8.ed. Washington, USDA-NRCS, 1998. 327p.
SOUTO MAIOR, F.C. Podzólicos plínticos e os efeitos do cultivo de uva com irrigação no sub-médio São Francisco. Recife, Universidade Federal Rural de Pernambuco, 1996. 107p. (Tese de Mestrado)