Arboriculture for timber: Assessment of a mixed
plantation with nitrogen fixing accessory species
O
THMANE
MIMOUNI
Dissertation presented to the School of Agriculture of Bragança in
partial fulfilment of the requirements for the degree of Master of
Science in Forest Resources Management
Advisors
Maria do Sameiro Patrício (PhD)
School of Agriculture of Bragança (PORTUGAL)
Luís Filipe Nunes (PhD)
School of Agriculture of Bragança (PORTUGAL)
Abdelaziz MOKRIM (PhD)
Agronomic and Veterinary Institute Hassan II (MOROCCO)
I
A
CKNOWLEDGEMENT
First of all, I would like to thank my thesis advisor Professor Maria do Sameiro Patrício of the Escola Superior Agrária at the Polytechnic Institute of Bragança for the continuous support of my Master thesis research, for her patience, motivation, enthusiasm, and immense knowledge. Her guidance helped me in all the time of research and writing of this thesis.
My specials thanks go also to my co-advisor Professor Luís Filipe Nunes for his availability during the whole year, his kindness and guidance.
Besides my advisor, I would like to thank Professor Abdelaziz Mokrim for his encouragement and insightful comments.
I would like to thank Daniel Saraiva and Arsénio Araùjo for their immense help in collecting data on the field.
My sincere thanks also go to Professor Amílcar António Teiga Teixeira for his special and unconditional encouragements and motivation throughout the whole year.
I thank the Erasmus+ Project, namely to Professor Luis País, Vice-President of IPB, and to the International Relations Office (IRO), namely Professor Joana Aguiar and Professor Ines Rodrigues for their help and availability, to offer up this chance to do my Master Degree in Portugal.
Special thanks to all our professors, Professor João Paulo Miranda de Castro, José Paulo Mendes Guerra Marques Cortez, João Carlos Martins Azevedo for being available for me whenever we needed.
A big thank to Professor Nouredine Chtaina, Director of Agronomic department from Institut Agronomique et Vétérinnaire Hassan II in Morocco, as well as all our professors that came to visit us in Bragança for their encouragement to accomplish this work.
II
Abstract
The mixed plantation of valuable species with nitrogen-fixing species can increase the productivity levels for the target species. So, in 1998, in the framework of the Project
PRAXIS XXI – 3/3.2/Flor/2127/95, a mixture plantation trial with valuable broadleaved tree
species: wild cherry (Prunus avium L.), red oak (Quercus rubra L.) and sweet chestnut
(Castanea sativa Mill.) with the accessory species black locust, was established in a
substitutive or replacement series design in Vimioso (Latitude 41º34'12''N; Longitude 6º30'7''W and altitude 700 m), before the publication of decree law 565/99. A completely random experimental de-sign of 30 permanent sample plots with 10 treatments and 3 replications was adopted and two types of mixtures were considered (alternating lines of the objective-species with black locust and objective-species alternating with black locust in the line). The aim of this study is to evaluate the benefits for the objective-species when mixed with a nitrogen fixing species. In the dormancy of 2016/2017 the trial was measured but we consider only the treatments with wild cherry and red oak as objective-species and the black locust as accessory species. The plantations were assessed according to the survival rate, height and diameter growth, considering the dendrometric variables: height, diameter, coefficient of stability, and relative yield and relative yield total. Logistic regression was used to model the survival of the objective species in the mixture. The Wald Z test used showed that wild cherry is associated to a high probability of survival (64-75%) both in the pure treatment and in those mixed with black locust. For the red oak, the test indicated a low probability of survival mainly because of the breakdown verified in the establishment phase (46-55% survival at 10 years old) worsen by the strong black frost in the spring of 2010. Currently the survival of red oak ranges from 35 to 54%. For each species, the growth was compared among the different treatments using the least significant difference test (LSD). The treatment line-by-line of the wild cherry with black locust showed positive response in all assessment criteria, mainly survival rate (75%), the relative yield and the relative yield total, and height growth. The other mixtures presented either negative or non-significant results. The facilitation/complementarity effect promoted by the accessory species is evident only in the wild cherry.
Key words:
Forestry, Robinia pseudoacacia, Quercus rubra, Prunus avium, Survival rate, Target and
III
Resumo
A plantação mista de espécies produtoras de madeiras nobres com espécies fixadoras de azoto
pode incrementar a sua produtividade. Assim, em 1998, no âmbito do Projeto PRAXIS XXI –
3/3.2/Flor/2127/95, foi estabelecido um ensaio de consociação de folhosas nobres: cerejeira
brava (Prunus avium L.), carvalho americano (Quercus rubra L.) e castanheiro bravo
(Castanea sativa Mill.) com a espécie acessória robínia falsa-acácia, numa série substitutiva,
em Vimioso (Latitude 41º34'12''N; Longitude 6º30'7''W e altitude 700 m), antes da publicação do Decreto-Lei 565/99. O ensaio foi delineado em 30 parcelas de estudo permanentes estruturadas num desenho experimental aleatorizado com dez tratamentos e três repetições, sendo testados dois tipos de mistura (espécie objetivo ou principal alternada linha a linha com robínia e espécie objetivo alternada pé-a-pé com robínia). O objetivo deste estudo é avaliar os ganhos das espécies principais em mistura com uma fixadora de azoto. O ensaio foi medido novamente no repouso vegetativo de 2016/2017 mas neste estudo apenas se consideram os tratamentos com cerejeira e carvalho americano como espécies principais e a robínia como espécie acessória. O ensaio foi avaliado em termos de sobrevivência e crescimento em altura e em diâmetro. Para tal consideraram-se as seguintes variáveis: altura total, diâmetro, coeficiente de estabilidade e produção relativa e produção relativa total. Foi usada a regressão logística para modelar a sobrevivência das espécies principais na mistura. A aplicação do teste Wald Z mostrou que a cerejeira está associada a uma elevada probabilidade de sobrevivência (64-75%) tanto no tratamento puro como nos mistos com robínia. O mesmo teste demonstrou que o carvalho americano está associado a uma baixa probabilidade de sobreviver devido, principalmente, ao insucesso verificado na fase de instalação (sobrevivência 46 - 55% até aos 10 anos) agravada pela forte geada negra que ocorreu na primavera de 2010. Atualmente a sobrevivência do carvalho americano varia de 35 a 54 %. Comparou-se o crescimento para cada espécie, entre os diferentes tratamentos, usando o teste das diferenças mínimas significativas (LSD). O tratamento correspondente à mistura linha a linha com robínia mostrou uma resposta positiva em todos os critérios avaliados, principalmente a taxa de sobrevivência (75%), a produção relativa, a produção relativa total e o crescimento em altura. As restantes misturas ou não apresentaram diferenças significativas relativamente aos tratamentos puros das respetivas espécies ou apresentaram um efeito depressivo da robínia sobre a espécie principal. O processo de facilitação/complementaridade proporcionado pela espécie acessória é evidente apenas para a cerejeira que beneficia de uma maior quantidade de azoto no solo e uma maior frescura proporcionada pela espécie acessória.
Palavra-chave: Silvicultura, Robinia pseudoacacia, Quercus rubra, Prunus avium, taxa de
V
Index:
Abstract ... II
Resumo ... III
List of symbols: ... VIII
Index: ... V
Index of figures: ... VII
Index of tables: ... VII
1. Introduction ... 1
2. Bibliographical review ... 3
2.1. Arboriculture for timber ... 3
2.2. Management of forest ... 3
2.3. Mixed forests ... 4
2.3.1. Definition... 4
2.3.2. Characteristics of mixed plantations ... 6
2.4. The choice of the species: ... 8
2.5. Main species ... 9
2.5.1. Prunus avium ... 9
a. General description: ... 9
2.5.2. Quercus rubra ... 10
a. General description: ... 10
2.5.3. Robinia pseudoacacia ... 11
a. General description: ... 11
3. Study area ... 11
3.1. General site characteristics ... 11
3.1.1. Geographical situation ... 11
3.1.2. Climate characteristics... 13
3.1.3. Geology and pedology ... 14
4. Materials and methods ... 15
4.1. Description of the trial ... 15
4.2. Dendrometric variables ... 19
4.3. Measuring tools ... 20
4.4. Data analysis... 23
5. Results and discussion ... 25
5.1. Survival rate by treatment ... 25
VI
5.3. Analysis of variance (ANOVA) ... 27
5.4. Productivity of the treatments ... 28
6. Conclusions ... 30
7. Bibliography ... 32
VII
Index of figures:
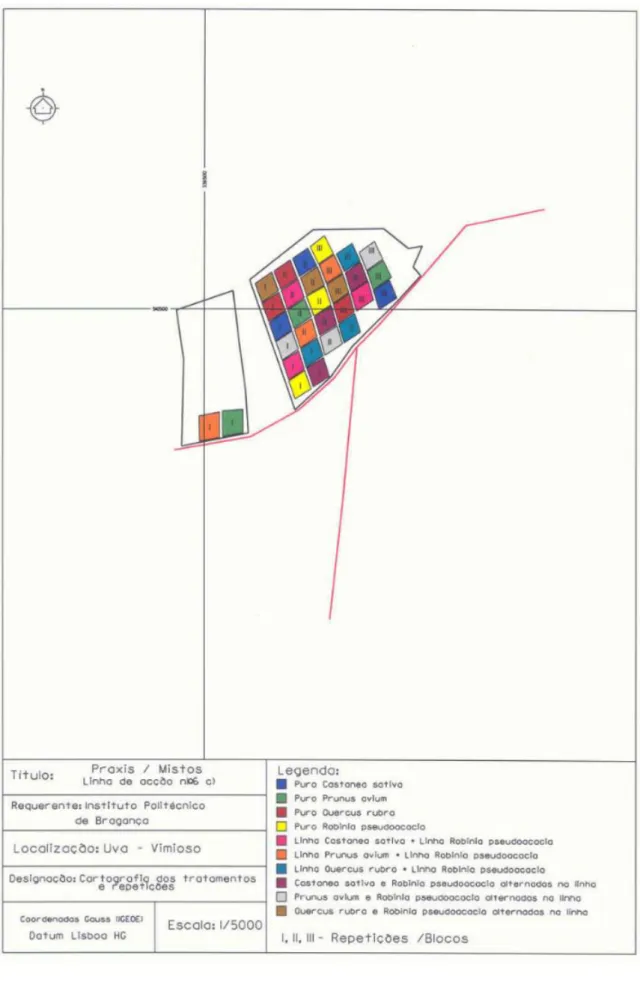
Figure 1: Location map ... 12
Figure 2: The ombrothermic diagram of the climatological station of Miranda do Douro, 1951-1980 14 Figure 3: Map of plots disposition in the field ... 16
Figure 4: Oriented map of the disposition of the plots ... 17
Figure 5: Illustration of tree spacing in the plots ... 18
Figure 6: Representation of the treatments: pure and types of tree consociations ... 19
Figure 7: Illustration of tree numbering inside the plot ... 19
Figure 8: Haglöf Mantax Caliper ... 20
Figure 9: Haglof-vertexIV and the Transponder T3 ... 21
Figure 10: The trigonometric principle of the hypsometer ... 22
Figure 11: Photos of measurements techniques for diameter breast height (DBH) and total height (H) ... 23
Index of tables:
Table 1: Survival rate by species in each treatment ... 25Table 2: Estimated coefficients of the logistic model ... 25
Table 3: Parameters for the dendrometric variables of the 24 selected trees ... 26
Table 4: Parameters for the dendrometric variables of the 24 selected trees (continuation) ... 27
Table 5: ANOVA F statistics and its significance ... 27
Table 6: Results from LSD post-hoc test ... 28
VIII
List of symbols:
Pa Prunus avium (Wild cherry)
Rp Robinia pseudoacacia (Black locust)
Cs Castanea sativa (Sweet chestnut)
Qr Quercus rubra (Red oak)
Tn Treatment number n
Pn Plot number n
N Nitrogen
ANOVA Analysis of Variance
LSD Least significant difference
DBH Diameter at breast height
D0,10 Diameter at 10cm trunk height HCB Height at crown base
RY Relative yield
RYT Relative yield total
1
1.
Introduction
Forests in many places in the world are facing a multitude of pressures and stresses due to several factors such as human activity, natural disasters and more recently climate change.
The disturbances can be lethal and could result either from natural processes (as wild fires, wind, water stress, pests, diseases, etc.) or from anthropogenic processes (as harvesting, deforestation, pollution, acid rain, etc.) where the trees can be killed. Nowadays, with the increasing of greenhouse effect caused by greenhouse gas emissions from human activity and its accumulation in the atmosphere, a bigger threat to the forests has emerged: Climate change. This global problem might make rare trees
– those most in need of conservation efforts – more vulnerable because of their small
populations, habitat specialization or limited geographic range (Devall, 2009).
Climate change will also influence forests through impacts on other biotic factors such as pests and diseases. Climate change in some areas is already providing insect species with increasingly hospitable habitats, while wider global commerce further facilitates their movement (Osman-Elasha, 2009). Bearing in mind all these problems, forest management is increasingly becoming a necessity to maintain the forest ecosystems alive, and make them less vulnerable to disorders. Portugal, in particular, is suffering a lot from wildfires causing huge losses, and in several times irreversible disorders.
Although observations and projections of the effects of climate change have some uncertainty, the actions on today's forests have consequences for future generations, so it is necessary to implement an adaptive silviculture for climate change in forestry practices (Patrício et al., 2010).
Mixed plantations, in addition to being more bio-ecologically balanced, allow the introduction of flexibility in silvicultural management and the reduction of investment risk face to the future uncertainty. This is possible because a species of the mixture may play several roles in the stand, namely: main, accessory, or potential
accessory (secondary) species. The same species may have role of “main” and “accessory”, depending on the purpose and project requirements introducing flexibility
in the management. This is also an option for growing broadleaves for timber
(“arboriculture for timber”) to maximize the production of timber, which at the
economically and commercially optimal time, can be totally removed.
Mixed stands with nitrogen-fixing accessory species planted in abandoned agricultural lands are a cultural intensification process that can improve the vigour and
the stand environment of the targeted species (Pereira et al., 2011)making them more
resilient to climate change. Kelty (2006) stated that an adequate mixture favours the ecological soil properties, the site fertility, and the resistance to the biotic and abiotic factors. So, at the stand level, mixed forest plantations with nitrogen-fixing species can contribute to the improvement of mineral nutrition of the target-species, increasing the resilience to pests and diseases due to the improvement of tree health (Patrício et al., 2010). Also, Buresti and Frattegiani (1994) and Hellmann et al. (2011) consider that the
2
Robinia pseudoacacia L., Elaeagnus angustifolia L. or Acacia longifolia (Andrews)
Willd.], among other aspects, improves soil fertility by enriching the system with N derived from atmospheric N2-fixation.
On the other hand, the production of valuable hardwoods for quality timber is only possible in good sites, i.e. sites with sufficiently fresh, deep and balanced soils and pH close to neutrality, conditions rarely found in abandoned agricultural land in the northeast of Portugal (Patrício et al., 2010).
With the aim of improving the nutrition and vigour of valuable hardwoods, with expected gains in form and growth, a mixed plantation trial was established in 1998 under the scientific project PRAXIS XXI - 3 / 3.2 / Flor / 2127/95 in the northeast
of Portugal, exactly in the region of Vimioso (Latitude 41°34’12” N; Longitude 6°30’7”
W, Altitude 700m).
Three valuable broadleaves for timber production were considered: Wild
cherry (Prunus avium L.), Sweet chestnut (Castanea sativa Mill.) and Red oak
(Quercus rubra L.) in association with an accessory species black locust (Robinia pseudoacacia L.) in a substitutive or replacing design. This trial has been evaluated over
time. In the dormancy period of 2016/2017 a new reassessment of this trial was made with the measurement of the dendrometric parameters. These data are the basis of this dissertation whose objectives are: evaluate the growth, yield and survival rate among the mixtures, and assess the benefits that the valuable broadleaves are getting from the accessory species.
This is a study of a new management option to produce quality timber in
3
2.
Bibliographical review
2.1.Arboriculture for timber
The “arboriculture for timber” can be defined as the planting of trees
constituting an artificial system that may be temporary or transitional. This cultivation can turn into a forest ecosystem, and its main purpose is to obtain wood products in higher quantities and qualities in a relatively shorter period of time depending on the phytogeographic, environmental and socioeconomic regions (Ciancio et al., 1981).
“Arboriculture for timber” is nowadays defined as the cultivation of trees and shrubs for
the production of timber (Buresti et al., 2003).
Arboriculture for timber is an intermediate discipline between agriculture and silviculture since it the cultivation is done on agricultural lands with specific silvicultural objectives, and the same time, it keeps the temporal reversibility characteristics of agricultural crops.
Buresti & Mori (2016) define the three main objectives of the arboriculture for timber that strictly related to financial goals:
Obtain timber products respecting the quality requirements of the
market
Obtain timber products in the shortest period of time possible
Obtain timber products with the minimum financial costs
Concerning the quality of the timber, the most appreciated stems must be:
Able to produce valuable lumber
Straight and cylindrical
Free from branches and defects for at least 250 cm, and have a
minimum DBH of 35 cm with regular growth and homogeneous colour.
According to Buresti & Mori (2016) we can have several types of arboriculture for timber (AFT) as: AFT Potential / permanent polycyclic, AFT temporary polycyclic, AFT agronomic, AFT medium-long cycle, AFT short cycle, AFT multifunctional and AFT naturalist. So, when the aimed products from arboriculture are not only the wood,
but also other alternative goods such as honey, resin, fruit, …), then the system is called a multifunctional arboriculture. When the tree cultivation is made in any extension of land to take advantage of the natural dynamics (e.g. positive competition between trees, natural nitrogen fixation, weed control) to condition the vigour and form of the main trees as well the cultural intensity we call it naturalist arboriculture.
2.2.Management of forest
4
harvested plantations or managed conservation forests (Noble and Dirzo, 1997). This ecosystem suffers from a strong pressure since the harvest for wood and fuel is around 5
billion m3 per year, and it keeps growing with a rate of 1,5% every year (Word
resources Institute, 1994). Considering stress occurring on the forests, new ideas of sustainable management for this ecosystem is necessary to preserve it. There is a wide variety of forest management methods, each one is dependent on the purpose aimed from the forest, inter alia, the timber production.
The most common forest operation for timber production is the intensive logging. The logging is a subject to an important debate to understanding the best options concerning its intensity (from selective logging to clear-cutting), its size, and its distribution in the landscape. This application allows a high productivity per area unit and uniform harvesting of the trees. This operation varies from a close-to-nature approach giving space for a natural regeneration after logging to a highly managed forest concerning artificial regeneration and soil preparation. (Noble & Dirzo, 1997).
Another approach for forest exploitation is the sustainable forest management which focuses primarily on the use of not only the timber, but other forest goods such as fruits, oils, latex, fibres, and medicine in an equilibrated way (Peters et al., 1989).
The soil and its nutrients are also very critical in the sustainability of the forest. And to achieve this sustainability, it is necessary to assess the sustainability of each operation following these four criteria (Worell & Hampson, 1997):
Magnitude of the operation: It is the soil situation difference between
a new management operation and the previous one.
Significance of the impact: which is the effect of the operation on the
soil and if it exceeds its natural capacity.
The reversibility level of the operation: To how this operation can be
reversible
The economic benefits and costs of this operation
The operation can be sustainable in term of soil only if all these four criteria are verified.
Taking into account the statements above, the forest use must go forward to a wholly-managed ecosystem to improve its levels of wood productivity, to maintain its
component’s equilibrium, and to preserve its biodiversity. This goal requires the
intervention and the collaboration of foresters, ecologists, economists to be reached
2.3.Mixed forests
2.3.1.Definition
5
The project “Management of Mixed-species Forest: Silviculture and
Economics” defined the mixed stand as a continuous set of trees from different species
mixed spatially according to their capability of site utilization, allowing ecological interactions between them.
The common view of mixed forests as that composed of more than one tree species is different when other variables apart from the number of species are considered. Volume, basal area, and canopy cover by species and their subsequent thresholds vary across Europe.
The COST Action FP1206 in their 2013 report tried to sum up all these definitions and generate both common definition and classification.
The COST starts from the point that there are at least three categories of
definitions of mixed forests: those based on species composition (defined pure stands
those where 80% or more of the overstory is of a single species), those based on
structural features (built on form, type, and grade of mixtures) and those based on forest development phases (built on the concepts of transition and stratification).
It is a difficult task to reconcile all points of view to describe mixed forests into one. The inclusion of functional aspects in a definition should be based on biodiversity -productivity relationship as identification of competition or complementarity effects that can alter management prescriptions.
Thus, a ’perfect’ definition should include all aspects described here plus the
economic and social dimensions of forests. The following definition was approved by
the Management Committee of the Action in Madrid on October 23rd, 2013 and it was
considered valid for all working groups in the Action:
“A mixed forest is a forest unit of at least 0.5 ha, excluding linear formations, where at least two tree species coexist at any developmental stage sharing common resources (light, water, and/or soil nutrients). The presence of each of the component species is normally assessed as a proportion of the number of stems or of basal area, although volume, biomass and canopy cover may be used for specific objectives. A variety of structures and patterns of mixtures can be perceived to occur, while the interactions between the component species and their relative proportions may change over time”.
In order to compare research results when classifying a mixed forest, it is needed to state the dimension of the forest unit (plot, stand, forest, landscape), the developmental stage (initiation phase, stem-exclusion, transition, old-growth), the occurrence and form of mixture (consorting, concomitant, stem-wise, group-wise), the temporal dimension of the study (static, dynamic), and the main driver of diversity-productivity relationship (facilitation, niche differentiation, competition).
2.3.2.Mixed plantations with nitrogen-fixing species:
6
Numerous studies have been and are still in the process, help for a better understanding of all types of interactions and characteristics of these mixtures.
2.3.3.Interactions in mixed stands:
The three principal interactions to consider in the study of mixed stands are competition, complementarity and facilitation (Vandermeer, 1989)
2.3.4.Characteristics of mixed plantations
The FAO in 2001 stated that the monocultures present the big majority of the plantations all over the world for some positive priorities. Nevertheless, the interest in mixed plantations is continually growing as we see scientists increasingly focusing on this field of study. The mixed plantations with Nitrogen-fixing species have also been studied in many cases and show a lot of interesting results in term of productivity and soil quality improvement. This interest is accompanied with multiple results about mixed plantations and their particularities vis-à-vis the monocultures. These results will help us to better understand the differences between these two types of plantations in different terms such as productivity (Carnus et al., 2006; Piotto, 2008).
Here are some statements about the mixed plantations and their particularities.
Advantages of mixed plantations:
The mixed plantations are considered better than the pure ones, both in terms of
wood production and biodiversity preservation, what make them regarded as more natural, sustainable, and environmentally friendly (Gardiner, 1999).
The natural regeneration is more boosted in the mixed plantations (Monteiro,
1988, cit. Caldas 2006), and one of the reason for that is that the higher trees protect the smaller ones against the frost creating a microclimate inside the canopy (Costa, 1992). On the other hand, the protection provided by some species may improve the survival and growth of other species and may lead to increased production (Gardiner, 1999).
The soil is better used by the root systems in the mixed forests (Gardiner, 1999)
since the species benefit from the different horizons of the soil (Monteiro, 1988; Costa, 1992), and in this way, they can extract higher water quantities from the deeper layers of the soil (Schume et al., 2004).
The competition is lower in mixed plantations, and this is due to the competitive
production and facilitation (Vandermeer, 1989; Piotto, 2008).
Litter production, leaf litter decomposition and nutrient return are higher in the
mixed plantations than in the monoculture (Q Wang, S Wang & Y Huang, 2007) which can reduce the immobilization of nutrients in the soil (Gardiner, 1999).
The mixed plantations show higher production diversity (DeBell et al., 1997).
7
complementary production, such as firewood, biomass, fruits, honey, etc. (Buresti, 1996).
They increase the wildlife level (Young, 1991; Kelty, 1992; Gardiner, 1999)
creating a higher biological diversity (Schütz, 1997).
They have the potential to increase biomass production and consequently,
carbon sequestration (Binkley et al., 2003).
Specific cases:
The mixed plantations composed of the native (Hieronyma alchorneoides,
Vochysia ferruginea, Balizia elegans, and Genipa americana) proved higher
regeneration rates than the monocultures of each of those species in the Atlantic humid lands of Costa Rica (Carnevale, 2002).
The species Cordia alliodora characterized by a higher and open canopy and
low leaf area index, and Hyeronima alchorneoides with its dense crows formed
a stratified canopy allowing a light use compatibility (Menalled, 1998)
In north Queensland in Australia, Eucalyptus pellita in mixture with Acacia
peregrine showed bigger volume growth than in monoculture. Furthermore, the
Acacia had a positive ecological impact on the Eucalyptus by promoting the facilitation, and a reducing the competition (Bristow, 2006)
In a trial in Hakalau, Hawaii, both yields and dry yields were higher in the
mixed plantations of the N-fixing species Albizia falcataria with the objective
species Eucalyptus saligna Sm. In comparison to the monoculture (DeBell et al.,
1989).
In a trial in the University of Puerto Rico, the litterfall production and Nitrogen
level in the soil were higher in the mixed plantations of Eucalyptus robusta with
two N-fixing species Casuarina equisetifolia and Leucaena leucocephala
(Parrotta, 1999).
Disadvantages of mixed plantations:
It is always difficult to opt for a uniform harvesting in a mixed stand since the
species usually have different growth speed rates (Evans & Trunbull, 2004; Piotto, 2008)
The interspecific competition for light, water and nutrients in the mixed stands
may be disadvantageous for the main trees if the consociation is not good (Lupke, 1998).
In addition to the competition problems, the management of these types of
forests to keep the balance between the species may be difficult and more expensive than the pure stands (Monteiro, 1988; Young, 1991; Hekhuis, 1999, cit. Caldas, 2006).
The analysis of the mixed stands is more complex as the composing species have
8 2.4.The choice of the species:
The choice of the composing species, the planting period, and the disposition are of great importance for the installation of a successful mixed stand (Luís, 1997).
The selection of the species to be used in afforestation depends essentially on the edaphoclimatic characteristics of the site, ecological characteristics of the species and the ultimate objective of the plantation and the available financial resources (Correia & Oliveira, 1999, cit. Caldas, 2016).
The species of the mixture should show differences in height development, crown geometry and leaf area density, foliage production period, efficiency and duration of photosynthetic activity, as well as differences in root structure, namely root depth (Kelty, 1992). According to Forrester et al. (2005) species should have compatible growth dynamics at height to avoid suppression of intolerant plants and reduce competition for light.
To understand the interaction between species there are two fundamental
ecological principles that were introduced by Vandermeer (1989): complementarity
and facilitation.
The concept of complementarity is defined as the reduction of the interspecific
competition throughout the niche differentiation (Trenbath 1974; Hooper et al., 2005).
The niche differentiation or niche portioning refers to when the species are using
different environmental resources or the same resources but in different ways or at different times (Hardin, 1960).
Facilitation is when a species affects positively the growth of the species in a mixture. (Hooper et al., 2005). This facilitation is also able to improve the quality of the ecosystem where it occurs, and this could be done by increasing
the levels of a resource or by easing some severe environmental conditions
(Fowler 1986; Bertness & Callaway, 1994; Hooper, 2005).
Mixed plantations with nitrogen-fixing species can participate in the process of facilitation in the mixture (Kelty & Cameron, 1994), and this is with the increasing of the level of Nitrogen in the soil that could have been impoverished by agricultural practices.
The use of nitrogen fixing species aid the main species of the mixture, since the root tissues and the leaves (rich in nitrogen) increase the available nitrogen for the microbial decomposers (Kelty, 1992; Kelty & Cameron, 1994).
Mixed plantations using nitrogen-fixing species on agricultural abandoned land represent a process of intensification, which is similar to the processes used in agriculture (Monteiro (1991), cit. Caldas (2006)).
There are several assessed study cases for broadleaves producers of high
quality timber (Fraxinus angustifolia, Juglans nigra, Prunus avium and Quercus robur)
9
Binkley in 2003 has published that, for a 70 years old stand of pure Pseudotsuga
menziesii and a mixture with Alnus cordata, the stem mass for the douglas fir
was higher in the mixed than in the pure. Furthermore,
Robinia pseudoacacia increases the growth of the main species. These results
could not be seen immediately as the main species shows similar or even lower diameter growth rates in the mixture than the pure stands in the early years (Buresti & Frattegiani, 1994).
For each secondary species, the effects of N-fixation (which stimulates the
growth in height and diameter) and competition are different, depending on the main species associated and the conditions of the planting site. Competition above ground (depends on the growth rate in height and the architecture of the crown of each tree) stimulates the growth in height in the lower trees and reduces the growth in diameter. Also, competition below ground level (depending on the morphology of the root system and the nutrient cycle) will influence both height and diameter growth (Buresti & Frattegiani, 1994)
In the case of Eucalyptus and Facaltaria (Albizia falcataria) stand that was
followed for over 20 years, Binkley (2003) noted that the main species presented higher growth rate and higher mean diameter in the mixed stands than in the pure, further, the mixed stand increases only for the Eucalyptus but not for the Facaltaria. This upswing was a result of the Increased Soil N cycling and supply with Facaltaria (facilitation) and increased dominance of Eucalyptus trees over interplanted Facaltaria (complementary resource use).
2.5.Main species
2.5.1.Prunus avium
a. General description:
The European wild cherry (Prunus avium L.), sweet cherry or gean is a
flowering plant in the Rosaceae family.
This species is widespread in Europe, West Asia, and North-East Africa, especially in areas with humid and warm conditions (Coello et al., 2013). According to these authors wild cherry appears in areas with Mediterranean climate, in shady, mountainous conditions, near water streams. In the Iberian Peninsula, they are located mainly in the North. The timber of Wild cherry is one of the most prized in Europe. This species shows a fast growth rate that enables rotations between 40-50 years, always that it is well adapted to the site and adequately managed. Cherry wood is used especially in the veneer and furniture industry.
10
The wild cherry is a deciduous growing to 15-32m at a fast rate, and in an erect and unique stem.
The bark is smooth with prominent horizontal grey-brown lenticels on young trees become thick and dark on old trees.
The blooming starts in the spring, and by the autumn, the leaves turn orange, pink or red before falling.
For achieving a successful plantation, it is recommended to use a plant material from an area similar to the plantation site (provenance origin), considering the soil features and the severity of summer drought.
b. Requirements:
The wild cherry needs a well-drained moisture retentive soil. It thrives in a loamy soil, doing well on limestone, and is fast growing on deep moist soils. This species is demanding in light being intolerant of heavy shade. They produce quite a lot of suckers and can form thickets, especially if the main trunk is felled or as a consequence of heavy pruning.
c. Uses:
The hard, reddish-brown wood (cherry wood) is valued as a hardwood for woodturning, and making cabinets and musical instruments. Cherry wood is also used for smoking foods, particularly meats, in North America, as it lends a distinct and pleasant flavour to the product.
The species is also used for its cherries, as well as it being an ornamental tree since it is flowering. Because of its size, it is often used in parkland, and less often as a street or garden tree.
2.5.2.Quercus rubra
a. General description:
The red oak (Quercus rubra L.), or champion oak belongs to the red oak group,
and to the Fagaceae family. It is a species native to the North America, but it was
introduced in Portugal on 1724. It is a long living tree with an erect shape, a strong branching, and a moderate single stem growth rate. It is characterised by a rapid growth
rate, (Schmidt et al., 1998) and can reach up to 30 mand a longevity of 70 to 100 years
but can live for more than 300 years according to the USDA. The red oak blooms in mid spring with a medium fruit/seed abundance starting in the summer and ending in fall.
b. Requirements:
The red oak is intolerant to hedge and anaerobic conditions, low to medium
11
This species is suitable for loamy and clay soils and can grow in heavy clay soil. It can grow in a soil with a pH between 4,3 and 7,3. It can grow in semi-shade (light woodland) or no shade. It tolerates dry soils.
c. Uses:
The red oak is famous for its timber quality, and is used for lumber, railroad ties, fence posts and fuelwood.
It has other uses, mainly ornamental since it is a deciduous, and so it is common for it to be a specimen tree in parks and gardens.
2.5.3.Robinia pseudoacacia
a. General description:
The black locust (Robinia pseudoacacia L.) is a medium size deciduous tree
belonging to the Fabaceae (Leguminosae) family. The species It is a native species of
the south-eastern United states. It has an erect shape, and a rapid juvenile growth with multiple stem, achieving 25 m of height and a longevity of 300 years.
Black locust is intolerant to shadow, has a low tolerance to anaerobic conditions, a medium tolerance to salinity and a high tolerance to fire, drought and
CaCO3. The blooming period is in the spring with a moderate spread rate and vegetative
spread rate, and a high seedling vigour.
b. Requirements:
Black locust grows naturally over a wide range of soils and topography. The species goes best on moist, rich, loamy soils or those of limestone origin.
Black locust is very sensitive to poorly drained or compact plastic soils. Excessively dry sites are also poor for the species.
c. Uses:
The black locust timber is not of a higher quality, but it has other special uses. It is used for fence posts, mine timbers, poles, railroad ties, insulator pins, ship timber, boxes, pegs, stakes, and pulp.
3.
Study area
3.1.General site characteristics
3.1.1.Geographical situation
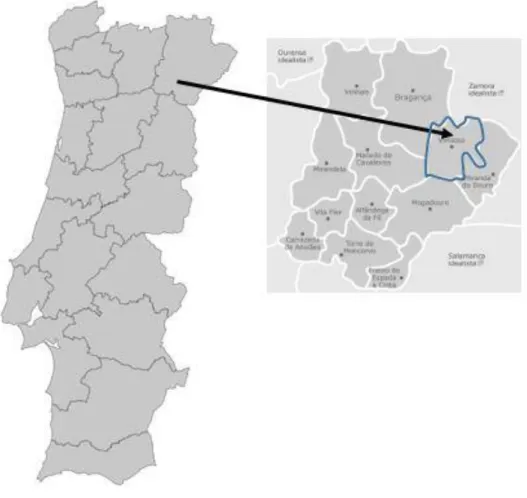
The plantation that we are working on is in the northeast of Portugal, in the region of Bragança and the municipality of Vimioso.
The site’s coordinates are: Latitude 41º34'12''N; Longitude 6º30'7''W and
12
Figure 1: Location map
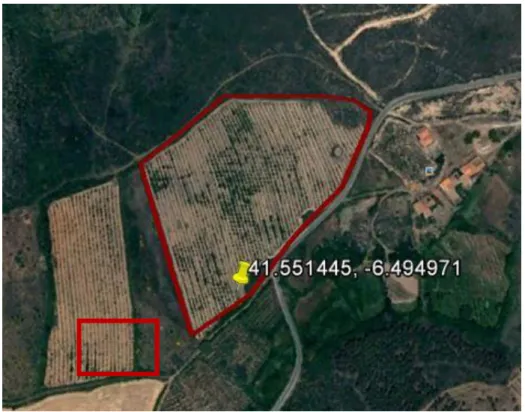
13
Figure 2 GPS site location
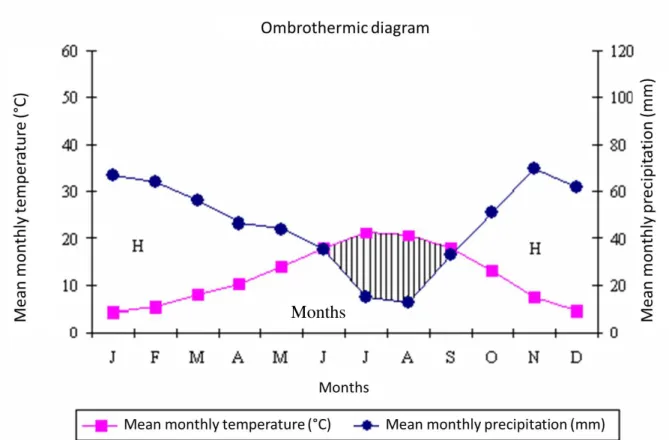
3.1.2. Climate characteristics
Climate characteristics were based on the climatological station of Miranda do
Douro (41º 31’ N; 6º 17’ W; altitude 619 m) from the three decades 1951-1980 (INMG, 1991).
The mean annual temperature was around 12°C, while the average temperature of the hottest month was registered in July (21.1°C) and of the coldest month was registered in January (4.2°C).
From mid-April to the end of October, the average temperature was above 10ºC. The annual thermal amplitude was 16.9ºC.
The mean annual rainfall was 554.7 mm. The rainiest month was November recording the highest value (69.8 mm) and the driest month was August (12.5 mm). The mean annual relative humidity at 9 a.m. was 74% and at 6:00 p.m., 61%.
14
Figure 3: The ombrothermic diagram of the climatological station of Miranda do Douro, 1951-1980 (INMG 1991) (Source (Caldas, 2006)
The ombrothermic diagram of Henri Gaussen presented in the figure 3 helps to determine the dry season of the year which corresponds to the months where the precipitation curve is below the temperature curve (Gonçalves, 1980). In the case of Miranda do Douro, the dry season starts at the middle of June and ends in the middle of September.
3.1.3.Geology and pedology
The soil in the site was classified as Dystric Leptosols (FAO, 1998). This type of soils is characterized by a pH between 4.5 and 5 in a thickness between 25 and 30 cm. The soil presents no obstacles and a medium texture, with a low permeability and a reduced ecological value. It is a soil of shales, with horizon A that is loamy, or loamy-sandy and sometimes chalky. The C horizon is, in general, disaggregated rock with or without soil, and / or continuous and coherent rock at the depth between 10 and 50 cm. These soils are characterized by a degree of base saturation (by ammonium acetate) of less than 50%, without thermal properties (Caldas, 2006).
15
4.
Materials and methods
4.1.Description of the trial
In 1998, in the Framework of the research project PRAXIS XXI –
3/3.2/Flor/2127/95, a mixed plantation trial was established in Vimioso. The site of the plantation was initially an abandoned agricultural land.
The choice of the species (Prunus avium, Quercus rubra and Castanea sativa)
is based on their adaptability for quality timber production and soil and climatic requirements. Those three species are associated with a nitrogen-fixing accessory
species (Robinia pseudoacacia) in a replacement series.
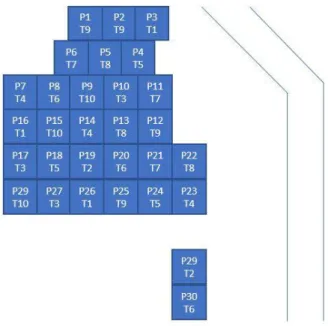
In this site, thirty plots were randomly established, consisting of ten treatments and three replications of each one.
The ten treatments are:
T1 - Pure plantation of Castanea sativa
T2 - Pure plantation of Prunus avium
T3 - Pure plantation of Quercus rubra
T4 - Pure plantation of Robinia pseudoacacia
T5 - Line of Castanea sativa * Line of Robinia pseudoacacia
T6 - Line of Prunusavium * Line of Robinia pseudoacacia
T7 - Line of Quercusrubra * Line of Robinia pseudoacacia
T8 - Castaneasativa * Robinia pseudoacacia (Intimate mixture)
T9 - Prunusavium * Robinia pseudoacacia (Intimate mixture)
T10 –Quercusrubra * Robinia pseudoacacia (Intimate mixture)
As it was mentioned before, we did not consider Castanea sativa in this study
since it does not show any results with the association with black locust in previous evaluations carried out by Patrício et al. (2010).
16
Figure 4: Map of plots disposition in the field
17
18
The area of each plot is around 500 m2 with a buffer strip line not included in
measurements.
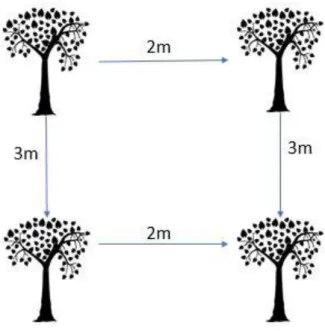
The spacing between trees in the plot is 3m between the lines of the plantation and 2m between the trees in each line.
The figure 6 presents the spacing
Figure 6: Illustration of tree spacing in the plots
19
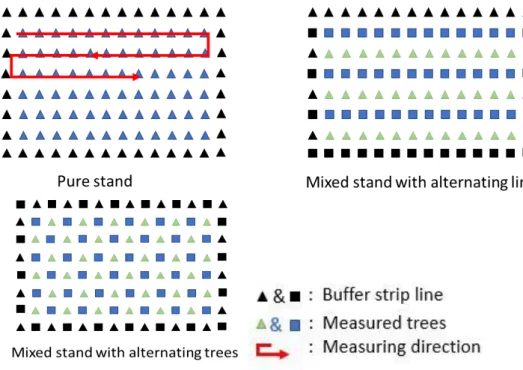
Figure 7: Representation of the treatments: pure and types of tree consociations
4.2.Dendrometric variables
The trial previously described has been evaluated successively over time. To calculate the dendrometric variables of the trees inside each plot were numbered from 1 to 72, as can be seen in figure 7, to ease the measurements procedure and avoid measuring confusions from one year to another.
. . . . . . . . . . . . . .
. 1 2 3 4 5 6 7 8 9 10 11 12 .
. 24 23 22 21 20 19 18 17 16 15 14 13 .
. 25 26 27 28 29 30 31 32 33 34 35 36 .
. 48 47 46 45 44 43 42 41 40 39 38 37 .
. 49 50 51 52 53 53 55 56 57 58 59 60 .
. 72 71 70 69 68 67 66 65 64 63 62 61 .
. . . . . . . . . . . . . .
20
Before starting to measure the variables for each tree, we make sure first that it was still alive and not dry, and if not, we did not take its parameters in account and the tree was evaluated as dead or dry tree, depending on its situation.
The four parameters that we measured were: Diameter at 0,10m of the stem (D0,10), Diameter at breast height (DBH), Height at the crown base (HCB) and the total height (H).
The measuring follows the ascending numbering of the trees mentioned in the Figure 7.
4.3.Measuring tools
To measure these parameters, we used the Haglöf mantax caliper (Figure 8) for both diameters (D0,10m and DBH), and concerning the heights (HCB and H), we used the telescoping measuring pole for the first three plots (P1, P2, P3) and the Haglöf Vertex IV Hypsometer for the remaining plots (Figure 9).
For each tree, we took the diameters in two perpendicular ways and after we calculate the average since the stems are not perfectly cylindrical.
21
Figure 10: Haglof-vertexIV and the Transponder T3 (http://www.haglofcg.com)
The Vertex IV, goes with an accessory tool: The transponder T3, is primarily designed to measure the height of standing objects, and most often trees. The Vertex instrument, with its ultrasonic measuring technique, is useful in dense terrains with thick undergrowth, where conventional methods such as measuring tapes, laser instruments and mechanical height measurers are difficult to use (Vertex IV and Transponder T3 manual January 2007, v.1.0).
Procedure to measure the heights:
We start the transponder T3 and place it on the tree trunk at an approximate
height of 1,30m (Brest height).
We walk suitable distance from the tree – for optimal result accuracy, a distance
equal or bigger than the approximate height of the tree.
We press ON to start the Vertex and aim at the transponder. Keep pressing ON
until the cross-hair sight goes out momentarily and then we release ON. At this moment, the Vertex has measured the distance, the angle, and the horizontal distance to the transponder.
And then, we point at the height to measure with the sight cross blinking. We
press ON until the cross hair disappears again. At this moment, the Vertex displays the measured height.
The Transponder T3
22
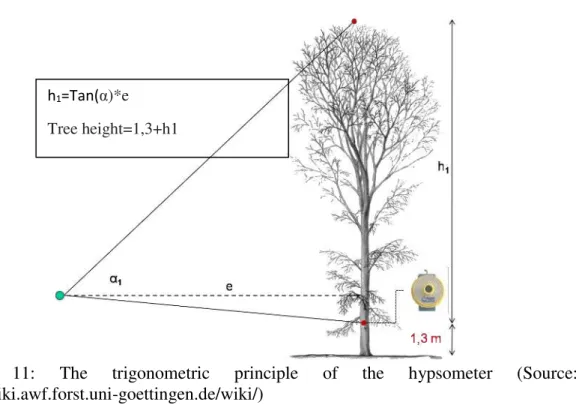
The height measurement is based on the trigonometric principle which is based on the measurement of angles (Figure 10). Height values per inclination angle are then calculated by h=e∗tanα
Figure 11: The trigonometric principle of the hypsometer (Source: http://wiki.awf.forst.uni-goettingen.de/wiki/)
h1=Tan(α)*e
23
Figure 12: Photos of measurements techniques for diameter breast height (DBH) and total height (H)
4.4.Data analysis
After the collection of data, we analysed it starting by the calculation of survival rate of the treatments, then, comparing the dendrometric variables among treatments, and finally analysing the productivity levels of the treatments using the relative yield (RY) and relative yield total (RYT) method (Harper, 1977, Mead, 1979).
So, the effects of combining two species in a replacement series can be analysed by comparing the yield of each species in mixture with its yield in monoculture (Harper, 1977).
Mixture of species A and species B
RY (A) = Yield of A in mixture/ Yield of A in monoculture RY (B) = Yield of B in mixture/ Yield of B in monoculture and
RYT (AB) = RY (A) + RY (B)
24 𝐶𝑜𝑚𝑝𝑙𝑒𝑚𝑒𝑛𝑡𝑎𝑟𝑖𝑡𝑦 (%)
= ((𝑌𝑖𝑒𝑙𝑑 𝑖𝑛 𝑚𝑜𝑛𝑜𝑐𝑢𝑙𝑡𝑢𝑟𝑒 ∗ 𝑠𝑝𝑒𝑐𝑖𝑒𝑠 𝑝𝑟𝑜𝑝𝑜𝑟𝑡𝑖𝑜𝑛) − 1) ∗ 100𝑌𝑖𝑒𝑙𝑑 𝑖𝑛 𝑚𝑖𝑥𝑡𝑢𝑟𝑒
A positive value of the result of this equation refers to the presence of complementarity for this species, while a negative value means the absence of complementarity and/or the presence of competition towards this species.
To analyse the survival rate for each treatment, we created a dummy variable
(“Demo”) coded with “1” for the alive trees and “0” for the dead ones. Then, a
frequency analysis was made by treatment for the purposes of obtaining the survival percentage.
A logistic regression was applied to survival data modelling dependent variable
“Demo” as a function of treatment. The model was fitted in R software (R Core Team,
2017) using glm function and logit link assuming the binomial family.
In order to adequately compare the dendrometric variables among treatments, and depending on the minimum number of living trees in each plot, we selected 48 living trees for the mixed plantations (12 trees of the objective species and 12 trees of nitrogen fixing species from the best two replication plots of each treatment) and 24 for the pure plantations (12 trees from the best two plots) that are well representing the mixtures and the competitive status of the plot. Thus, isolated trees were discarded and only the ones surrounded by other living trees were chosen. This procedure was necessary to homogenise the data avoiding the introduction of bias in further analysis.
For each species, the variables total height (h), diameter at breast height (d), stability coefficient (h/d), and crown ratio (CR) were compared among the different treatments using ANOVA followed by the least significant differences test (LSD) for multiple comparisons. The analysis of variance was performed in R using the function
aov from base package stats and LSD tests were performed with function LSD.test from
library agricolae.
The relative yield and the relative yield total were obtained by calculating the volume of the trees using the diameters and the heights measured in the field using the
cylinder formula for the stump, the Smalian’s formula for the centric part and the cone
formula for the top.
We considered that the tree trunk is composed of three shape parts:
A cylinder from 0 to 10 cm of the tree height
A truncated cone from 10 cm to 130 cm of the tree height:
A cone from 1,30 cm till the top of the tree
25
Then, we used the basic densities of the species (Rp: 790 kg.m-3, Qr: 750 kg.m
-3, Pa: 540 kg.m-3) (Carvalho, 1997) to estimate the biomass produced in the field.
5.
Results and discussion
5.1.Survival rate by treatment
After frequency analysis, the survival rate for each treatment was obtained and is presented in the table 1:
Table 1: Survival rate by species in each treatment
Species Treatment Survival
(%)
Pa T2 69.2
T6 75.0
T9 63.9
Qr T3 54.2
T7 35.2
T10 36.1
Rp T4 79.2
The table 2 presents the estimated coefficients of the logistic model fitted to the
surv-ival data using glm function of the software R.
Table 2: Estimated coefficients of the logistic model
Tn Estimated
values
Standard error
Z value Pr(>|z|) Significance
level
95% confidence interval
2.5 % 97.5 %
T10 -0.5705 0.2454 -2.325 0.02010 * -1.0646 -0.0980
T2 0.8109 0.1812 4.476 0.00008 *** 0.4629 1.1751
T3 0.1671 0.1672 0.999 0.31790 NS -0.1599 0.4970
T6 1.0986 0.2722 4.037 0.00054 *** 0.5856 1.6593
T7 -0.6098 0.2485 -2.454 0.01410 * -1.1110 -0.1320
T9 0.5705 0.2454 2.325 0.02010 * 0.0980 1.0646
Signif. codes: ‘***’ p<0.001 ‘**’ p<0.01 ‘*’ p<0.05 NS: Not-significant
The model relating the binary variable “demo” with the treatments was signific
ant judging by the Likelihood-Ratio (LR) test (χ2
6 = 59.1, p < 0.001). All the coefficient
s were significant at 5% except for T3 (Wald-Z tests). This significance was confirmed by looking to the 95% confidence intervals based on likelihood profiling using function
confint from library MASS.
26
For the objective species, the tests showed that Pa was associated to a high pro bability of survival both in the pure treatment and in those mixed with Rp (coefficients with a positive sign and far different from zero). In the case of Qr, the sign of the coeffic ients for treatments T7 and T10 are negative indicating a low surviving probability (35. 2% and 36.1%, respectively). The survival rate in the treatment T3 is close to 50% (54.2 % of survival). The coefficient for T3 is close to zero. Currently the survival of Pa range s in the interval 64-75% and survival of Qr ranges from 35 to 54% (Table 1).
5.2.Descriptive statistics of the dendrometric variables
The table 4 shows the summary statistics (Mean, maximum, minimum, and standard deviation) for the variables total height (Height), diameter at breast height (DBH), diameter at 10cm from the ground (D0.10), stability coefficient (H/D) and the crown ratio (CR) for the 24 selected trees of each treatment.
Table 3: Parameters for the dendrometric variables of the 24 selected trees
T2 (Pa) Hight (m) DBH (cm) D0,10 (cm) H/D CR
Mean 7.8 10.9 14.2 74.8 0.72
SD 0.64 2.27 2.65 19.49 0.05
Maximum 9.1 16.4 17.8 153 0.81
Minimum 6.8 4.5 4.3 56 0.63
Number of trees 24 24 24 24 24
T6 (Pa) Height (m) DBH (cm) D0,10 (cm) H/D CR
Mean 8,8 11.9 14.9 75.4 0.72
SD 1,20 1.95 2.40 12.2 0.06
Maximum 11,2 16.3 19.2 102 0.81
Minimum 6 7.6 9.1 49 0.62
Number of trees 24 24 24 24 24
T9 (Pa) Height (m) DBH (cm) D0,10 (cm) H/D CR
Mean 7.1 8.4 10.9 96.5 0.59
SD 1.73 3.11 3.9 38.5 0.12
Maximum 10.5 13.2 18.5 217 0.79
Minimum 3.9 1.8 2.4 58 0.23
Number of trees 24 24 24 24 24
T3 (Qr) Height (m) DBH (cm) D0,10 (cm) H/D CR
Mean 8.5 10.2 12.1 85 0.73
SD 1.27 2.08 2.46 14.94 0.07
Maximum 11 14 16.8 124 0.85
Minimum 6.2 6.5 7.4 57 0.59
Number of trees 24 24 24 24 24
T7 (Qr) Height (m) DBH (cm) D0,10 (cm) H/D CR
27
SD 1.80 2.67 3.35 22.33 0.07
Maximum 10.8 13.6 15.1 147.8 0.75
Minimum 5.1 3.8 2.2 68.4 0.52
Number of trees 24 24 24 24 24
Table 4: Parameters for the dendrometric variables of the 24 selected trees (continuation)
T10 Height (m) DBH (cm) D0,10 (cm) H/D CR
Mean 6.8 6.1 8.5 118 0.62
SD 1.89 2.47 4.66 26.05 0.07
Maximum 10.3 12.3 24 180 0.78
Minimum 2.7 1.5 2 74 0.45
Number of trees 24 24 24 24 24
T4 (Rp) Height (m) DBH (cm) D0,10 (cm) H/D CR
Mean 10.3 11.4 14.3 93 0.69
SD 1.59 2.42 3.99 18.57 0.05
Maximum 14.6 17.4 23.8 129 0.78
Minimum 8.2 6.5 7.2 65 0.61
Number of trees 24 24 24 24 24
This data was used to apply the analysis of variance between the treatments for each of the dendrometric variables.
5.3.Analysis of variance (ANOVA)
For each species, the variables (H, D, H/D and CR) were compared among the different treatments using ANOVA followed by LSD test for multiple comparisons. The F-tests in ANOVA were significant for all the variables in each species (Table 4).
Table 5: ANOVA F statistics and its significance
Species Wild cherry (Pa) Red oak (Qr)
Variables F2.69 Significance F2.69 Significance
d (cm) 12.8 *** 17.1 ***
h (m) 10.9 *** 8.7 ***
h/d 5.5 ** 15.1 ***
CR 19.6 *** 14.4 ***
Signif. codes: ‘***’ p<0.001 ‘**’ p<0.01 ‘*’ p<0.05 NS: Not-significant
28 Table 6: Results from LSD post-hoc test
Species Wild cherry (Pa) Red oak (Qr) Treatments
Variables T2 T6 T9 T3 T7 T10
d (cm) 10.89
b 11.89 b 8.36 a 10.21 c 8.26 b 6.12 a
h (m) 7.78
a 8.82 b 7.12 a 8.47 b 8.58 b 6.78 a
h/d 74.77
a 75.39 a 96.54 b 85.00 a 109.54 b 118.04 b
CR 0.72
b 0.72 b 0.59 a 0.73 b 0.66 a 0.62 a
*Different lowercase letters in the line for the same species indicate statistical significant differences between treatments at 5% level (p<0.05)
The Pa shows higher height growth in the mixture line-by-line (T6) followed by pure (T2). There is a direct benefit relationship of facilitation and/or complementarity provided by the accessory species, because the average growth of the target-species at T6 is higher than the average height growth observed in the other treatments (positive interaction). Also, the lateral shadowing provided by Rb in the T6 treatment favours the height growth of the Pa because of the greater freshness and protection afforded. The effect of competition for light is visible in the T9 treatment where there is also greater instability due to greater competition with the accessory species. For Qr the height growth in T3 does not differ from T7 although they differ from T10. The lower stability of the Qr in the T10 treatment is due to the higher competitive pressure observed without sufficient compensation at the soil level since it presents lower average growth in both height and diameter. In T10 a depressive effect of Rp over Qr is observed. The facilitation process is also not evident in T7 which does not differ in height from the pure T3 despite a slight difference in diameter. The facilitation/complementarity effect promoted by the accessory species is evident in the cherry in the mixture line-by-line.
5.4.Productivity of the treatments
Table 6 presents the relative yield and relative yield total for the black locust, the red oak and the wild cherry in each treatment. The expected value (ev) of the relative yield (RY) is shown in the second column of the table 6 and represents the proportion of the species in the respective treatment in the trial.
29
indicating a potential production increase compared to monoculture. RYT >1 (≤ 1.1) it
may be due to a compensatory effect between the species of the mixture. RYT <1 there is an antagonist relationship (negative interaction) between species.
Table 7: Relative yield and relative yield total
Treatment_Sp RY (ev) Yield (Ton/ha) RY Complementarity
(%) RYT
T2_Pa 1 82.22 1 0 1
T3_Qr 1 86.49 1 0 1
T4_Rp 1 132.16 1 0 1
T6_Pa 0.5 54.33 0.66 32
1.22
T6_Rp 0.5 73.66 0.56 11
T7_Qr 0.5 31.59 0.36 -26
1.34
T7_Rp 0.5 129.10 0.98 95
T9_Pa 0.5 26.15 0.32 -36
0.76
T9_Rp 0.5 58.88 0.45 -11
T10_Qr 0.5 18.87 0.22 -56
0.93
T10_Rp 0.5 94.72 0.72 43
So, in terms of RYT, the mixtures T6 and T7 show the best results as their values are 1.22 and 1.34 respectively exceeding 1 which is the threshold of the pure plantations.
However, for the T6 in the level of RY, the wild cherry and the black locust recorded respectively 0.66 and 0.56 surpassing the expected values (0.5; 0.5). This result, in addition to the positive complementarity value 32% and the previous results of the survival rate and the analysis of variance, proves the existence of a strongly positive relationship between the involved species reflecting the complementarity and the facilitation effects.
For the T7, and even though the RYT is superior than 1, the RYs are not balanced, since the black locust contributes with 0.98 while the red oak contributes only with 0.36 which is lower than the threshold, also, the negative complementarity value proves that the red oak did not benefit from this consociation. In this mixture, the Rp shows a high competitivity vis-à-vis the Qr causing an inferior relative yield and a low survival rate for the objective species (35.2%). However, the surviving was affected by other factors as the breakdown verified in the establishment phase (46-55% survival at 10 years old) worsen by the strong black frost in the spring of 2010. The wild cherry was less affected by black frost in 2010.
30
The two remaining treatments T9 and T10 did not surpass 1 in the RYT and the complementarity values for the objective species are both negative. Yet, the RY of the black locust in T10 was 0.72, this can be interpreted in the same way of the T7, especially that the mortality rate of the red oak in the two treatments is practically the same.
The treatment T9 showed the lowest results in term of relative yields even if the survival rate was nearly 64%. This score can be due to the high competition between the species for light and resources. The depressive effect of the black locust over the objective species in the intimate mixture is evident due to its high development, supress and high competition for light. The facilitation effect given by the increase of N nutrition in the soil it is not compensated duet to the high competition for light above ground.
For the same trial, the results of N mineralization at 11 years old show that the mineralization rates were about three times greater in pure black locust than in the pure wild cherry and about two times greater in the mixture than in the pure wild cherry. However, N mineralization in mixed plantation of wild cherry x black locust, line by line (the study is relative only to the wild cherry, consociated line by line, and the respective pure ones), cannot be considered different from the pure cherry plantations (Pereira et al., 2011). The authors observed also an increase of the amount of soil Microbial Biomass C (MBC) and soil respiration in the mixed plantation. These parameters are considered sensitive indicators for positive indicators in soil environment and, in long term, in site productivity (Pereira et al., 2011). These results may explain the best results of wild cherry in T6 treatment where the facilitation/ complementarity seem evident.
6.
Conclusions
In this work, we analysed the performance of two high-quality timber broadleaf species in consociation with a nitrogen-fixing accessory species in mixed plantation trial.
Considering the results of the survival rate, the comparison of the key dendrometric variables among the treatments, and the values of relative yield and relative yield total, we can conclude the following:
The best treatment showing clearly the processes of facilitation and
complementarity is the T6 where wild cherry and black locust are consociated line by line.
The results of the height growth of the wild cherry follow the same
31
A similar consociation (black locust and the red oak line by line) -
treatment T7 - showed a higher competition of Rp towards Qr causing a higher mortality rate and lower productivity level. However, this mortality rate is not due only to the black locust, but also to the black frost that occurred in 2010 causing great damages to the Qr trees.
The intimate mixtures (T9 and T10) did not show positive results since
32
Bibliography
Bertness, M. D., & Callaway, R. (1994). Positive interactions in communities. Trends in ecology & evolution, 9(5), 191-193.
Binkley, D. (2003). Seven decades of stand development in mixed and pure stands of conifers and nitrogen-fixing red alder. Canadian Journal of Forest Research, 33(11), 2274-2279.
Binkley, D., Dunkin, K. A., DeBell, D., & Ryan, M. G. (1992). Production and nutrient cycling in mixed plantations of Eucalyptus and Albizia in Hawaii. Forest Science, 38(2), 393-408.
Binkley, D., Senock, R., Bird, S., & Cole, T. G. (2003). Twenty years of stand development in pure and mixed stands of Eucalyptus saligna and nitrogen-fixing Facaltaria moluccana. Forest Ecology and Management, 182(1), 93-102.
Bristow, M., Vanclay, J. K., Brooks, L., & Hunt, M. (2006). Growth and species interactions of Eucalyptus pellita in a mixed and monoculture plantation in the humid tropics of north Queensland. Forest Ecology and Management, 233(2), 285-294.
Buresti Lattes E. e Mori P., (a curi di) (2016). Progettazione, Realizzazione e Gestione delle Piantagioni da legno Policicliche di tipo Naturalistico (PPN). Progetto Life+ InBiowood (LIFE 12 ENV/IT/000153), Ed.Compagnia delle Foreste (Arezzo) 114p.
Buresti, E. & Frattegiani, M. (1994). First Results of a Mixed Plantation with High Quality Timber Broadleaves and N-Fixing Trees. In: M. E. P. Costa & T.
Preuhsler (eds), Mixed Stands: Research Plots. Measurements and Results.
Models. ISA/UTL. Lisboa. pp. 219 – 228.
Buresti, E. (1996). Modelli Colturalli per il Noce da Legno. Sherwood. Foreste ed
Alberi Oggi, 15: 25 – 32
Caldas, S.C.R (2006). Estudo comparativo de diferentes consociações com os especies
fixadoras de azoto Robinia pseudoacacia, Alnus cordata. Tese de maestrado
em gestao e conservaçao da natureza. Universidade dos açores/ Instituto politecino de Bragança, Bragança Portugal. 178pp.
Carnus, J. M., Parrotta, J., Brockerhoff, E., Arbez, M., Jactel, H., Kremer, A., & Walters, B. (2006). Planted forests and biodiversity. Journal of Forestry, 104(2), 65-77.
Carvalho, A. (1997). Madeiras Portuguesas–Estrutura anatómica, propriedades,