THIS REPORT WAS PREPARED EXCLUSIVELY FOR ACADEMIC PURPOSES BY JOÃO ELVAS, A MASTERS IN FINANCE STUDENT OF THE
NOVA SCHOOL OF BUSINESS AND ECONOMICS.THE REPORT WAS SUPERVISED BY A NOVA SBE FACULTY MEMBER, ACTING IN A MERE ACADEMIC CAPACITY, WHO REVIEWED THE VALUATION METHODOLOGY AND THE FINANCIAL MODEL.
(PLEASE REFER TO THE DISCLOSURES AND DISCLAIMERS AT END OF THE DOCUMENT)
Page 1/40
M
ASTERS IN
F
INANCE
On 27 March 2017, EDP announced an intention to launch a non-mandatory offer of €6.8/share in cash for EDPR’s remaining 22.5% of capital and voting rights, and plans to delist the company if it succeeds to obtain over 90% ownership.
The offer corresponds to an implied enterprise value multiple of €1.2m/MW that seems inadequate when compared with the total seven asset rotation transactions executed between 2014 and 2016 at an average €1.5m/MW.
We believe that EDP is benefiting from an overreaction to the election of Donald Trump as US President, as well as from a potential liquidity trap in which minority shareholders do not want to fall.
Onshore wind power’s increasing performance is analysed with recourse to the levelized cost of energy, a commonly used summary measure of the overall competitiveness of different generating technologies.
Given the company’s solid track record of accomplishing its business plans’ targets, the growth of +3.5 GW cumulative from 2016 to 2020 (700 MW/year) seems attainable, with 65% of the capacity additions already secured at the end of 2016.
Company description
EDP Renovaveis (Euronext: EDPR) is a Portuguese producer of renewable energy. Its business comprises the development, construction and operation of fully controlled wind farms and solar plants to generate clean electricity. The company operates in 11 countries across Europe and America.
EDP
R
ENOVÁVEIS
C
OMPANY
R
EPORT
W
INDP
OWERG
ENERATION 26MAY 2017S
TUDENT:
J
OÃOE
LVAS[email protected]
Dust in the wind
EDP takes advantage of minorities’ weak position
Recommendation: BUY
Vs Previous Recommendation BUY
Price Target FY17: 8.38 €
Vs Previous Price Target 5.24 €
Price (as of 26-May-17) 6.97 €
Source: Factset
52-week range (€) 6.83-6.97 Market Cap (€m) 6,081 Outstanding Shares (m) 872.31
Source: Factset
Source: Factset; Note: MSCI and NEX have been rebased
(Values in € millions) 2016 2017E 2018F Revenues 1,453 1,652 1,802 EBITDA 1,274 1,375 1,375 EBIT 564 685 756 Net Profit 176 207 254 Profit to Common 56 135 165 EPS 0.06 0.15 0.19 Total Assets 16,734 17,475 17,873 Total Liabilities 9,161 9,622 9,739 Financial debt 3,406 3,406 3,406 EV/EBITDA 15.1x 13.9x 12.8x EV/MW 1.79 1.69 1.58 Source: Company, Nova Equity Research
EDPRENOVÁVEIS COMPANY REPORT
PAGE 2/40
Table of Contents
The wind power sector ... 2
Wind Farms ... 3
Levelized Cost of Energy ... 3
Market Overview ... 5
Company overview ... 10
Company Description ... 10
Shareholder Structure and Dividend Policy ... 10
Installed Capacity ... 11 Profitability ... 13 2016-2020 Business Plan ... 14 Capacity Expansions ... 14 Operational Targets ... 15 Self-Funding Model ... 16 Comparable Companies ... 17
Tender offer by EDP ... 19
Investment Case ... 21
Valuation Framework ... 21
General Methodology ... 22
Extended Case ... 27
Unlevered Cost of Capital ... 29
APV Valuation results ... 30
Relative Valuation ... 31
Target price risks and limitations ... 33
Appendix ... 34
Base Case Financial Statements and Ratios ... 34
Regulatory Framework Summary ... 36
Comparable Companies Description ... 37
EDPRENOVÁVEIS COMPANY REPORT
PAGE 3/40
The Wind Power Sector
Wind Farms
Wind turbines generate electrical power and are usually grouped together into a single power plant, also known as a wind farm. Aside from issues such as accessibility or grid connection, the most important driver of site selection is the load factor, which corresponds to the fraction of time a turbine is effectively producing energy in a specific period.
The turbines represent 63% of the costs of a typical onshore wind farm. They are composed of several mechanical parts that are assembled by the original equipment manufacturer. After the manufacturing process, the turbine is implanted at the wind farm, requiring foundations that commonly have a size of 20m2, allowing for the land to keep its original purpose such as agriculture or
cattle raising. Foundations usually comprise 9% of the total CAPEX while essential equipment to connect the wind turbines to the public grid usually amounts to 11%, and planning and licensing representing the remaining 17%. During its operating life, a wind turbine requires regular maintenance, typically at six months’ intervals to guarantee that the components keep working appropriately. Over its lifespan, the supply and servicing costs only amount to about half of the initial capex.
Levelized Cost of Energy
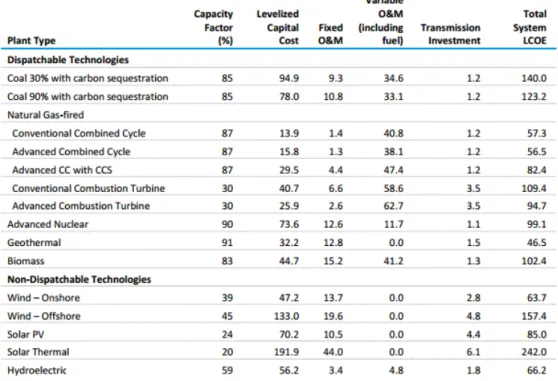
Levelized cost of electricity (LCOE) is commonly used as a summary measure of the overall competitiveness of different generating technologies. It is an estimate of the real cost per electricity output unit of building and operating a power plant during an assumed financial life while targeting a null net present value. In a 2017 publication by the US Energy Information Administration (EIA), the LCOE was estimated based on the expected costs of American plants planned to entering service in 2022.
Key inputs to the calculations included capital expenditures, fuel costs, fixed and variable operations and maintenance (O&M) costs, financing costs, and an assumed capacity (load) factor for each plant type. The LCOE values were calculated based on a 30-year financial life, using a real after-tax weighted average cost of capital (WACC) of 5.5%. Due to regulation, conventional coal plants cannot be built without carbon capture and storage (CCS) because they are required to meet specific CO2 emission standards. As such, EIA included two levels of CCS removal, 30% and 90%. Coal plants with 30% removal levels were
Wind energy is originated by
the irregular heating of the atmosphere caused by the sun, the irregularity of the surface, and rotation of the planet. Terrain, waterbodies and vegetation influence the wind flow patterns. The kinetic energy caused by the wind flow motion can be used to generate electricity using wind turbines.
Onshore small scale turbines
have smaller generation capacity and directly power a home, farm or small business.
Onshore utility scale turbines
have larger capacity and deliver electricity to the power grid to be subsequently distributed by electric utilities or power system operators to the end user.
Offshore turbines stand in
waterbodies and are typically the ones with the largest generation, also delivering electricity to the power grid.
Wind turbine is a device that
gathers wind flow energy, converting it into rotational movement through a rotor and subsequently driving a generator using a gearbox. The generator in a wind turbine produces alternating current and thus, the electricity can be distributed directly into the electrical grid. Turbine 63% Planning & Other 17% Grid Connection 11% Foundation 9%
Chart 1: Typical Wind Farm CAPEX
EDPRENOVÁVEIS COMPANY REPORT
PAGE 4/40 assumed to sustain a 3% increase to its cost-of-capital, in order to reflect the risk associated with higher emissions from a plant of that design.
The importance of the different factors varies between technologies. For those such as solar and wind, which have no fuel costs and relatively small variable O&M costs, LCOE is more sensible to the estimated capital cost of generation capacity. Other power plants, such as coal or natural gas fired ones, are more sensible to fuel costs.
Wind and solar photovoltaic (PV) are used in both utility-scale and distributed end-use residential and commercial applications. However, the EIA projections only account for utility-scale uses of those technologies.
As with any projections, there are limitations. The factors and their values can vary across time, as technologies evolve and fuel prices change. Plant investment decisions are affected by specific technological and regional characteristics of a project, which involve other factors not reflected in LCOE values. The financial life and cost of capital may also vary by technology and project type. Furthermore, the study does not mention any dismantling costs, which may be particularly substantial in the case of nuclear power plants.
Although each technology may benefit from government incentives, the total system LCOE presented below ignores those benefits, allowing for a fairer comparison of each technology in the long-term.
Wind project development Development begins with the
identification of areas with the best possible wind conditions. Analysis of wind patterns and behavior are executed (usually a minimum of 24 months of data collection)and, based on wind studies, the developer defines the layout of the project and the positioning of the turbines in the most efficient way.
Then, there is a negotiation process with local landowners to obtain lease agreements. Engagement with local public authorities is required to secure
environmental, construction, operating and other licenses.
Finally, the developer evaluates operational and financial risks to obtain appropriate financing
to the project.
Construction requires the optimization of the farm’s layout, selecting the best fit of equipment based on the site characteristics. Afterwards, the company needs to build access roads, prepare foundations, assemble wind turbines and construct a substation.
Before starting to generate renewable electricity, the operator must complete the
grid connection in order to
distribute electricity to the grid. Ongoing maintenance service is required to keep the availability factor (amount of time a farm is able to produce electricity over a certain period) at the highest possible level ,minimising the failure rate. Real-time operational data is monitored with the purpose of
analysing performance and
indentifying opportunities for improvement.
Table 1: Estimated LCOE for plants entering service in 2022 (2016 $/MWh)
EDPRENOVÁVEIS COMPANY REPORT
PAGE 5/40 Apart from the EIA study, other institutions such as Bloomberg Energy Finance, IRENA or Lazard have also acknowledged wind onshore as one of the most competitive technologies based on their own LCOE calculations. Although we recognize the limitations on the LCOE as a comparison metric between technologies, we believe the onshore wind positioning in this kind of studies can only be interpreted as a promising sign for the industry.
Furthermore, we expect onshore wind costs to continue decreasing as research and development from turbine manufacturers results in new designs, allowing for the use of larger and more reliable turbines, increased hub heights and rotor diameters capable of unlocking higher capacity factors for the same wind resources.
Market Overview
In 2016, the global wind industry had 54.6 GW of added capacity. This figure is lower than the all-time record verified in 2015, when the annual additions reached 63.6 GW. Total global capacity at the end of 2016 was 486.8 GW, corresponding to a cumulative market growth of 12.5%. China, the greatest market for wind power since 2009, retained the top spot in 2016. While still prosperous, 2016 performance was not as high as expected by the Global Wind Energy Council, mainly due to unfulfilled expectations on China’s expansion and to lower than expected additions in Brazil, Mexico, Canada, and South Africa, relative to cyclical or policy related slowdowns. In 2016, new investment in green energy decreased to €267.8bn, 18% lower than the record investment of €324.6 bn in 2015. Asia-Pacific and China alone accounted for €125.7 bn or almost 47% of the total global investments in clean energy during 2016.
Chart 4: Global installed capacity evolution
Source: GWEC
Chart 2: Countries by installed capacity (GW)
(2016)
Source: GWEC, Company Notes: EDPR markets in red; RoW stands for Rest of the World
Chart 3: Countries by capacity additions (GW)
(2016)
Source: GWEC, Company Notes: EDPR markets in red; RoW stands for Rest of the World
Chart 5: Global annual capacity additions evolution
Source: GWEC
Promising:
Free and renewable resource.
No emissions of air pollutants or greenhouse gases.
Challenging:
Wind is intermittent, does not always blow when electricity is needed.
Cannot be stored, although generated electricity may be stored using batteries.
Best spots usually on remote areas requiring investment in gridline extensions.
EDPRENOVÁVEIS COMPANY REPORT
PAGE 6/40 The US reached total cumulative capacity of 82.2 GW in 2016, corresponding to an annual growth of 11%. Capacity in the country has grown at a compounded rate of 12% over the last five years and is now higher than conventional hydroelectricity, being the largest source of renewable energy in the country. The country does not provide a regulated framework system for the electricity price. Nevertheless, renewable generation is incentivized through Production Tax Credits (PTCs) and regional Renewable Portfolio Standards (RPS) that allow receiving renewable energy certificates (RECs) for each MWh of renewable generation. REC prices are volatile and depend on regional supply/demand. Most of EDPR’s capacity in the US has predefined prices determined by bundled (electricity + REC) long-term contracts with local utilities and corporations, in line with the Company’s policy of avoiding electricity price risk.
The US wind industry seemed to be experiencing a long period of politcal stability following the tax deal approved at the end of 2015 for the extension and phase out of the Production Tax Credit in the period up to 2020. However, the results of the 2016 elections have put political stability into question. Mixed signals have been given by Trump’s transition team with some advisors indicating that credits would stay in place and others calling for a full repeal. Trump himself has called subsidies for renewable energy “a disaster,” while in other instances he has included wind in his “all-of-the-above” approach to energy production, and has even admitted to be “okay” with the tax credits for wind. Nevertheless, Trump’s stance is not the single determining factor for an eventual revocation as that would also be subject to congress approval, the same which approved the 2015 extension with bi-partisan support. Besides, wind power popularity among voters, due to its enviornmental benefits, increasing competitive costs and jobs creation, should have some influence. Although we do not expect an extension program to come in the short-run, we believe that the current program will be run as expected.
In Canada, 702 MW were installed in 2016, making it the 10th largest annual
market and allowing the country to finish the year with 11.9 GW of total cumulative capacity as the eighth largest market globally. Over the last 5 years, Canada’s wind capacity has grown at a compounded average of 18% annually. However, slow demand growth for electricity combined with electricity supply surpluses is a near-term challenge, as governments and utilities delay new procurement despite the importance that cost effective wind energy can have in reaching long-term climate targets. Nevertheless, new infrastructure spending should give priority to the country’s vast wind energy resource, and ensure it is integrated in a way that amplifies the emissions reduction and cost benefits. Transmission is turning into a central factor, particularly as government looks to
Chart 6: Evolution of wind capacity in the US (GW)
Source: GWEC
Chart 7: Evolution of wind capacity in Canada (GW)
EDPRENOVÁVEIS COMPANY REPORT
PAGE 7/40 facilitate trade in clean electricity across provincial borders and into the US. EDPR’s current and pipeline capacity is based in Ontario, where the selling price is defined by a long-term feed-in-tariff without electricity price exposure.
In 2016, Mexico reached a total wind capacity of 3.5 GW, representing a 15% annual growth. The country’s capacity has grown at a compounded annual rate of 44% over the last 5 years. Recent energy reform is expected to increase competitiveness and private investment over the electric power value chain. The sector is moving from a fully state owned national utility responsible for everything from generation to transmission, distribution and retail to a liberalized market. Wind power market is expected to keep growing at an accelerated rate, with government’s implementation of a green certificate system and a purchase obligation system. Larger consumers need to get 5% of their consumption from clean energy sources by 2018 and a clean energy target was defined: 35% by 2024, 37.7% by 2030 and 50% by 2050, up from 21% in 2016. To facilitate transition, energy auctions are being held, with the first two awarded in 2016. The new legal and regulatory framework is still a work in process, and there are still essential rules to be defined. Aditionally, transmission infrastructure is constrained in regions with good wind resources requiring reinforcement of the power grid and additional transmission lines. EDPR’s installed capacity in Mexico is under a power purchase agreement (PPA) with Industrias Peñoles.
Although Brazil experienced political and economic crisis in 2016, the wind industry registered an annual growth of 23%, due to new installations that came from projects that had been contracted in previous years. At the end of the year, cumulative wind power capacity totalled 10.74 GW. The country’ installed capacity has grown at a compunded annual rate of 50% over the last 5 years. An important development occurred in 2016, when the National Development Bank, responsible for financing major infrastructure projects in Brazil, underlined a position to give priority to renewable energy projects. For wind power, the bank kept existing conditions, but they were put temporarily on hold due to the financial crisis in the country. The bank announced its intention to solve the delay in releasing funds, which had forced investors to look for short-term financing elsewhere. Despite recent growth, the sector faces challenges due to the economic crisis and lower electricity demand. In December, the 2nd Reserve Energy Auction was cancelled. The government justified the cancellation with faulting demand. 2016 was the first year without auctions for wind power since 2009, and that is expected to impact the industry in the next years. EDPR’s Brazilian operations are remunerated through a selling price defined in public auctions for long-term contracts. Electricity price exposure is almost null, with little exposure for the production above or below the contracted production.
Chart 8: Evolution of wind capacity in Mexico (GW)
Source: GWEC
Chart 9: Evolution of wind capacity in Brazil (GW)
EDPRENOVÁVEIS COMPANY REPORT
PAGE 8/40 Belgian wind capacity reached 2.4GW in 2016, corresponding to an 8% annual growth. Over the last 5 years, capacity has grown at a 17% compunded annual growth rate. The country has a wind capacity target of 5.3 GW to be reached until 2020. However, due to the geographical nature of the country, 2.3 GW shall be off-shore, a technology which has never been developed by EDPR. The company’s current remuneration scheme is based on a market price plus green certificates (GC), whose price are defined on a regulated market.
Italy is facing a period of stabilisation of wind power installations. In 2016, capacity grew 1%, having had grown at a compounded annual growth rate of 6% over the last five years. This is a consequence of a support scheme which came into force at the end of 2012 in the form of a feed-in-tariff (shifting away from the former GC system). Under the new scheme, incentives are constrained by established annual quotas, creating limitations for new installations. EDPR’s Italian wind farms operating prior to the end of 2012 are remunerated under a pool + premium scheme. Assets operational from 2013 onwards were awarded contracts through competitive auctions that require the regulator to pay the difference between market price and the awarded price if necessary.
In France, wind capacity has grown at a 12% compounded annual growth rate over the last 5 years, achieving annual growth of 14% in 2016 and reaching 11.7 GW of installed capacity. In October 2016, the government announced ambitious objectives for on-shore wind energy, with the goal of reaching 22GW-26GW in 2023. The outcome of recent elections in the country makes us believe the there are no reasons for the goal to be changed. The French wind market is undergoing structural changes:In December 2016, it switched from the previous feed-in tariff scheme to a new contract-for-difference scheme applicable to wind farms that had requested a PPA’s during 2016. The strike price will be equal to the value of the previous feed-in-tariff plus a management fee to compensate balancing costs.
Poland has reached 5.8 GW of onshore wind capacity in 2016, representing an annual growth of 19% and contributing to a 5-year compounded annual growth rate. However government has limited growth in wind generation by passing a bill in June 2016 specifically aimed at restricting wind power development. The bill makes it illegal to build turbines within 2km of other buildings or forests, which rules out 99% of land. Besides, it quadruples the tax rate payable on existing turbines. Government has raised objections to wind energy, claiming it is supported by a lobby of German manufacturers seeking markets for their wind turbines, and wants to deter the growth of alternative techologies, considering them a threat to the traditional model based on hard coal and lignite. In Poland, EDPR is remunerated through a combination of pool price and GC.
Source: IRENA
Chart 10: Evolution of wind capacity in Belgium (GW)
Source: IRENA
Chart 11: Evolution of wind capacity in Italy (GW)
Source: IRENA
Chart 12: Evolution of wind capacity in France (GW)
Source: IRENA
Chart 13: Evolution of wind capacity in Poland (GW)
EDPRENOVÁVEIS COMPANY REPORT
PAGE 9/40 Despite zero growth in Romania since 2014, the compounded annual growth rate over the last 5 years was still 26%. In June 2013, the Romanian Government published an emergency ordinance which included the limitation of installed capacity and the suspension of Green Certificates to wind technologies, significantly cutting incentives to wind energy producers in the country. However, in a March 2017 bill, the minister of energy announced the reinsertion of the green certificates in the market. Romania is one of the markets where EDPR is exposed to electricity market price fluctuations.
Portuguese capacity has grown 5% in 2016 to reach 5.3 GW, representing a compounded annual growth rate of 7% over the last 5 years. Operation of the power system under very high wind penetration (typically above 80%) requires complex management from the power system operator. We expect a conservative approach for the deployment of projects in the near future, especially when uncorrelated with demand. Contracts until 2016 benefit from a feed-in tariff, inversely correlated with load factor and updated monthly with inflation, while later contracts’ prices were defined through competitive tenders. Wind capacity in Spain has not grown since the 2013 energy reform was approved, generating legal uncertainty through the retroactive modification of the regulatory framework and the adoption of a new payment system, which allowed changing the economic conditions for payment every six years without informing developers beforehand. However, in May 2017, renewable energy auction was held by the government and nearly all of the 3 GW available were awarded to wind power projects. The €43/MWh was the lowest level ever awarded in an onshore wind tender in Europe. We believe that developers will be prepared for an unsubsidized future but revenue stabilisation mechanisms that address the risk of wholesale price volatility will be critical to the deployment of onshore wind across Europe at competitive costs. In Spain, EDPR receives the market price and a premium per MW, if necessary, to achieve a target return established as the Spanish 10-year Bond yields plus 3%.
The Iberian Peninsula has ample wind resources, but it is located far from the large consumption centres in Central West Europe (CWE). More interconnections between France and Spain are needed in order to integrate wind energy from the Iberian Peninsula into CWE in an efficient manner. Cross-border interconnections are a priority of EU energy policy. In June 2015, the European Commission, France, Portugal and Spain signed a memorandum of understanding creating a High-Level Group for Southwestern Europe on interconnections. We expect interconnections to have a critical effect in the medium-term, creating opportunites to allocate Portuguese and Spanish wind electrical surpluses andencouraging an increase in the average price per MW of electricity produced. Source: IRENA
Chart 14: Evolution of wind capacity in Romania (GW)
Source: IRENA
Chart 16: Evolution of wind capacity in Spain (GW)
Source: IRENA
Chart 15: Evolution of wind capacity in Portugal (GW)
EDPRENOVÁVEIS COMPANY REPORT
PAGE 10/40
Company overview
Company Description
EDP Renováveis (Euronext: EDPR) is a Portugal-based producer of renewable energy. Its business comprises the development, construction and operation of fully controlled wind farms and solar plants to generate and deliver clean electricity. Currently, more than 99% of the company’s installed capacity is based on on-shore wind farms, with the remaining coming from solar photovoltaic sources.
The company began developing wind farms in 1996 and was first listed publicly in June 2008. EDPR’s global presence is managed by two regional platforms which oversee the development, construction and operation of assets in their geographic areas. EDPR Europe, headquartered in Madrid, manages assets located in the EU and Brazil, while EDPR North America, headquartered in Houston, manages assets in the United States, Canada and Mexico.
EDPR operates in eleven markets worldwide and has been continuously expanding its business to new regions. It is the sixth-largest wind energy producer in terms of installed capacity worldwide, being first in Portugal, second in Poland, third in Spain and Romania and fourth in the United States. The remaining countries where the company operates are Belgium, France, Italy, Brazil, Canada and Mexico.
Shareholder Structure and Dividend policy
The EDP Group owns 77.5% of the share capital and voting rights since launching the company’s IPO in June 2008. EDP is a vertically integrated utility company and the largest generator, distributor and supplier of electricity in Portugal, as well as one of the largest private generation groups in Brazil. It also has significant operations in electricity and gas in Spain, being the third largest electricity generation company and one of the largest distributors of gas in the Iberian Peninsula. EDP has a relevant presence in the world energy outlook, being present in 14 countries and employing c.12,000 people around the world. In 2016, the group had an installed capacity of 25.2 GW, generating 70 TW/h, of which 33% come from wind.
EDP was incorporated as a state-owned company, having started its privatisation process in 1997. On 11 May 2012, regarding EDP's eighth reprivatisation phase, the Portuguese State divested ownership of 780,633,782 shares to China Three Gorges (CTG), representing 21.35% of the group’s share capital. This was an Source: Company
Chart 18: EDP shareholders Chart 17: EDPR shareholders
Source: Company
Source: Company
Chart 19: EDPR shareholders (Ex-EDP by nationality)
EDPRENOVÁVEIS COMPANY REPORT
PAGE 11/40 important strategic step for EDPR, as CTG came to acquire minority interests in wind farms in Italy and Poland (2015) and Portugal (2017)
Apart from the qualified shareholding of EDP Group, MFS Investment Management held an indirect qualified position, as a collective investment institution, of 4.0% in EDPR share capital and voting rights.
Institutional investors represent about 92% of EDPR’ investor base (ex-EDP Group), while the remaining 8% are private investors. Among institutional investors, investment funds account for largest share, followed by sustainable and responsible funds (SRI). SRIs’ significant stake is explained by EDPR’s participation in several financial indexes that aggregate top performing companies for sustainability and corporate social responsibility.
EDPR has consistently paid dividends since 2013. In that year, €0.04 was paid per share, corresponding to a 28% pay-out ratio based on 2012 annual results. In 2014 and 2015 the same value was paid, corresponding to a 26% and 28% pay-out, respectively. In 2016 and 2017 the company approved the payment of €0.05 per share, corresponding to 26% and 79% pay-out ratios respectively. Based on the current business plan, EDPR is targeting a 25%-35% pay-out ratio until 2020.
Installed Capacity
As of December 2016, the company’s portfolio comprised a total of 10.4 GW. Approximately 5 GW were based in North America, while 2.4 were based in Spain, 1.3 in Portugal, 1.5 in the remaining European countries and 0.2 in Brazil. Most of the North American portfolio was based in the United States (4.8 GW). with just 0.2 in Mexico and 0.03 in Canada. Rest of Europe’s stake was distributed between Romania with 0.5 GW, Poland and France with 0.4 and Italy and Belgium with approximately 0.1 each.
Since 2008, the company more than duplicated its installed capacity. After a double-digit growth obtained from 2008 to 2011, the company stabilised its expansion at around 7% growth per year. Over the entire post-IPO period EDPR has achieved a compounded annual growth rate of approximately 11%.
Chart 21: EDPR installed capacity by geography
Source: Company
Chart 23: RoW installed capacity breakdown
Source: Company
Chart 22: NA installed capacity breakdown
Source: Company
Source: Company, Novasbe research
Chart 24: Installed capacity evolution since initial public offering Chart 20: EDPR shareholders
(Except-EDP by type)
EDPRENOVÁVEIS COMPANY REPORT
PAGE 12/40 In 2016 EDPR installed 820 MW, of which 629 MW were based in North America, 120 MW in Brazil and 72 MW in Europe. In North America, 3 wind farms were completed in the US: Hidalgo (250 MW; Texas), Timber Road III (101 MW; Ohio) and Jericho (78 MW; New York); In Mexico, the 200 MW Eólica de Coahuila wind farm was also finished, representing EDPR’s first project in that country. In Brazil, the installation of a 120 MW wind farm in Baixa do Feijão was concluded, and 72 MW were installed in Europe (44 MW in Italy, 24 MW in France and 4 MW in Portugal).
Fully consolidated installed capacity as of December 2016 had an average age of 6.5 years. In detail, European portfolio had an average age of 7.5 years, North America had an average of 6.0 years and Brazil had 2.9 years. In 2016, EDPR’s depreciation and amortization schedule considered 25 years of useful life for its energy producing fixed assets. From 2017 onwards, based on an independent technical assessment and in line with industry trends, the company will apply a 30-years depreciation schedule (vs 25 years in 2016). This change is expected to have an impact of €65-70m in net income available to common shareholders from 2017 onwards.
Profitability
Although there is a clear growth pattern since the IPO, investors should be aware that the company is exposed to political and regulatory risk which may slow down this trend or reverse it altogether. Spain is EDPR’s second largest market and, in 2013, when an energy reform took place, the remuneration of the company’s wind farms in the country suffered a very impactful cut, with their average selling price decreasing 31% from €88MH/h in 2012 to €67/MHh in 2014. Recovery in profitability was possible due to the company’s focus on the US market (1.16 GW installed since 2013).
Chart 25: EDPR profitability evolution
EDPRENOVÁVEIS COMPANY REPORT
PAGE 13/40 In 2016, total revenues increased 7% (+€104m) YoY to €1,651m, mainly due to higher capacity in operation (+€142m YoY) and a higher load factor (+€24m YoY), although negatively impacted by a lower average selling price (-€26m YoY) and an update of tax equity investors residual interest accretion (-€30m YoY). The company produced 24.5 TW/h of renewable energy in 2016, +14% YoY, benefitting from the capacity added over the year as well as an increase in load factor. 89% of the electricity output was sold under regulated frameworks schemes or PPAs.
Load factor was 30% (vs 29% in 2015), benefiting from an above average load factor from the capacity additions. Nevertheless, average load factor fell 4% short of management’s expected scenario (P50) for 2016. Although weather conditions are out of management control, wind resources should revert to its mean performance in the long-run.
Average selling price was €61/MWh (vs €64/MWh in 2015), due to capacity additions mix (production vs price) and lower YoY prices of renewable energy certificates in some countries.
EDPR is continuously trying to lower the interests paid on its financial debt (4.0% average interest rate in the end of 2016). The optimization process may require the company to write-down some items associated with debt restructuring, which negatively impacts the current net profit, with the purpose of benefiting the future. In 2016, the company incurred charges of more than €25 million in this type of non-recurring expenses.
Due to the restructuring process and other non-recurring items, in addition to a lower than expected average wind resource, net income declined 66% to €56 million against €167 million in 2015. However, the net income adjusted for
non-Table 2: EDPR profitability evolution
EDPRENOVÁVEIS COMPANY REPORT
PAGE 14/40 recurring items of €104 million was in line with the 2015 figure of €108m (namely adjusted to significant non-cash positive impact of the revaluation of some Portuguese assets for which the company acquired control and that were previously jointly owned).
2016-2020 Business Plan
EDPR revamped its 2014-17 Business Plan into a new Business Plan for the 2016-2020 period, with new capacity additions and operational targets. The company has defined a strategy focused on selective growth based on projects with strong and predictable future cash-flow, supported by more efficient operations and based on a self-funding model.
Capacity Expansions
Projected capacity is based on long-term PPAs which have already been secured or long-term contracts awarded under stable regulatory frameworks. This should provide higher predictability of the project’s future cash-flows. The company announced solid operating metrics, particularly an above portfolio average load factor, which should contribute for increased profitability. We see promising signs that EDPR will be capable of successfully accomplishing its business plan target growth of +3.5 GW cumulative from 2016 to 2020 (700 MW/year), as 65% of the capacity additions target is already secured and 820 MW were installed in 2016. The US market is the cornerstone of growth expectations for the business plan period, supported by the PTC tax scheme, and the increasing demand from both utilities and commercial and industrial companies for long term PPAs from wind energy. 1.1 GW of the 1.8 GW additions of wind onshore energy planned for 2016-2020 were already secured at the end of 2016 and have the right to benefit from 100% PTC value. Over 55% of those projects were contracted by non-utilities companies. Historically, the demand for PPAs came solely from non-utilities but recently, direct contracting from corporations has increased considerably. It is also important to note that in 2016 EDPR assured turbine components that allow for an option to further expand capacity up to 3.1 GW until 2020, benefiting from 100% of the PTC value if needed. This option is commonly called “safe harbour”. In 2014, the company expanded into the Mexican market with a bilateral long-term supply agreement for the energy generated by a 200 MW wind farm which was completed in 2016. Mexico is a country with attractive wind energy resources and a growing wind sector and we believe that this project may create a platform for further growth. In 2016, a 20-year 100 MW PPA in Ontario, Canada was also awarded and is expected to be operating by 2019.
Chart 25: 2016-2020 N.A expansion plan
Source: Company
Chart 24: 2016-2020 expansion plan
EDPRENOVÁVEIS COMPANY REPORT
PAGE 15/40 15% of planned capacity additions should come from Europe. In Portugal, 216 MW are expected to be operating in 2018 with a 20-year feed-in tariff. In Italy, 44 MW were installed in 2016, while 127 MW were awarded as 20-year contracts and will be installed in 2018. In France, 34 MW were installed in December 2016 and 76 are in pipeline development. Finally, in Spain, rights for 93 MW of wind capacity were awarded during an auction in January 2016.
In Brazil, during 2016, the company finished the installation of 120 MW belonging to Baixa do Feijão project. Furthermore, 267 MW awarded in 2013-15 will be installed in 2017-18. Projects’ load factors were said to be above 45% while it was also mentioned that their IRR would be above 15%. Brazil has robust wind resources but industry is facing a stabilisation period due to the recent economic and political crisis in the country. Therefore, we believe the company should not be expected to grow much further in the country before 2020.
Considering the increasing competitiveness of solar photovoltaic, the company decided to focus 10% of its expansion plan in that technology. The US is the most attractive market, mainly due to the Investment Tax Credit (ITC) scheme that is driving the creation of new projects.
Operational Targets
The company aims to maximize the performance of its plants and defined targets for three metrics during the business plan period: Technical Availability, Load Factor, and Core Opex (Supplies & Services + Personnel Costs) per MW. Availability corresponds to the ratio between the energy generated and the energy that would have been generated without any downtime caused by internal factors, particularly due to preventive maintenance or repairs. It is an essential indicator of performance of the company’s O&M procedures. To improve this ratio, O&M team needs to avoid malfunctions and perform maintenance activities in the shortest possible timeframe. The company’s availability ratio in 2016 was higher than the 97.5% business plan target.
Load factor corresponds to the fraction of time a turbine is effectively producing energy during a specific period. For the active portfolio, it can be increased through improvements on the availability ratio and by replacing older equipment with technological improvements that allows for a more efficient utilization of wind resources. For new projects, a better load factor depends on the expertise of energy assessment and engineering teams responsible for choosing the locations and designing the layout of the farms. EDPR has historically achieved 29%-30% levels, but is targeting an ambitious 33% load factor for 2020 that needs to be supported by increased competitiveness of new capacity additions.
Chart 26: 2016-2020 Europe expansion plan
EDPRENOVÁVEIS COMPANY REPORT
PAGE 16/40 EDPR has also set a target to reduce Core Opex/MW by -1% CAGR 2015-20. Core Opex refers to costs of supplies and services as well as personnel costs, which are the ones directly controlled by the company. As wind farms mature, the initial O&M contracts provided by the turbine suppliers will expire. The decision of either choosing to renew the maintenance service with the original equipment manufacturer or operate the wind farm on its own may improve this ratio. We also believe that economies of scale for a growing company and the experience gained over time may help the company reducing its cost structure.
Self-Funding Model
The current financing model, already used in the previous business plan, replaced the initial financing strategy that was based on corporate debt from EDP, the major shareholder of the company. The self-funding model is based on a combination of retained cash flow from operating assets, asset rotation strategy and US tax equity.
Most of the funds come from cash flows generated by existing assets. The remaining amount after debt service costs, capital distributions to minority shareholders and tax payments is referred to as retained cash flow, representing the quantity available to deliver dividends to the shareholders and finance new projects. Between 2016-2020, the company anticipates a total retained cash flow generation of about €3.9 billion.
The asset rotation strategy allows the company to lock-in the value expected to be provided by future cash-flows of up and running projects over their remaining lifetime and reinvesting the proceeds in the development of new projects, producing higher returns. EDPR usually sells minority stakes (typically 49%) while keeping full management control. This kind of deal is usually focused on mature projects, typically operating beforehand and thus with higher visibility over future cash-flows that can be attractive to low risk institutional investors, from whom the company can obtain a competitive cost of finance.
For the period 2016-20, EDPR has the target of completing €1.1 billion of Asset Rotation transactions. As of May 2017, €792 million were already obtained. In April 2016, the company obtained €550 million from the sale of 664 MW associated to a 49% participation in a portfolio of wind assets in Spain, Portugal, Belgium and France at an implied EV/MW multiple of €1.7m, to EFG Hermes. Additionally, in February 2017, the company obtained further €242m through the sale of 442MW corresponding to a 49% participation in a portfolio of Portuguese wind farms to China Three Gorges, at a multiple of €1.7m/MW. We see these transactions as value enhancing for shareholders, as they have been done at a higher multiple than the one implied by EDPR’s market price (€1.2m/MW).
EDPRENOVÁVEIS COMPANY REPORT
PAGE 17/40 US tax equity structures are another external source of financing used by the company. It enables an immediate use of the US tax benefits provided by a project, which would otherwise be unusable during a long period of time. Simply put, tax equity investors contribute a sizable part of the initial project investment, receiving in return almost all the PTCs granted to the project for first 10 years of operation, along with benefits from accelerated depreciation. In 2016, EDPR obtained a total funding of $457m after signing two tax equity transactions relative to 429 MW of projects that had started operations in 205.
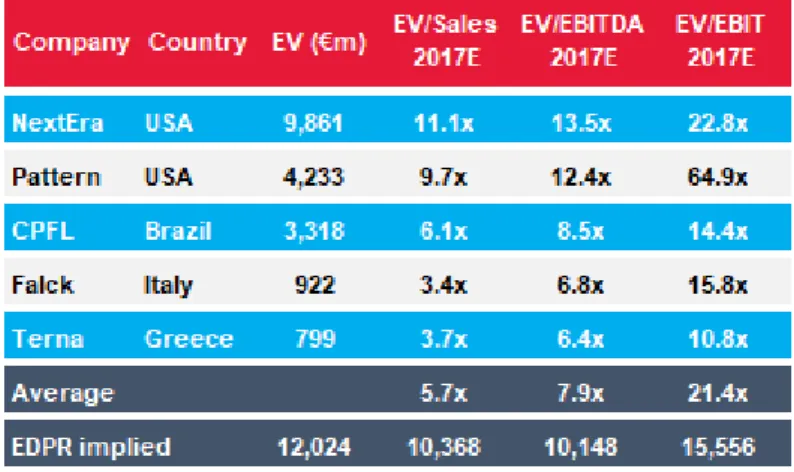
Comparable Companies
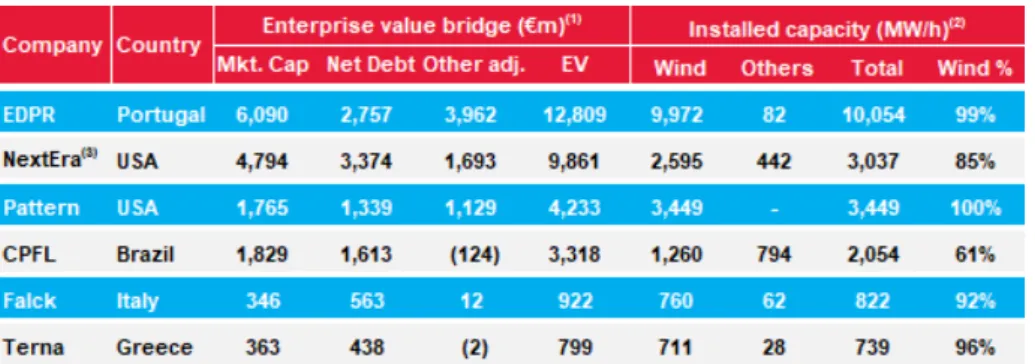
With the purpose of creating a benchmark for EDPR and performing a relative valuation based on implied market multiples, 5 peers were selected. Following the buy-backs by their respective mother companies of Iberdrola Renovables and EDF Energies Nouvelles in 2011, as well as of Enel Green Power in 2016, EDPR turned into the largest publicly traded pure onshore wind player in the European and American markets, making it harder to find similar publicly traded peers. In Europe, despite their smaller size in terms of installed capacity, Italian Falck Renewables and Greek Terna Energy were chosen, as 92% and 95% of their portfolios are based on on-shore wind, respectively. In Brazil, CPFL Renováveis was the best available option, with 61% of its portfolio based on wind onshore and the remaining based on biomass and small hydropower plants. In the United States, Pattern Energy Group is fully focused on wind onshore while NextEra Energy Partners also owns solar capacity and 7 natural gas pipelines (872km).
Chart 28: Wind load factor
Source: Factset, Novasbe research Note 1: EDPR and Falck also based on 1% and 8% non-wind respectively Note 2: Pattern figure based on UBS September 2016 estimate
Chart 29: 2016-2017 sales growth consensus estimate
Source: Factset, Novasbe research
Chart 27: Net debt/EV
Source: Factset, Novasbe research
Source: Company; Notes: (1) Including all cash-flows generated by the projects since inception; (2) also considers an additional 30 MW under development
Figure 1: Asset rotation transactions since 2014
According to EDPR, a total of 7 transactions were executed since 2014 at average EV/MWh multiples of
€1.5m/MWh
Implied market multiple after the tender offer by EDP took place is €1.2m/MWh
EDPRENOVÁVEIS COMPANY REPORT
PAGE 18/40 In terms of net debt to enterprise value ratio, EDPR has the lowest value among its peers with 22%, due to its diversified financing strategy. Note that for benchmarking purposes all companies were assumed to have no operating cash. Regarding load factor, the company is positioned lower than American and Brazilian peers and higher than European ones, with a 30% figure. There are robust onshore wind resources in Brazil and North America, and the majority is still unexplored, particularly in Brazil. On the other hand, Europe has less robust resources and a large portion of them are already exhausted. EDPR’s position naturally reflects its consolidated portfolio distribution, as 50% of capacity is based in Europe while 48% is based in North America and 2% is in Brazil. Analysts expect a sales growth rate of 26% in 2017 for the company, higher than European and Brazilian peers and lower than the North American one. Europe is facing a period of stabilization (with the uncertainty in renewable energy legislation periodically contributing to lower growth), and Brazil is coming from both political and economic crisis that have delayed the renewable energy shift. On the other hand, despite some early fears for President Trump’s intentions, positive political signs have been given and the United States government is expected to continue to encourage the development of the country’s wind energy resources.
Concerning profitability ratios, EDPR ranks 4th in 2017 estimated EBITDA margin
with 70%, behind American and Brazilian peers, accompanying the load factor trend already mentioned. The company is still behind CPFL and NextEra when accounting for estimated EBIT margin but Pattern drops to the lowest spot mostly because of different accounting standards regarding the depreciation of its wind turbines, as different life expectancies are considered. With the lowest EBITDA margin and high interest costs expected from the largest net debt/EV ratio, Falck is expected to have the lowest net profit margin with just 2% while EDPR ranks second with 10%.
Table 3: Overview of EDPR and its peers
Source: Companies, Factset, Novasbe research; (1) currency translations based on previous month average; (2) Based on latest disclose of controlled installations by companies as of 14/05/2017 (3) NextEra Energy Partners also operates 7 natural gas pipelines (872kms)
Chart 30: 2017 EBITDA margin consensus estimate
Source: Factset, Novasbe research
Source:Factset, Novasbe research
Chart 31: 2017 EBIT margin consensus estimate
Chart 32: 2017 net profit margin consensus estimate
EDPRENOVÁVEIS COMPANY REPORT
PAGE 19/40
Tender Offer by EDP
On 27 March 2017, EDP announced its intention to launch a non-mandatory public offer of € 6.80/share in cash for EDPR’s remaining 22.5% of capital and voting rights. EDP declared that it will maintain all strategic guidelines of EDPR and that it might pursue a delisting of the company if it gets 90% ownership after the offer. Before it can be formally launched, however, the prospectus needs approval from the regulator, which is expected to happen between Q2 17/Q3 17. MFS and Ecofin investment funds have both issued an open letter contesting the offering price and urging all shareholders not to accept the offer. The board of directors has analysed the offer and considered that “although the consideration offered by the offeror might not fully reflect the full potential value of the company in the long term, the consideration of the offer falls within a range of valuation of the company that is considered adequate”.
The offered price of €6.8 per share corresponds to a 9.7% premium to the previous day closing price. This premium may look attractive if we consider that it is inside an historical range of 1.9%-11.8%, based on previous closing prices of tender offers made by integrated utilities Iberdrola and EDF in 2011 and Enel in 2016 to regain full ownership of their renewable arms.
On the other hand, EDP’s offering also corresponds to a 10.5% premium over the weighted average price of the previous unaffected 6 months, which might not seem so generous if we take into consideration the premium range of 16%-24% offered in the same transactions. Furthermore, the company’s 6-month average may be considered depressed due to the decrease in valuation of the share price as a reaction to the outcome of the US elections, which seems to have been hasty based on the latest signs given by the new administration.
EDP initially sold shares in EDP Renováveis to the market in 2008 at €8 per share and has since then only paid minimal dividends. During the post-IPO period, capacity has significantly expanded, new markets were penetrated, operational metrics have increased and low interest rates have driven down the cost of capital, contributing to an increase in the fundamental value of the company.
The EV/MWh multiple was supported as a good comparison metric by CEO João Manso Neto who stated the following on the results conference call held on 24 February 2016:
"I would say that the best way of evaluating the assets is the price that we are being paid by them in megawatts in transactions. And I would say, if I want to value this company, I would look at the price that we are able to sell the assets."
EDPRENOVÁVEIS COMPANY REPORT
PAGE 20/40 At the end of the Q1 2017, EDPR owned 10,408 MW/h of installed capacity up and running. At the offering price of €6.8 per share, and accounting for net debt and other adjustments shown in the previous benchmark, the implied enterprise value should be 12,651m, corresponding to a multiple of €1.2m/MW. Nevertheless, In the March 2017 investors’ presentation, EDPR stated that the total 7 asset rotation transactions executed between 2014 and 2016 had been made at an average implied EV/MW multiple of €1.5m/MW. In 2017, EDPR announced the sale of another 442MW portfolio composed of wind farms in Portugal to China Three Gorges at a multiple of €1.7m/MW.
The company has an extensive pipeline, with PPA’s already signed and assets in construction and development which should also be considered. When selling up and running projects, EDPR is basically providing stable cash flow to its acquirers over a long period. However, the human capital that may generate growth opportunities stays in common shareholder’s hands and that should therefore contribute to a higher multiple.
If approved, the offer will come at a good timing for EDP as the company will benefit from a discounted price due to fears of changes in the US renewable energy policy which have emerged upon the election of Donald Trump as the new president of the United States.
We believe that EDP is also benefitting from a liquidity trap which it has created in 2008 when it decided to float only 22.5% of its renewable energy business. Institutional investors represent about 92% of EDPR’ investor base (ex-EDP) and managers may need to accept selling at a smaller premium in order to respect liquidity requirements of their funds. In case EDP obtains over 90% of the ownership and decides to delist the company, a “zombie” stock may not be pleasant to hold.
This offer comes at a discount against our fair value estimate which has been based on the company fundamentals (€8.38/sh YE17). We are confident that the company’s operations are worth substantially more than what the offer implies. EDP is also aware of the discounted price of its renewable energy arm and is taking advantage of a fragile minorities position. Nevertheless, we recognise that holding minor stakes of a stock with a very low level of liquidity may have a severe downside. Unless a major player comes into action to competes against EDP with a higher bid, investors may want to lock in the return from the small premium and avoid potential risks of an unfavourable outcome from the tender offer.
EDPRENOVÁVEIS COMPANY REPORT
PAGE 21/40
Investment Case
Valuation Framework
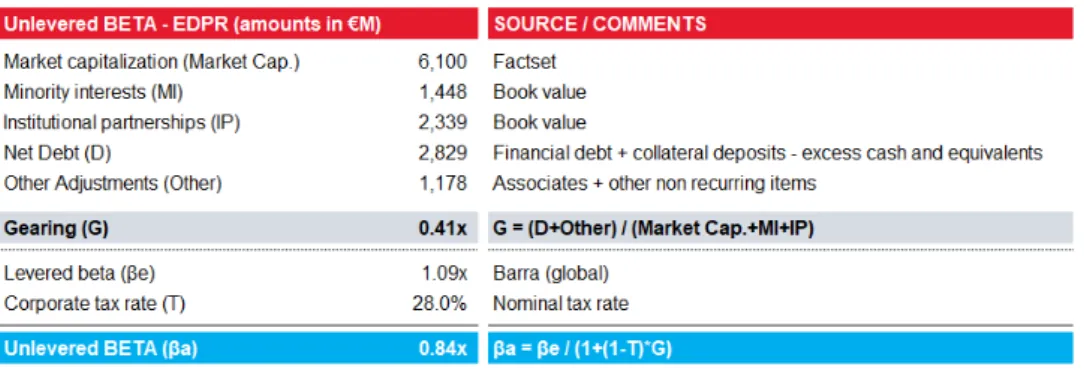
EDPR plans to keep its net financial debt constant over the long term and, as such our valuation was based on the adjusted present value approach. Although the company does not provide detail for each wind farm which it currently holds, it gives relevant information for each geography where it operates (Belgium, France, Italy, Poland, Romania, Portugal, Spain, North America and Brazil). As such, operations in the various regions were individually evaluated, with the enterprise value corresponding to the aggregate unlevered value of those parts. The adjusted present value of the company resulted from the sum of the unlevered enterprise value with the present value of interest tax shield provided in perpetuity by the company’s net debt. Furthermore, the value of associates, joint ventures and other non-recurring items was added before deducting the value of net debt, institutional partnerships liabilities and minority interest’s shares to reach the fair value of common shareholder’s equity. Finally, by dividing the fair value of common equity by the number of outstanding shares, the fair value per share was obtained.
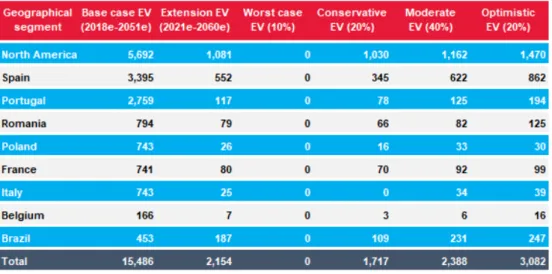
In addition to the geographical segmentation, the value of unlevered operations was also split between two parts:
The first part is the base case, and it represents most of the estimated value per share. It is based on a projection of cash flows during the expected life of the company’s current installed capacity and the additions projected by EDPR in its business plan for 2016-2020. Due to the stable long-term nature of the remuneration schemes and the clarity over the capacity additions, this case is expected to be subjected to a lower level of volatility and thus a single scenario was built.
The second part is an extension of the base case, and corresponds to a projection of cash flows deriving from eventual capacity additions by EDPR between 2020 and 2030. The outcome is less substantial in terms of value due to the compounding effect of the opportunity cost of capital. As it corresponds to a more distant period without any business plan provided by the company, it is a more volatile forecast. To account for different possible outcomes, four scenarios were projected.
After 2030, our valuation did not consider additional capacity expansions. This was motivated by two factors: First, the compounding effect of the opportunity cost of capital would turn the potential cash flows from that period into immaterial
EDPRENOVÁVEIS COMPANY REPORT
PAGE 22/40 amounts. Second, it was assumed that new players would be entering the wind power market seeking to benefit from its profitability, increasing wind-power supply and consequently decreasing prices per unit of electricity, contributing to a long-run equilibrium in which the return for common equity investors would be equal to the opportunity cost of their capital, nullifying the prospect of economic value creation.
General Methodology
The general methodology described below was fully implemented on the base case of this valuation. For the 2021-2030 extended case, some specific variations were incorporated, which will be explained on a later section.
Electricity Sales
Annual revenue from the sale of electricity results from the product between annual electricity output and the average nominal price paid for each unit. Annual electricity output is calculated through the following formula:
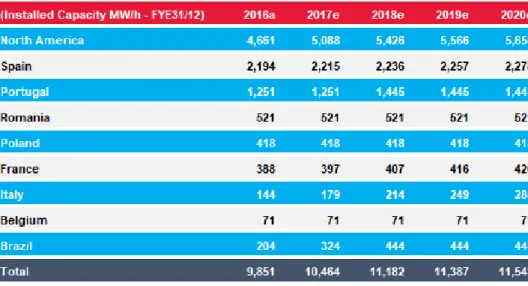
For simplicity, installed capacity may be treated as “capacity” and electricity output as “output”. Output and capacity inputs used for the computation were based on the same unit (GWh). Additions presented by the company in its business plan have been treated in two distinct ways. Expansions mentioned as “secured” or “awarded” are very probable to be materialised and thus 90% of those were considered in our valuation. On the other hand, the company also mentions capacity expansions “under negotiation” or “identified”, which were considered less probable to occur and therefore only partially (50%) considered.
Table 4: 2016 capacity and projections for 2017-2020
EDPRENOVÁVEIS COMPANY REPORT
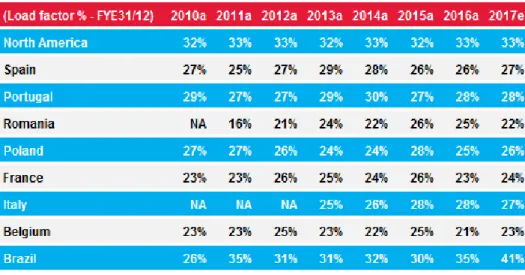
PAGE 23/40 The average annual load factor, although exposed to a certain level of volatility, should tend to an average historical performance, as the company’s ability to modify it is practically null. Two complementary approaches were used to estimate it: For the current capacity, the average annual load factor in the geographical segment since 2010 was computed. For the projected additions, historical wind performance of the new sites was used, as long as the company had shared that information. Otherwise, the new capacity had an expected load factor equal to the average of the current capacity in that specific geography.
Electricity prices vary between countries and are influenced by electricity schemes and regulations presented in a previous section of this report. With that in mind, Brazilian, Portuguese, Polish and French average annual nominal prices were estimated based on their 2016 average prices per MW and the projected annual inflation provided by Oxford Economics; Romanian, Italian and Belgian prices were modelled after their 2016 average prices, with the real part correlated to the evolution of the average cost of gross electricity generation projected by the European Commission in its reference case and then adjusted to inflation. In Spain, we computed the average real price obtained by EDPR per MW since 2014, after the last energetic reform took place, and adjusted to inflation, considering that the difference between that price and the pool price would be compensated by a government premium. Finally, in North America, the estimated price per MW was split in two layers. The first layer is related to purchasing power agreements, hedged contracts and a Canadian feed-in-tariff whose prices were estimated based on 2016 annual average and inflation projections. The second layer comprises capacity exposed to the merchant price, whose price was correlated to electricity generation price projections from the reference case of the U.S Energy Information Administration.
Table x: Historical load factor and 2017 projections
Source: Novasbe research
EDPRENOVÁVEIS COMPANY REPORT
PAGE 24/40 Since wind farms have a life expectancy of 30 years and the average life of windfarms per geography is disclosed by the company, output and the associated revenues were forecasted during the remaining average expected life of current capacity and projected additions in each segment.
Income from Institutional Partnerships
Income from institutional partnerships corresponds to the recognition of income provided by production tax credits conceded by the US government. To compute the annual forecast, the historical average contribution per output unit was multiplied by the output until the average life of wind farms in the United States reached 10 years and the incentive ceased.
Operating Costs
Operating costs comprise supplies and services, personnel costs and direct and indirect taxes (other than corporate income taxes). For each region, supplies and services costs reported since 2010 have been adjusted to 2016 prices and divided by the output in the respective years. Furthermore, an average of the annual ratios was multiplied by the output forecasted for each year, before being adjusted to reflect the estimated inflation and obtain the nominal supplies and services costs for each projected year. Contrary to the supplies and services costs, the correlation between personnel costs and capacity is greater than the
Table 6: 2016 average prices and projections for 2017-2020
EDPRENOVÁVEIS COMPANY REPORT
PAGE 25/40 one with output, as the company can avoid some supplies and services in a bad wind year but cannot avoid paying its employees in the same context. As such, annual personnel costs adjusted to 2016 prices since 2010 were divided by the respective average annual capacity. An average of the annual ratios was then multiplied by each forecasted year’s average annual capacity before adjusting to inflation to obtain the nominal personnel costs. Finally, direct and indirect taxes (other than income taxes) have shown a significant correlation with the annual electricity sales as they also depend on the price that the company receives for each electricity unit. An average of the annual ratios between taxes and electricity sales was multiplied by the forecasted annual sales. There was no need to adjust for inflation since the annual sales already reflect that effect.
Property, Plant, and Equipment
Contrary to income statement items, there is limited geographical segmentation for balance sheet data disclosed by the company. Therefore, the breakdown of historical gross property, plant, equipment and intangibles (PPE) and respective accumulated depreciation was estimated by dividing the consolidated figures proportionally to the historical capacity in each region. For the years to come, gross PPE figures result from the product between forecasted accumulated capacity (MWh) and the 2016 ratio of Gross PPE value per MWh. Annual depreciation of PPE results from the division between average active (not fully depreciated) gross PPE in the year (excluding land and assets under construction) and the expected life of the assets. Since depreciation is a non-cash item, and wind turbines correspond to c.98% of gross PPE, it was assumed for simplicity purposes that all PPE had the same 30 years of life expectancy. Hence, accumulated depreciation was derived from the cumulative sum of the previous year figure with annual depreciations until net PPE turned null.
Working Capital
Working capital items are comprised of current and non-current receivables and payments from commercial activities, inventories, current tax assets and liabilities, deferred tax assets and liabilities; and operating cash and equivalents. Operating cash was estimated as 5% of respective annual electricity sales, while the remaining items were forecasted by multiplying their average ratio to electricity sales since 2010 by the electricity sales in the forecasted years.
Exchange Rates
43% of 2016 EDPR revenues were exposed to the US dollar while 6% were exposed to Romanian Leu, 5% to Polish Zloty and 2% to Brazilian Real. The
EDPRENOVÁVEIS COMPANY REPORT
PAGE 26/40 remaining 46% were based in euros (local currency). To forecast the exchange rates of the foreign currencies it was assumed that relative purchasing power parity holds across all regions where EDPR operates. In that case, changes in exchange rates should perfectly match differences in inflation between currencies, as demonstrated the following formula:
For the case of the Euro, instead of using the inflation for a specific country, the Eurozone inflation was used. Income statement items have been converted using the respective average annual exchange rate which was calculated by averaging the closing exchange rate of the current and previous years. On the other hand, balance sheet items have been translated by using the closing exchange rate for the respective year. Exchange differences’ gains and losses have been calculated and integrated in each geographical income statement, when applicable.
Interest Tax Shield
As explained earlier, EDP Renováveis is focused on financing its operations through retained cash flow, asset rotation and tax equity from partnerships in the U.S. Although some restructuring may occur to decrease interest rate costs, the level of financial debt is to be kept relatively constant in the long-run. Additionally, FCF that the company chooses to retain will be used to finance new operations as opposed to bearing interests. As such, and considering that the company will operate in perpetuity, the following formula should be applicable:
Where stands for net debt, stands for cost of debt and for tax rate. Although the company wants to avoid holding excess cash to bear interests, some cash may be held during certain periods while the company decides in which projects to invest it. Therefore, we considered that the current amount of non-operating cash held by the company was capable of bearing interests, creating a negative effect in the interest tax shield. Moreover, we considered the Spanish tax rate for tax shield purposes, as most of the company’s debt is financed by EDP group in Spain.
Institutional Partnerships
The company has partnerships with institutional investors in the United States in the form of operating agreements established through Limited Liability