Volume VI, Issue 3, 2018
pp. 47-79
Quality of Board Members’ Training and Bank Financial
Performance: Evidence from Portugal
V.M. Morais Pereira
1, J.A. Candeias Bonito Filipe
2 Abstract:This study examines the impact of the quality of board members’ training on the financial performance of Portuguese banks. The study employs a sample of 276 board members.
Financial ratios such as return on average assets (ROAA) and return on average equity (ROAE) are used as measures for gauging banks’ financial performance. Three indexes are used as proxies for board members’ educational qualifications, specifically: Eduindex, for all academic qualifications obtained in areas such as business or economics; EduindexDP, for all qualifications obtained in prestigious domestic business schools; and EduindexFP, for all qualifications obtained in prestigious foreign business schools.
The study findings have important policy implications, specifically a positive and significant impact on the bank’s financial performance from having board members holding degrees from prestigious foreign business schools. In particular, the findings suggest that the prudential supervision developed by Banco de Portugal in cooperation with the European Central Bank should include a more rigorous process in the selection of board members. The present study is one of the first attempts in the literature emphasizing all these aspects simultaneously, that is, the banking sector, quality of board members’ training, and Eduniversal Rankings, in the context in which all the banks of a specific country are analysed.
Keywords: Boards’ characteristics; bank performance; corporate governance; boards of directors; educational background; Portuguese banks.
JEL Classification: C10, G20.
1ISCAL - Instituto Superior de Contabilidade e Administração de Lisboa, Instituto Politécnico de Lisboa, Avenida Miguel Bombarda, No. 20, 1069-035 Lisboa, Portugal,
vmpereira@iscal.ipl.pt
2Instituto Universitário de Lisboa (ISCTE-IUL), Business Research Unit (BRU-IUL) and Information Sciences, Technologies and Architecture Research Center (ISTAR-IUL), Lisboa, Portugal, jose.filipe@iscte-iul.pt
*Aknowledgements: The authors acknowledge financial support from Instituto Politécnico de Lisboa, research project IPL/2017/CGB/ISCAL.
1. Introduction
Banks are an essential part of an economy, and the governance of banks themselves is central to a country’s economic development as most businesses and individuals depend on the services banks offer. The importance of the banking sector is widely recognised and its central role in the everyday activities of businesses and individuals is relevant to the present analysis and emphasizes the importance of this study.
Banks have specific characteristics that make them different from other firms. First, banks have a higher level of opacity associated with the services they sell than other industries. Second, a central bank is a national authority that regulates the country’s banking system; for instance, most European banks are co-regulated by the European Central Bank (ECB). These two main aspects justify a major development for the existing body of research, which considers banks as a sample.
Over the years leading up to the financial crisis that started in the US in 2007, many banks registered serious problems while several experienced massive defaults and bailouts. This can be attributed to widespread failures that banks allowed to grow internally and within the system. Perhaps, it is a combination of an overcapacity – excess employees and a larger branch network – an oversized banking system, or the dramatic failures in corporate governance, yet to be highlighted, that contributed to the crisis. Taking this last reality into account, many experts concluded that failures in corporate governance planning that encourage aggressive risk taking are mainly responsible for the events that led to financial crisis in 2007. For example, (Kirkpatrick, 2009) implicated the various lapses in corporate governance as one of the reasons for the 2007 global financial crisis. As Kruglikova et al. (2018) state, the financial crisis of 2007-2009 revealed the imperfection of the banking regulatory system.
Adams and Mehran’s (2012) study on corporate governance in banks emphasized the strong need for taking into account the particularities of banks when implementing corporate governance reforms. Lawton and Nestor (2010), who are recognized corporate governance experts, argued that very few jurisdictions had devised extensive bank-specific governance requirements. Thalassinos et al. (2011) integrate corporate governance as one of five banks responsibilities’ categories when the measuring the bank’s financial health is intended. In the context of corporate governance crises in banks and in terms of certain intrinsic factors that are essential for its understanding, more research is required in the pursuit of solutions for problems and difficulties emergent in corporate governance of banks.
This study examines several aspects related to the influence of boards of directors on banks’ performance during the financial crisis. In particular, this study analyses if the quality of training for board members significantly influences banks’ performance.
With this objective, there are several orders of reasons justifying the relevance of the present research. The reasons are as follows:
• First, studies focusing on the quality of board members’ training are relatively few and comprehension of this phenomenon is limited for banks’ supervisors.
• Second, the majority of the current state-of-the-art considers the variable ‘education’ in terms of quantity but not quality by using globally accepted rankings such as Eduniversal rankings.
• Third, a significant part of the existing literature does not consider all the banks operating in a single country (samples only consider public-traded banks).
• Fourth, this study uses hand-collected data from the annual reports of banks and other sources such as Zoominfo, a leading database provider. This ensures the development of a highly representative and rigorous research. • Fifth, the Portuguese banking system can be used as a natural experiment
since it registered several problems after the 2007 financial crisis, with many banks rescued such as Banco Português de Negócios (BPN) or Banco Espírito Santo (BES).
The more relevant literature on the quality of training of members of banks’ board of directors is by (Chevalier and Ellison 1999), who examined the quality of undergraduate institutions (e.g. higher-Scholastic Aptitude Test (SAT) by using a sample of 492 fund managers. The mutual funds studied were listed in Morningstar, a global investment research and investment management firm headquartered in the US. The authors concluded that mutual fund managers from more selective undergraduate institutions registered higher performance than those from less selective ones. Moreover, (Golec, 1996) studied the impact of mutual fund managers’ characteristics on their portfolio performance and argued that investors can expect better risk-adjusted performance from younger managers with Master of Business Administration (MBA) degrees. In turn, (Fich, 2005) defended that academic backgrounds of appointees are not significantly related to the cumulative abnormal returns (CARs) obtained. The study results were obtained from research examining if outside directors are better than others in a sample of directors from Fortune 1000 firms.
Gottesman and Morey (2006) studied the influence of manager education on mutual fund performance and showed that the mean graduate management admission test (GMAT) score for an MBA programme is positively and significantly related to fund performance. Their research also shows that did not find a significant the effect of other educational variables on mutual fund performance, such as a CFA designation or a PhD degree, was largely insignificant. According to Kauko (2009) vocational level qualification in business administration apparently is the best education in the case of very small banks, while preceding research shows that a
university degree is the best option for larger banks. Finally, Haitao et al. (2011) argue that hedge fund managers with higher-SAT scores from undergraduate institutions take fewer risks and contribute towards improved raw and risk-adjusted returns and more inflows.
At least two gaps are detected in the literature. First, the present state-of-the-art review does not consider global business education rankings. The empirical studies mainly focussed on US universities and do not considering if managers acquired their degrees from a prestigious European university. Second, further research is needed to study board members’ quality of training and its influence on banks’ performance considering global business education rankings. Therefore, this study intends to analyse if the quality of training of members on the boards of Portuguese banks is relevant to banks’ performance using the Eduniversal rankings.
This study’s contribution to the existing literature emphasizes corporate governance in banks, which continues to be limited. This study allows a better understanding of the relationship between the quality of board members’ education and banks’ performance. The remainder of the study is organized as follows. Section 2 presents the literature review and hypotheses development and Section 3 describes the data and methodology. Section 4 discusses the empirical results, Section 5 provides the robustness tests, and Section 6 concludes.
2. Literature review and hypotheses development
2.1 Directors’ educational level and banks’ financial performance
In the literature, there is a strand of research that studies the possible effects of directors’ education on company performance. Overall, the results are inconclusive and further research is required. On the one hand, Hau and Thum (2010) argue that board members’ education does not have a significant correlation with bank losses. On the other hand, Nguyen et al. (2015) show that executive education creates shareholder wealth in the US banking sector. Likewise, there is a line of research that only considers financial firms as the sample and relevant literature is scarce, especially for banks in this case (Baldacchino et al., 2017; Grima et al., 2017; Mahboud, 2017).
While studying the impact of mutual fund managers’ characteristics on their portfolio performance, Golec (1996) reasoned that investors can expect better risk-adjusted performance from younger managers with an MBA degree. Similarly, Chevalier and Ellison (1999) found that managers with an MBA status do not register significantly better performance than those without such qualifications. Interestingly, (Kauko, 2009) discovered that in the case of very small banks, vocational-level qualification in business administration is apparently the best form of education. The preceding research holds that a university degree is the best option in the case of larger banks. A study by Hau and Thum (2010), covering the effects of
the educational background of supervisory board members of German banks, showed that on average board members’ education does not have a significant correlation with bank losses. In their study covering the German banking sector, Berger et al. (2014) found that portfolio risk declines when board changes increase the representation of executives holding Ph.D. degrees. Additionally, (Nguyen, Hagendorff, and Eshraghi 2015) argued that the education of executives creates shareholder wealth in the US banking sector. However, this study also revealed that no measurable market returns were registered for the particular case of an MBA degree.
Pereira and Filipe (2015) while studying the Portuguese banking system, identified a significant impact of an educational index in terms of banks’ return on average equity (ROAE), but the same impact did not persist when banks’ return on average assets (ROAA) was used. Similarly, King et al. (2016) argued that CEO educational attainment, considering both level and quality, is relevant for bank performance. This study used a sample of CEOs from publicly-listed US banks during the period from 1992 to 2011. Another study from Fernandes et al. (2017b) emphasized that directors’ qualifications may affect banks’ performance, and if the level of directors’ qualifications are higher, they will be capable of making better corporate decisions. The previous aspect is more relevant for banks in which the complexity of their activity is higher than others. In this research, the authors used a sample of 72 publicly-listed European banks. Using a sample of the largest financial firms in the US, (Gande and Kalpathy, 2017) found that the presence of a CEO with an MBA from a top 20 business school positively improves a bank’s buy and hold returns. From the literature analysis it is possible to expose some significant review articles that emphasized the importance of examining the competencies of board members on bank corporate governance. For example, Ahrens et al. (2011) argued that future research on corporate governance should consider the concept of ‘economic competence’ using a more relevant approach, aiming to measure board members’ competencies (e.g. experience or education). On this track, Hopt (2013) argued that ‘qualification’ or ‘experience’ of bank board members is, in fact, more important than their ‘independence’, representing a variable much investigated by many authors. Cited by Larcker and Tayan (2015), Sheila Bair (former chair of the Federal Deposit Insurance Corporation of the US) said ‘...it´s really more about the people and whether they are competent and setting the right tone and culture’.
Furthermore, De Masi, and Paci (2016) argued that the current literature on banks’ corporate governance is inconclusive on the effect of financial expertise on banks’ performance. They suggested that future research should consider additional variables such as board interlocks and directors’ networks. Finally, Fernandes et al. (2017a) concluded that lack of financial expertise on banks’ boards could be a relevant factor in the 2007 financial crisis.
The literature review presented above evidenced that the current research on the influence of directors’ education on banks’ performance is mainly focused on samples that considered US banks Boyd et al. (2011). Moreover, samples used in the current literature mainly consider publicly-listed banks or large banks, excluding small- and medium-sized banks. Furthermore, there is a tendency to only consider CEOs in the empirical studies. Therefore, in the present research, we include all the banks operating in a single European country (Portugal), as it allows comparing different types of banks based on their size.
The first reason for choosing Portugal is the fact that this country experienced several problems in the banking system. Four banks, namely Banco Português de Negócios, Banco Privado Português, Banco Espirito Santo, and Banco Internacional do Funchal, have registered serious financial constraints since the global financial crisis in 2007.
For the purpose of our study, we consider all the banks operating in a single country. In the case of Portugal, the banking system presents a number of banks from whom it is reasonable to hand collect available data. However, this would not have been feasible when bigger countries are considered. Besides, a sample is required for a such a study and it would not be possible to consider the entire population of a country, unlike in our study. Additionally, Portugal represents the particularities of a small country, as it differs from a large country like the US in terms of the many items analysed in the context. For example, Portuguese companies are small, typically family-owned, and are not publicly traded on the Portuguese stock index PSI-20. These aspects would probably affect corporate governance practices and thus, our choice of Portugal would help to examine what we intend to study. Based on this, a clear question at this stage is: by accepting the existence of significant particularities due to the size of different countries, do the results from (Chevalier and Ellison, 1999) and (Gottesman and Morey, 2006) hold for the case of a sample of banks in a small country? Based on the abovementioned studies, we claim that board members’ qualifications are important to ensure their managing abilities. The first hypothesis (H1) is formulated as follows:
H1. Educational attainment and/or executive formation held by board members positively relate to banks’ financial performance.
Hypothesis 1 refers to the resource dependence theory based on the principle that a bank’s board members use their resources (e.g. education) to make the best decisions that positively reinforce performance. Considering a multi-theory perspective (Boyd et al., 2011), we use H1 to simultaneously test if banks’ board members use their qualifications in their own interest. Thus, it means that board members’ qualifications could negatively affect a bank’s performance, which is close to the agency theory perspective.
2.2 Directors’ educational attainment acquired from prestigious universities correlates to banks’ financial performance
Gottesman and Morey (2006) developed a strand in literature considering the possible effects of quality of training of directors on corporate performance. These authors found that mutual fund managers with MBAs from schools in the top 30 of Bloomberg Businessweek rankings of MBA programmes show superior performance when compared to mutual fund managers with non-ranked MBAs. They used scores of GMAT, SAT, and LSAT (Law School Admission Test) to measure the quality of training.
Erkens and Bonner (2013) found that accounting financial experts hold lower director status than other directors by considering, for example, the variable Elite education. This research considered the appointments of accounting financial experts to the audit committees at S&P 1500 companies for the period between 1999 and 2008. The variable Elite education used in this study considered two groups of the most prestigious universities in the US. The first group included Harvard University, Princeton University and Yale University. The second group was composed of Columbia University, Cornell University, Dartmouth College, Johns Hopkins University, Massachusetts Institute of Technology, University of Pennsylvania, Stanford University, and Williams College. Similarly, Badolato et al. (2014) found that audit committees with both financial expertise and high relative status are associated with lower levels of earnings management. Therefore, results revealed that financial expertise has its own limitations and the status needs to be considered.
However, considering the literature review regarding the association between the quality of training of directors of boards and banks’ financial performance it is obvious that it is limited and incomplete. The relevant article from Gottesman and Morey (2006) needs to be complemented with studies from other countries and applied specifically to banks. The use of global business school rankings is also an improvement in terms of research that can increase the generalization of results. Reflecting on the above contributions, this research aims to add new dimensions to the literature and implements a set of procedures to work towards this objective. In this study, to evaluate the quality of Portuguese business schools, we use the widely recognized Eduniversal ranking that considered only six Portuguese Business Schools in 2015, although only five have dean recommendation scores (Table 1). Based on the literaturereview, we conjecture that banks’ board members who hold qualifications from prestigious Portuguese universities may have better technical skills that improve their daily decisions on management, and this could affect banks’ performance positively. We propose the second hypothesis (H2) as follows:
H2. Degrees and/or executive formation (obtained from prestigious domestic business schools) held by board members relate positively to banks’ financial performance.
We applied the basic premise of resource dependence theory in H2 to test the positive effect of bank board members’ qualifications on performance. To explain the negative effects in H2, we used the agency theory perspective, which refers to a conflict of interest between managers and shareholders.
Table 1 Eduniversal Rankings 2015 (Portugal)
5 Palmes of Excellence - Universal Business School with Strong Global Influence
Rank by Palmes League
Dean’s Recommendation Rate 2015
Universidade Nova de Lisboa – Nova School
of Business and Economics 1 266‰
4 Palmes of Excellence - Top Business School with Strong Global Influence
Rank by Palmes League
Dean’s Recommendation Rate 2015
Universidade Católica Portuguesa –
Católica-Lisbon School of Business & Economics 1 250‰ 3 Palmes of Excellence - Excellent Business
School withStrong Global Influence
Rank by Palmes League
Dean’s Recommendation Rate 2015
University of Porto – School of Economics and
Management and Porto Business School 1 188‰ ISCTE Business School – University Institute
of Lisbon 2 136‰
ISEG Lisboa – School of Economics and
Management, Universidade de Lisboa 3 101‰
2 Palmes of Excellence - Good Business School with Strong Global Influence
Rank by Palmes League Deans’s Recommendation Rate 2015
AESE Escola de Direção e Negócios 1 -
Source: Eduniversal Rankings.
A professional who holds a degree from a prestigious foreign university is considered to be better prepared than one who obtained the degree from a Portuguese university. In the areas of business and economics, top Portuguese business schools recently edged closer to global standards by obtaining international
accreditations (AACSB, EQUIS, and AMBA). This is a relatively recent phenomenon because in 2008 only one Portuguese Business School (Católica Lisbon School of Business & Economics) was accredited by these three prestigious management education accreditation agencies. More recently, a Portuguese business school (Nova School of Business and Economics) was accredited with five levels of excellence, which Eduniversal titles the Palme of Excellence. Portugal has only six business schools in these rankings, which is reasonable considering the country’s population and comparing it with the average of other European countries.
Nevertheless, there is a slight gap between the top-ranked universities in the US and in Portugal in the type and quality of knowledge, which affects the international academic recognition of Portuguese universities. This difference may be the outcome of fewer financial resources available for research and teaching in Portuguese universities. This reality exists because the scale is considerably different between Portugal and the US in terms of not only number of students but also number of academicians. Although both new technologies and information sharing can reduce this gap, the truth is that in some areas of business/economics it is difficult to expose students to certain teaching topics due to insufficient scale or financial resources.
Owing to this reality, students prefer to study abroad by considering the reputation of a particular business school to improve their language skills and for international experience. In the case of Portugal, it is normal that students who go to study abroad look for universities in the US, the UK, and France. For H2, we used Eduniversal rankings to evaluate the quality of training in foreign universities. We predict that board members who hold qualifications from prestigious foreign universities have better technical skills to make daily management decisions that positively affect banks’ performance. We propose our third hypothesis (H3) as follows:
H3. Degrees and/or executive formation (obtained from prestigious foreign business schools) held by board members relate positively to banks’ financial performance. On the one hand, for H3 we conjecture that a positive effect is justified by the resource dependence theory considering that managers use all available resources to benefit banks’ performance. On the other hand, considering H3, we believe that if a negative outcome is provided, an agency theory perspective may support the result.
3. Research Design
3.1 Timeline
This research was conducted using corporate governance data for the year 2011 as the Financial Assistance Programme to Portugal was negotiated during May of the same year. The referred programme was an agreement between four partners: the Portuguese government, the International Monetary Fund (IMF), the European
Commission, and the European Central Bank (ECB). The Financial Assistance Programme enforced several targets, for example, that for capital and liquidity to be accomplished by the Caixa Geral de Depósitos (CGD) after 2011, a major state-owned bank operating in Portugal. This research aims to assess if corporate governance data, in particular, board members’ qualifications affected banks’ performance in the following three years (2012–2014). For the period 2012–2014, it is assumed that board members were nominated for a three-year period and the rotation of board members was high. In fact, it is not usual that members of boards are nominated for the second three-year term; however, it was not expected during Portugal’s banking sector crisis.
3.2 Sample of banks
Data used in this research involved all Portuguese banks registered at the end of December 2011; in this case, 34 banks. However, in a few cases, information available for some banks is limited and some banks were excluded from the sample for reasons that will be explained later. Our final sample includes 25 banks which are representative, as 73.5% of all the banks operating in Portugal since 2011 are included in the sample.
The majority of financial data were obtained from Moody’s Analytics BankFocus, a comprehensive global database containing information on public and private banks; biographical information on board members was collected from BoardEx database, which is a business intelligence tool. It was necessary to complement these data with information from banks’ annual reports. The databases were checked manually and several errors were identified. Data on board members comprised 276 elements but only 180 elements could be used in the research because 96 elements did not have sufficient information. For the 180 elements considered, some variables did not have adequate information. Furthermore, there were several limitations regarding the data used; in several cases, some board members were excluded from the sample.
3.3 Construct measurement
This analysis focuses on data from Portugal. The study did not face concerns of comparability of constructs as seen for multi-country studies. The Banco de Portugal is the central bank of the Portuguese Republic and regulates the country’s banking system in association with the European Central Bank, ensuring that the main rules are the same for all banks operating in the system. However, we exercised caution in the case of public-traded and state-owned banks as there are specific rules or recommendations that make thesebanks different from other types of banks. To deal with such concerns, we include two control variables, a dummy variable that considers if the bank is or not publicly-traded and a second dummy variable that considers if the bank is or not privately-owned.
3.4 Main variables
3.4.1. Bank performance measures
The main measures used for bank performance are ROAA and ROAE for the period between the end of 2012 and the end of 2014. Data were gathered from Moody’s Analytics BankFocus. These two ratios are widely used to measure the profitability of banks and are reliable for the present sample. In fact, the majority of banks in the analysis are not publicly-traded (21 out of 25).
3.4.2. Board members’ qualifications
This research is focused on assessing the possible outcomes of qualification of board members on bank performance, both in terms of quantity and quality. Therefore, three indices were considered to aggregate information on the academic qualifications of each board member. Eduindex aggregates the qualifications of board members. EduindexDP takes into consideration the quality of board members’ educational attainment obtained from prestigious domestic universities (Eduniversal). EduindexFP aggregates board members’ qualifications obtained in prestigious foreign universities (Eduniversal).
The methodology used in this study is equivalent to the one used by Hau and Thum (2010), consisting of using indices to test the effects on losses made by German banks. First, every qualification that a board member holds is considered to have the value of 1 (similar to the format of a dummy variable). Second, all values of the dummy variables are summed in order to obtain the respective index. Finally, the sum of the dummy variables is divided by the number of board members. It is particularly relevant here that the best business schools operating in Portugal typically maintain this position over the years. Therefore, even if some board members obtained their qualifications a few decades ago, it is highly probable that the quality of these business schools did not change considerably. For example, according to (Eduniversal, 2012), Portugal’s top five business schools in 2012 continued to deliver the same quality in 2017.
3.4.3. Control variables
The decision to include control variables in our study is based on the suggestions from Bernerth and Aguinis (2016). First, we assume that the selected control variable relates to those included in our study, meaning that a strong correlation may exist between them. Second, previous researchers also considered this proposition. Third, some studies found empirical relationships between the selected control variable and variables analysed in our study. Fourth, in our opinion, the selected control variables are partly essential to validate our empirical model.
In terms of corporate governance, several studies have regularly used the natural log of total assets as a control variable, specifically to control the effects of firm size. This aspect can be seen in the studies developed by Kim (2005), Dunn and Sainty (2009), and Garcia-Meca et al. (2015). In the present study, the natural log of total
assets is an important variable because there are major size differences for banks operating in the Portuguese market.
Moreover, a dummy variable is used to control the effect of ownership; the fact that a bank is state owned or privately owned could represent a significant effect on the performance of banks. In the case of Portugal, this is a relevant factor because the bank with a greater market share is completely state-owned Caixa Geral de Depósitos (CGD), and the inclusion of this variable is useful to test if there are any relevant differences. This variable was considered in corporate governance studies, as in the case of Kim (2005) and Liang et al. (2013). Therefore, state-owned banks normally have to fulfil additional requirements compared to privately owned banks. In Portugal, the board of directors of CGD normally follows the directions of the Portuguese government, which is represented by the Minister of Finance.
The Portuguese banking system improved its equity levels, sometimes as recommended by the country’s respective Central Bank, but mandatory in other cases. Therefore, the bank’s board of directors has been dealing with the need for improving the bank’s equity levels to accomplish the previously defined rules. In this study, ‘Tier 1 ratio’ was included as a control variable with the objective of monitoring possible effects on the bank’s performance (even if the effect is only indirect). The use of ‘Tier 1 ratio’ is also considered a measure of risk; as stated by Kwan and Strahan (2004), firms with additional capital are assumed to be less risky. As a complementary measure of risk and to effectively control the possible effects of risk on banks performance, ‘“Risk 1’, representing the standard deviation of ROAA, was considered as a variable. The inclusion of ‘Risk 1’ is justified once the sample of banks is composed largely of non-listed banks as the use of measures such as Tobin’s Q is not allowed. However, we included a control variable ‘Public Traded Ownership’ to check if there are relevant differences between listed banks and non-listed banks.
We also consider that the period of analysis has a high probability of being affected by banks’ performance in the previous years, including the control variable ‘ROAE Crisis’ for the period 2009–2011 and the control variable ‘ROAA Crisis’ for the period 2009–2011, for checking this possible effect. These two ratios assume the format from Fitch/Moody’s Analytics BankFocus. All variables used in this study are compiled in Table 2.
Table 2. Definition of Variables Variables Measures
Panel A: Dependent variables ROAA
Net income/average total assets (Fitch/Moody’s Analytics BankFocus format) (years 2012–2014)
BankFocus format) (years 2012–2014) Panel B: Board members’q ualifications Eduindex
Index that aggregates the qualifications of board's members in the areas of economics/business (year 2011)
EduindexD P
Index that aggregates the qualifications of board's members obtained in domestic prestigious universities (areas of economics/business) (year 2011) EduindexFP
Index that aggregates the qualifications of board's members obtained in foreign prestigious universities (areas of economics/business) (year 2011) Panel C:
Other control variables Private
Ownership Dummy variable equal to 1 if a bank is privately-owned
Public-Traded
Ownership Dummy variable equal to 1 if a bank is publicly-traded Bank size Natural log of assets (years 2012–2014)
ROAE Crisis
Net income/average stockholders' equity (Fitch/Moody’s Analytics BankFocus format) (years 2009–2011)
ROAA Crisis
Net income/average total assets (Fitch/Moody’s Analytics BankFocus format) (years 2009–2011)
Risk 1 Standard deviation of ROAA Tier 1 ratio Tier 1 ratio (years 2012–2014)
3.5 Power analysis
According to Boyd et al. (2017), the inclusion of power analysis is very rare in corporate governance studies. As these authors state, evaluating statistical power is significant considering the small effect sizes found in governance studies. Moreover, Boyd and Solarino (2016) found that effect sizes are normally low in the greater part of social science research.
In our analysis, we conducted a priori power and sample size tests. First, we performed linear regression using ROAA as the dependent variable and the variables representing board members’ qualifications. Using Eduindex as an independent variable, we found an estimated power of 0.0997. Using EduindexDP as an independent variable the estimated power was 0.1582. However, when EduindexFP was used as the independent variable the estimated power was 0.9021.
We performed a similar power analysis considering ROAE as the dependent variable. For Eduindex, the estimated power is not applicable because the obtained R-squared is 0. Moreover, for EduindexDP, the estimated power is 0.0902 and for EduindexFP, it is 0.9519. Accordingly, it is possible to conclude that the variable EduindexFP shows promising results in terms of affecting banks’ performance. The estimated powers would obviously be reduced when we introduce control variables in the empirical model.
3.6 Endogeneity
As proposed by Boyd et al. (2017), the inclusion of methods to control possible effects of endogeneity in corporate governance research is a general movement among academicians. Accordingly, being aware of the referred concerns regarding endogeneity, several tests to control these effects were included in our research. In this framework, based on Boyd et al. (2017), the most common methods are lagged designs, two-stage least squares, and instrumental variable approaches.
Essentially, a few previous corporate governance research studies considered the use of controls for endogeneity. For example, (Harald and Marcel 2009) used the instrumental variables approach to capture the exogenous dynamics of the board structure. Moreover to perform hypotheses tests under weak instruments, (Harald and Marcel 2009) included the ‘conditional likelihood ratio’ (CLR) test. They also considered an additional test for robustness, limited-information maximum likelihood (LIML), for specifically testing boards’ competence variables.
Thus, considering the need for obtaining results on this topic, the analysis requires the following developments. First, we consider a lagged design by using board members’ data from 2011 and evaluated its impact on banks’ financial performance during the period 2012–2014. The abovementioned structural analysis considers and presupposes that it takes time to implement management decisions. Consequently, a board member appointed in 2011 will make decisions that only produce effects in the subsequent years. Moreover, considering the number of years that a board member remains in the same position, a three-year term is typical, as per existing exemptions. As a result, it is reasonable to consider a three-year period for the possible effects of board member decisions on bank performance. Furthermore, Chevalier and Ellison (1999) also considered lagged design in their research. We believe that the lagged design method protects our empirical model against potential endogeneity. Thus, it is unlikely that banks’ future performance may work as a decision criterion for the best qualified board members that could influence them to become attractive to the bank. Therefore, we think that a lagged design can protect our study against possible reverse causality effects.
We verified if the covariance between ROAA and the error term is 0, when Eduindex is used as an independent variable. Our results prove that the value is effectively 0, confirming that the Eduindex variable is exogenous. We also obtained
similar results for the variables EduindexDP and EduindexFP, confirming that these variables are exogenous. We calculated the covariance between ROAE and the error term, when Eduindex is used as an independent variable. We obtained 0 as the result, which determined that Eduindex is exogenous. We performed similar tests for EduindexDP and EduindexFP, and the results confirm that these variables are exogenous.
These results also suggest that instrumental variables estimation is not required to deal with the possible effects of endogeneity. Additionally, in most cases, board members’ education was completed a few years ago and the decision to apply to those business schools is exogenous and does not depend on banks’ performance. 3.7 Empirical methodology
To examine the possible impact of the quality of board members’ training on banks’ financial performance, we applied the following generic model (1):
ROAA or ROAE = β0 + β1Eduindex + β2EduindexDP + β3EduindexFP + β4Private + β5Publictraded + β6Banksize + β7ROAECrisis + β8ROAACrisis +
β9Risk1 + β10Tier1ratio (1) All the variables included in the model are defined in Table 2. Initially, 34 banks
were considered but due to the several limitations observed after obtaining data for some financial institutions, only 25 institutions were used for the final analysis. In the literature, Gottesman and Morey (2006) did not use a moderator effect in the relationship between fund managers’ characteristics and performance of funds. However, as stated by Chevalier and Ellison (1999), simple regressions of excess market returns on managerial characteristics is not enough. Therefore, it is very unlikely that the relationship between education and funds’ performance is strong enough to articulate the complete story.
In our research, we assume that the previous perspective is also true once it is not believable that boards’ members’ education is enough to tell the complete story of banks’ financial performance. However, we believe that statistical relevance and practical significance of board members’ education may exist. In our model, we assume that board members holding degrees in economics/business studies would have better skills and be capable of making decisions benefiting banks’ performance. As stated by Chevalier and Ellison (1999), it is possible that fund managers benefit from business school alumni networks that provide better ways to gather relevant information (especially, the most prestigious schools). This particular aspect will be analysed in our study considering the business schools referred in Eduniversal Rankings.
Our model considers a lag effect of one year between board members’ characteristics and bank performance because we believe that it takes time to see the
effect of managers’ decisions in terms of having a significant impact on the financial performance of banks. This methodology is very common in corporate governance research and was also used by Chevalier and Ellison (1999). We have also considered the possibility of including the Newey-West standard errors methodology, as in Chevalier and Ellison (1999). However, this methodology does not seem to be the best option that can be used in panel data studies, such as the case we study. Overall, Newey-West standard errors are a more appropriate methodology that can be used in time series data. In terms of changes in rankings over time, most prestigious business schools typically maintain their status. Thus, we consider that our methodology is robust in this respect.
4. Robustness Checks
We employed several robustness tests to assess the validity of our results. However, in view of space constraints, many of them are not reported in the tables. First, we consider a few tests to evaluate the normality of data, specifically the Shapiro-Wilk W-test and the Shapiro-Francia W’-test. Second, we describe how we deal with data imperfections, specifically missing data and outliers. Finally, we used quadratic effect terms to understand if they exert negative effects of Eduindex, EduindexDP, and EduindexFP on banks’ financial performance after certain levels.
4.1 Normality of data
We performed the Shapiro-Wilk W and the Shapiro-Francia W’ tests to evaluate if normality of data distribution. We apply these tests to the main variables of our model: ROAA, ROAE, Eduindex, EduindexDP, and EduindexFP. The normal distribution hypothesis was rejected for ROAA, ROAE, Eduindex, and EduindexDP, but not for EduindexFP. We also performed skewness/kurtosis tests for normality. The hypothesis for normal distribution was rejected for ROAE, EduindexDP, and EduindexFP, but not for ROAA and Eduindex.
Additionally, we regressed Eduindex, EduindexDP, and EduindexFP on ROAA, and checked if the regression errors follow a normal distribution. The results for the Shapiro-Wilk W and the Shapiro-Francia W’tests showed that the errors are not normally distributed. We regressed Eduindex, EduindexDP, and EduindexFP on ROAE and the regression errors did not follow a normal distribution. Therefore, we need to be careful when considering the statistical inference in linear regression analysis. An alternative would be to use generalized linear models or non-parametric methods, or transform variables using logs.
Our approach is to consider the transformation of variables Eduindex, EduindexDP, and EduindexFP using logs and perform regressions that use ROAA and ROAE as dependent variables. Next, we checked if the regression errors are normally distributed. We tested if the residuals of ROAA on log (Eduindex) are normally
distributed using the Shapiro-Wilk W test for normal data. We rejected the hypothesis for normal distribution.
As stated by Buthmann (2010), there are several reasons for the presence of data that are non- normally distributed. First, it can be due to extreme values, which implies the need for determining errors of measurement, data-entry, and outliers. Second, data may not be normally distributed because they result from a process that shifts frequently. We do not believe the previous condition applies to our data, as banks’ financial statements do not suffer from seasonality phenomena. Third, as emphasized by Buthmann (2010), it is essential to analyse if any variable presents many values close to zero or a natural limit. In our model, it is clear that our main independent variables Eduindex, EduindexDP, and EduindexFP have zero as a natural limit. It may be important to consider using Box-Cox power transformations or natural logs of all variables. With regard to Box-Cox power transformations, it is important to emphasize that transformations in data will increase the difficulty of interpreting results. In fact, we believe that this methodology may not be the best option for our research.
4.2 Data imperfections (outliers/missing data)
We consider the presence of values that could differ substantially from other observations, namely outliers. According to Williams (2016), extreme values can produce distorted regression coefficients. Therefore, some strategies are required to deal with outliers to avoid possible model misspecifications.
First, we consider the use of descriptive statistics for all the variables incorporated in the model. For independent variables, ROAE presents a standard deviation of 23.53, which is a considerably high value. This value can be attributed, for example, to the ROAE of Banif Bank with a value of -87.921% in 2012. We also registered an extreme value of -74.035% for Banif Investment Bank’s ROAE in 2014. It is also worth mentioning that standard deviation for the independent variable ‘ROAE Crisis’ is 12.66. This result is based on the performance analysis of Primus Bank; a value of -50% was obtained in 2009.
Second, we incorporated Cooks’ distance after performing linear regressions and searching for values higher than 1. We performed Cooks ‘distance analysis considering ROAE as an independent variable; outliers were identified in a few situations. In a particular case when Cooks’ distance was considered to have a value greater than 1, it was not possible to identify any situation, indicating that there may not be any problem with outliers. We also considered an alternative option of using Cooks’ distance for detecting possible outlier problems for cases where Di > 4/n, with ‘n’ representing number of observations. In these last criteria, we detected a few possibilities for the presence of outliers in the cases of Banif Bank, Carregosa Bank, Banif Investment Bank, and BNP Paribas Personal Finance Bank.
Besides, in this study, we used certain methods to analyse the magnitude of missing values in our dataset. We recognise that statistical programmes such as Stata automatically remove missing values from any analysis, but the results can be affected if the presence of missing values is high.
First, as suggested by (Institute for Digital Research and Education 2018) we use a Stata programme called ‘mdesc’, which counts the number of missing values and shows the percentage. The results show a value of 4.17% for the missing values of variables EduindexDP and EduindexFP representing, in this case, Banco Popular Portugal and are considered insignificant. Moreover, the variables ROAA, ROAE, and Eduindex show a percentage of missing values 0.
Second, we consider the distribution of missing values across observations introducing the function ‘rmiss2’. We detected 69 observations with no missing values and 3 observations with 2 missing values. Summarizing, we deduce that the missing data do not significantly affect the results obtained in the present study. 4.3 Quadratic effect terms
In this section, we introduce quadratic effect terms to investigate if the impact of Eduindex, EduindexDP, and EduindexFP on banks’ financial performance can have an inverted U-shaped form. If this aspect is valid for our econometric model, after considering a given level of board members’ qualifications, it may reveal that the effect will be negative for banks’ financial performance.
Therefore, using the Hausman-Taylor estimation, we regressed ROAA or ROAE on the squared versions of Eduindex, EduindexDP, and EduindexFP. We did not detect any significant effects of these regressions on these independent variables. Moreover, for squared EduindexDP, we observed that the coefficient presents a negative sign both for ROAA and ROAE. This result shows that after board members attain a certain level of qualifications, the impact on banks’ financial performance could turn negative. We believe that the referred phenomena resulted in less years of professional experience due to the time spent on educational attainments.
4.4 Relationship between management competence and banks’ financial performance
It is difficult to establish a relationship between management competence and banks’ financial performance.Structural equation modelling (SEM) with a moderator effect can establish this link. However, this type of analysis reveals serious limitations. Specifically, it is important to find a moderator variable to determine the reliability of the selected variable. We assume that even if there are many channels linking board members’ education and banks’ financial performance, the direct link between education and banks’ financial performance is not so naïve. Many relevant studies
Chevalier and Ellison (1999) and Gottesman and Morey (2006)) did not use the SEM model with a moderator effect but considered a direct link similar to the one we use.
5. Reporting Results
5.1 Summary descriptive statistics
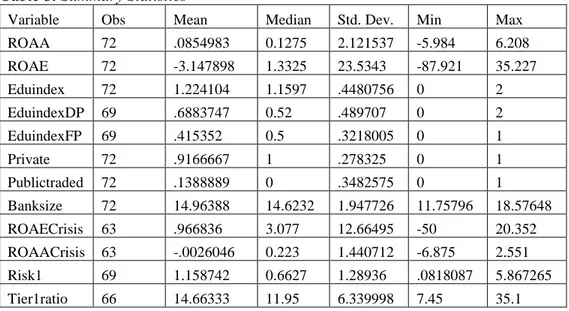
Summary statistics for all the variables are presented Table 3. The Table shows a strong standard deviation for ROAE with a value of approximately 23.53. Furthermore, the variable ‘ROAE Crisis’ also revealed a relevant standard deviation considering a value of 12.66.
Table 3. Summary Statistics
Variable Obs Mean Median Std. Dev. Min Max
ROAA 72 .0854983 0.1275 2.121537 -5.984 6.208 ROAE 72 -3.147898 1.3325 23.5343 -87.921 35.227 Eduindex 72 1.224104 1.1597 .4480756 0 2 EduindexDP 69 .6883747 0.52 .489707 0 2 EduindexFP 69 .415352 0.5 .3218005 0 1 Private 72 .9166667 1 .278325 0 1 Publictraded 72 .1388889 0 .3482575 0 1 Banksize 72 14.96388 14.6232 1.947726 11.75796 18.57648 ROAECrisis 63 .966836 3.077 12.66495 -50 20.352 ROAACrisis 63 -.0026046 0.223 1.440712 -6.875 2.551 Risk1 69 1.158742 0.6627 1.28936 .0818087 5.867265 Tier1ratio 66 14.66333 11.95 6.339998 7.45 35.1
Table 4 presents the Pearson correlation coefficients between independent variables and control variables. Therefore, considering the correlation coefficients in Table 4, we do not identify any case that indicates the presence of a serious problem of multicollinearity because the pairwise correlations are below the threshold value of 0.8. as stated in Fernandes et al. (2017b). However, we need to be careful with the correlation between the variables Eduindex and EduindexDP with a value of 0.6117 and the correlation between the variables ROAACrisis and ROAECrisis with a value of 0.7282, as both are close to the threshold value of 0.8.
Table 4. Correlation Matrix
We also need to be careful while using Pearson correlation coefficients among explanatory variables because these correlations should be used when the variables follow a normal distribution. In fact, Clark (2013) emphasized the idea that Pearson correlation is more adequate for variables that are continuous, normally distributed, and do not have extreme values. In the present study, we find that only one variable, ‘EduindexFP’, assumes a normal distribution using the Shapiro-Wilk normality test. Therefore, it may not be appropriate to use the Pearson’s correlation because the Spearman’s rank correlation method is a viable alternative.
For variables Banksize, ROAECrisis, ROAACrisis, Risk1, and Tier1ratio, we use the Spearman’s correlation. We analysed to check if a monotonic relationship exists or not in all these cases. None of the variables present a monotonic relationship with the others, indicating that we need to apply another correlation, such as the Hoeffding’s D measure. However, the latter measure is far from being completely rigorous and we could not implement it in Stata. The alternative would be to use the measure devised by Blum et al. (1961); however, once again it is very difficult to implement it in Stata and, to the best of our knowledge, no author could easily work it out this way.
5.2 Empirical results
Our first objective is to show the possible effects of managers’ characteristics in terms of banks’ financial performance. We use an ordinary least squares (OLS) regression approach with several control variables, as reported in Table 5. We can see that a significant and positive effect of the variables Eduindex, EduindexDP, and EduindexFP exists for banks’ ROAA. This effect is higher for EduindexFP with a value of 2.986. It is also suggested that banks’ ROAE is significantly influenced by Eduindex, EduindexDP, and EduindexFP. Again, the assumed influence is more remarkable for EduindexFP. However, the results do not consider possible effects of
Eduindex EduindexDP EduindexFP Private Publictraded Banksize ROAECrisis ROAACrisis Risk1 Tier1ratio
Eduindex 1.0000 EduindexDP 0.6117 1.0000 EduindexFP 0.3906 0.3936 1.0000 Private -0.3080 -0.2356 -0.0818 1.0000 Public traded -0.1691 -0.1470 -0.0604 0.1211 1.0000 Banksize -0.0991 0.1056 0.2174 -0.2470 0.5619 1.0000 ROAECrisis 0.1745 0.4558 0.0239 -0.1517 1.0000 -0.0361 0.1802 ROAACrisis 0.0484 0.4104 0.0282 -0.1890 0.0386 0.2312 0.7282 1.0000 Risk 1 0.2309 0.1308 -0.4552 0.1074 -0.1371 -0.4288 -0.0246 0.0297 1.0000 Tier1 ratio 0.2474 -0.1230 -0.1145 0.1095 -0.1628 -0.4210 0.0755 -0.2007 0.0199 1.0000
endogeneity and other statistical aspects. It is of particular concern that the adjusted R-squared value obtained in each regression is significantly high and not commonly observed in corporate governance studies.
Table 5. OLS Performance Regressions with Control Variables
ROAA ROAA ROAA ROAE ROAE ROAE
Interce pt 1.87189 2 3.26516 3 1.56321 2 50.541 39 74.1578 7* 52.8675 1 (0.58) (1.05) (0.62) (1.27) (1.84) (1.62) Eduind ex 1.13127 6** 15.426 84** (2.19) (2.43) Eduind exDP 1.21270 1*** 10.7874 4** (2.98) (2.04) Eduind exFP 2.98635 9*** 34.7411 7*** (6.24) (5.56) Private -0,02285 75 -0.35492 83 -0.60897 02 -5.2721 95 -11.5050 8 -14.0146 5 (-0,03) (-0.44) (-0.94) (-0.51) (-1.09) (-1.65) Publictr aded -0,00013 21 0.19947 41 0.37779 21 5.4660 21 7.68519 5 10.5994 9 (-0,00) (0.30) (0.71) (0.69) (0.89) (1.53) Banksi ze -0.27556 04 -0.32983 39** -0.28694 41** -4.6890 28** -5,41178 4** -5.00256 7*** (-1.73) (-2.08) (-2.27) (0.02) (-2,63) (-3.02) ROAE Crisis -0,05779 23** -0.06263 68*** -0.04711 04*** -0.4357 882 -0.42813 98 -0.28987 75 (-2.65) (-2.90) (-2.8) (-1.63) (-1.52) (-1.32) ROAA Crisis 1.08739 6*** 0.98107 49*** 1.00830 1*** 8.6312 48*** 7.44492 9*** 7.61893 *** (5.66) (5.19) (6.68) (3.66) (3.03) (3.86) Risk 1 -1,35832 8*** -1.24798 6*** -0.85542 37*** -16.800 8*** -14.7913 4*** -10.4375 9*** (-5.94) (-5.92) (-4.89) (-5.98) (-5.39) (-4.56) Tier1 ratio 0.16174 74*** 0.17634 87*** 0.19709 82*** 1.2965 72*** 1.48319 9*** 1.74517 4*** (4.81) (5.29) (7.30) (3.14) (3.42) (4.95)
Obs. 57 54 54 57 54 54
Adj-R2 0.6059 0.6353 0.7660 0.5077 0.4896 0.6693 The regression controls are bank size, measured by the natural logarithm of total assets, Tier 1 ratio. The table reports the regression coefficients, t-statistics (in parentheses),
number of observations (N), and adjusted R2. * Statistical significance at 10% level. ** Statistical significance at 5% level *** Statistical significance at 1% level
Second, we incorporate a new methodology that considers heteroskedastic linear regressions (Table 6). Considering the effects of Eduindex, EduindexDP, and EduindexFP on banks’ ROAA, a positive and significant effect is confirmed as evidenced in the methodology that uses OLS regressions with control variables. Furthermore, for the effects of Eduindex, EduindexDP, and EduindexFP on banks’ ROAE, the effect is positive and significant for the second and third referred variables. However, Eduindex does not have a significant impact on banks’ ROAE, which is contradictory to the resultobtained in Table 5.
Table 6. Heteroskedastic Linear Regression
ROAA# ROAA ROAA#
ROAE # ROAE# ROAE# Interce pt 9.25415 ** 9.36389 5*** 11.0165 9*** -62.505 37 -45.7124 8*** 18.9856 7 (2.21) (3.89) (2.94) (-0.65) (-3.12) (0.64) Eduind ex 2.16799 2** 19.940 36 (2.22) (0.84) Eduind exDP 1.20636 9*** 13.7621 9*** (5.98) (5.14) Eduind exFP 3.43723 5*** 32.0738 8*** (7.41) (8.41) Private -1.52335 -1.91625 1*** -2.02694 1*** 21.795 68*** 15.7144 3*** -10.9801 4***
(-1.61) (-3.32) (-4.09) (2.69) (5.24) (-3.27) Publict raded 1.50362 2 1.18842 5** 1.61877 6*** -23.073 3*** -22.0405 1** 7.84317 4 (1.40) (2.20) (4.30) (-3.51) (-2.08) (1.12) Banksi ze -0.65979 26*** -0.61150 56*** -0.65965 55*** 1.5218 09 1.15578 7** -2.94507 5** (-3.43) (-6.17) (-3.96) (0.54) (2.14) (-2.24) ROAE Crisis -0.03792 39* -0.05101 99*** 0.00406 02 -0.7070 614 -0.53023 57*** -0.35936 05 (-1.66) (-2.60) (0.13) (-1.34) (-3.33) (-1.37) ROAA Crisis 0.91613 47* 0.84319 27** 0.37689 28** 10.890 03* 5.07571 6*** 7.6305* ** (1.83) (2.18) (2.32) (1.85) (4.76) (5.69) Risk 1 -2.24263 -1.56473 2** -1.38116 9*** -10.558 4 -5.22543 9** -9.74463 *** (-1.37) (-2.32) (-2.78) (-1.17) (-2.06) (-5.31) Tier 1 ratio 0.09861 9 0.16325 55*** 0.01276 14 0.6563 149 1.08083 5** 1.83535 2*** (1.52) (3.20) (0.24) (0.43) (2.57) (3.55) Obs. 57 54 54 57 54 54 Wald chi2(8) 68.47 246.6 237.71 233.29 527.84 925.4 Prob > chi2 0.0000 0.0000 0.0000 0.0000 0.0000 0.0000 The regression controls are bank size measured by the natural logarithm of total assets, Tier 1 ratio. The table reports the regression coefficients, z-statistics (in parentheses),
number of observations (N). * Statistical significance at 10% level. ** Statistical significance at 5% level *** Statistical significance at 1% level
# In this case, the likelihood-ratio test reported at the bottom of the table shows us that our model of variance fits the data better than a model where the variance is constant. Third, our empirical analysis includes a linear regression with panel-corrected standard errors (PCSE), which can be referred to as an alternative feasible
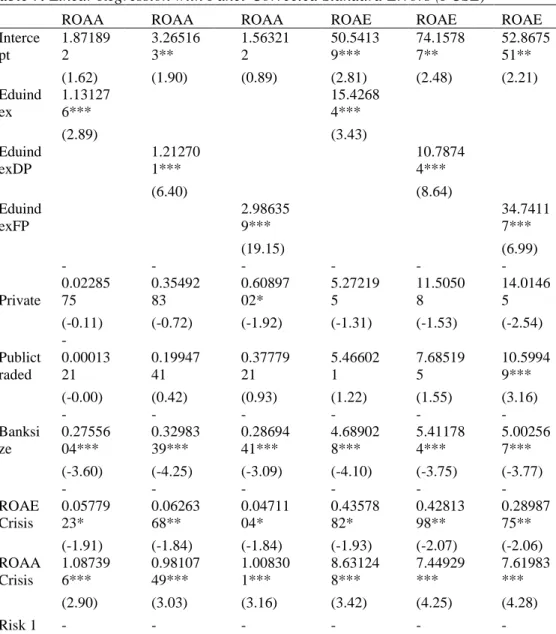
generalized least squares (FGLS) method to deal with disturbances that are not assumed to be independent and identically distributed. This methodology can be particularly interesting when considering that our variables are not normally distributed. First, we detect a significant effect of Eduindex, EduindexDP, and EduindexFP on banks’ ROAA, and this confirms our previous results. A positive and significant effect of Eduindex, EduindexDP, and EduindexFP is also identified for banks’ ROAE, but it is emphasized that the magnitude of influence is much higher for EduindexFP. Again, we are aware that the R-squared in the various regressions presents values that are not common in corporate governance research. This final aspect implies that we need to be careful while interpreting the results. Table 7. Linear Regression with Panel-Corrected Standard Errors (PCSE)
ROAA ROAA ROAA ROAE ROAE ROAE
Interce pt 1.87189 2 3.26516 3** 1.56321 2 50.5413 9*** 74.1578 7** 52.8675 51** (1.62) (1.90) (0.89) (2.81) (2.48) (2.21) Eduind ex 1.13127 6*** 15.4268 4*** (2.89) (3.43) Eduind exDP 1.21270 1*** 10.7874 4*** (6.40) (8.64) Eduind exFP 2.98635 9*** 34.7411 7*** (19.15) (6.99) Private -0.02285 75 -0.35492 83 -0.60897 02* -5.27219 5 -11.5050 8 -14.0146 5 (-0.11) (-0.72) (-1.92) (-1.31) (-1.53) (-2.54) Publict raded -0.00013 21 0.19947 41 0.37779 21 5.46602 1 7.68519 5 10.5994 9*** (-0.00) (0.42) (0.93) (1.22) (1.55) (3.16) Banksi ze -0.27556 04*** -0.32983 39*** -0.28694 41*** -4.68902 8*** -5.41178 4*** -5.00256 7*** (-3.60) (-4.25) (-3.09) (-4.10) (-3.75) (-3.77) ROAE Crisis -0.05779 23* -0.06263 68** -0.04711 04* -0.43578 82* -0.42813 98** -0.28987 75** (-1.91) (-1.84) (-1.84) (-1.93) (-2.07) (-2.06) ROAA Crisis 1.08739 6*** 0.98107 49*** 1.00830 1*** 8.63124 8*** 7.44929 *** 7.61983 *** (2.90) (3.03) (3.16) (3.42) (4.25) (4.28) Risk 1 - - -
-1.35832 8*** 1.24798 6*** 0.85542 37*** 16.8008 *** 14.7913 4*** 10.4375 9*** (-12.30) (-9.75) (-8.31) (-7.90) (-23.00) (-19.39) Tier 1 ratio 0.16174 74*** 0.17634 87*** 0.19709 82*** 1.29657 2*** 1.48319 9*** 1.74517 4*** (4.86) (5.95) (6.45) (7.16) (9.73) (12.09) Obs. 57 54 54 57 54 54 R-squared 0.6622 0.6904 0.8013 0.578 0.5666 0.7193 The regression controls are bank size measured by the natural logarithm of total assets, Tier 1 ratio. The table reports the regression coefficients, z-statistics (in parentheses),
number of observations (N). * Statistical significance at 10% level. ** Statistical significance at 5% level *** Statistical significance at 1% level
Fourth, our empirical analysis uses a random-effects model (Table 8) that is widely used in corporate governance research. This methodology is useful to control variables that cannot be observed, as in the case of cultural factors or differences in business practices across banks. As stated by Torres-Reyna (2017), fixed effects will not work well with slow-changing variables over time, as it is the case of our study. Using the Hausman test to decide if we should use fixed effects or random effects seems redundant because it is not expected that fixed effects are appropriate to our econometric model. Therefore, as mentioned by Black et al. (2016), fixed effects should not be used to study governance aspects with little time variation, for example, ownership structure. In this context, board members’ education can be considered as having little time variation.
Furthermore, as Torres-Reyna (2017) states, it is important to decide if it is necessary to use a random effects regression or a simple OLS regression. Therefore, we use the Breusch-Pagan Lagrange multiplier (LM) to define the previous situation. Moreover, as emphasized by Torres-Reyna (2017) in a research study that involves consideration of macro panels with long time series of over 20 years, cross-sectional dependence could be a concern and it is useful to perform the Breusch-Pagan LM test of independence. However, since we are using a micro panel (few years) in our research, applying macro panels with long time series is not appropriate.
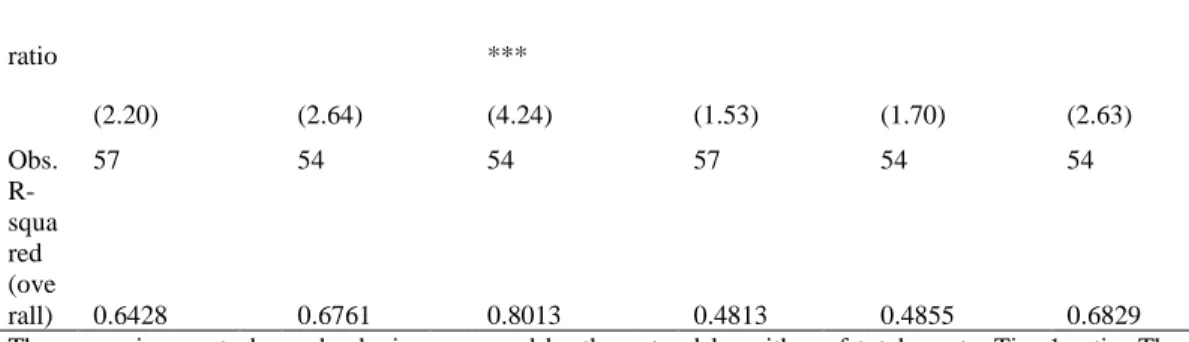
Our analysis revealed a positive and significant effect of variables Eduindex, EduindexDP, and EduindexFP for banks’ ROAA and ROAE. Besides, when
applying the Breusch-Pagan LM test, we confirmed that the random effects model is a better option than OLS regressions. Likewise, the impact of EduindexFP on banks’ ROAA and ROAE is greater than Eduindex and EduindexDP.
Table 8. Random Effects Regression (Breusch and Pagan Lagrangian Multiplier Test)
ROAA# ROAA# ROAA# ROAE# ROAE# ROAE#
Inter cept 3.293498 4.359035 1.565589 102.3855 * 123.3024 ** 84.24177 * (0.82) (1.14) (0.52) (1.86) (2.21) (1.91) Edui ndex 0.9716451* 13.25648 ** (1.89) (2.03) Edui ndex DP 1.179997* ** 12.73032 ** (3.54) (2.51) Edui ndex FP 2.986677** * 35.24267 *** (8.73) (3.36) Priv ate -0.0506362 -0.2185689 -0.6079526 -8.580795 -12.0116 -15.12276 (-0.06) (-0.21) (-0.98) (-0.55) (-0.69) (-1.20) Publ ictra ded 0.6120304 0.6990258 0.3799867 24.60319 *** 26.30287 *** 21.88163 *** (1.35) (1.43) (0.75) (4.18) (4.71) (3.30) Ban ksiz e -0.3461887* -0.3930716 ** -0.2871149* * -7.46697* ** -8.264426 *** -6.730169 *** (-1.79) (-2.24) (-2.05) (-2.60) (-2.82) (-2.84) RO AE Crisi s -0.0331977* -0.0384678 ** -0.0470034* ** -0.222067 5 -0.235805 8 -0.249715 4 (-2.01) (-2.55) (-3.08) (-0.92) (-0.96) (-1.09) RO AA Crisi s 0.796396** * 0.769847* ** 1.006919** * 4.886026 *** 4.565355 *** 5.947768 *** (4.02) (4.49) (6.70) (3.80) (3.71) (4.91) Risk 1 -1.290461** * -1.23859** * -0.8550251* ** -17.02294 *** -16.16475 *** -11.0853* ** (-4.85) (-5.60) (-6.54) (-5.82) (-6.24) (-6.03) Tier 1 0.1391857* * 0.1502743 *** -0.85500251 0.788364 3 0.838989 3* 1.333388 ***
ratio *** (2.20) (2.64) (4.24) (1.53) (1.70) (2.63) Obs. 57 54 54 57 54 54 R-squa red (ove rall) 0.6428 0.6761 0.8013 0.4813 0.4855 0.6829 The regression controls are bank size measured by the natural logarithm of total assets, Tier 1 ratio. The table reports the regression coefficients, z-statistics (in parentheses),
number of observations (N). * Statistical significance at 10% level. ** Statistical significance at 5% level *** Statistical significance at 1% level
#In this case, the random effects model is better than OLS
Fifth, considering that variables are not normally distributed, nonparametric regression can be considered as it has the advantage of not being subject to misspecification errors. Therefore, based on the Stata (2018) outcomes, we do not specify the functional form in the nonparametric regression. We are also aware that nonparametric regressions require a greater number of observations than linear regressions to generate more rigorous estimates. We performed nonparametric regressions using dependent variables (ROAE and ROAA) and independent variables individually (Eduindex, EduindexDP, and EduindexFP). However, when control variables were included in the nonparametric regression, we could not compute a bootstrap due to insufficient observations. The results for nonparametric regression are reported in Table 9. The estimates suggest that EduindexFP affects banks’ ROAA and ROAE significantly and positively. The interpretation of these results has a set of limitations and should be cautiously considered.
Table 9. Nonparametric Regression
ROAA ROAA ROAA ROAE
ROA E ROAE Intercept -0.0168 11 0.25798 08 0.142359 -3.3667 03 -1.587 89 -3.222266 (-0.07) (0.91) (0.61) (-1.46) (-0.66) (-1.12) Eduinde x 0.6418 138 5.8654 94
(0.94) (0.75) Eduinde xDP -0.24727 47 2.583 264 (-0.33) (0.41) Eduinde xFP 2.445652 *** 30.23434 *** (2.92) (3.41) Obs. 69 69 69 69 69 69 R-squared 0.0072 0.1270 0.1687 0.0216 0.137 2 0.1638 The regression controls are bank size measured by the natural logarithm of total assets, Tier 1 ratio. The table reports the regression coefficients, z-statistics (in parentheses),
number of observations (N) and adjusted R2. * Statistical significance at 10% level. ** Statistical significance at 5% level *** Statistical significance at 1% level
Sixth, our analysis considered the inclusion of a Hausman-Taylor regression. This regression fits a random-effects model for panel data considering that part of the covariates correlates with the unobserved individual-level random effects. The Hausman-Taylor regression results are reported in Table 10. The results reveal that EduindexFP affects banks’ ROAA positively and significantly, but does not affect ROAE.
Table 10. Hausman-Taylor Regression
ROAA ROAA ROAA ROAE ROAE ROAE
Interce pt 6.14694 7.10437 8 4.62721 7 125.905 8** 157.924 3** 119.082 5** (0.86) (1.17) (0.81) (1.97) (2.49) (1.82) Eduind ex 1.78485 37.1526 9 (1.15) (1.61) Eduind exDP 1.52328 8 32.0297 8 (1.43) (1.61) Eduind exFP 4.97638 5* 80.1778 7