UNIVERSIDADE DO ALGARVE
Characterization of bone pathologies in the
ins2
+/akitamouse, a new model for diabetes
insulin-dependent: contribution for a better understanding of the
disease in humans
Filipe Ricardo Pires de Carvalho
Tese para a obtenção do grau de Doutor em Ciências Biomédicas
Trabalho efetuado sob a orientação de:
Professora Doutora Leonor Cancela Doutor Paulo J. Gavaia
Characterization of bone pathologies in the
ins2
+/akitamouse, a new model for diabetes
insulin-dependent: contribution for a better understanding of the
disease in humans
Declaração de Autoria do trabalho
Declaro ser o autor deste trabalho, que é original e inédito. Os trabalhos consultados encontram-se citados no texto e estão devidamente anotados na listagem de referências.
Copyright Filipe Ricardo Pires de Carvalho. A Universidade do Algarve tem o direito, perpétuo e sem limites geográficos, de arquivar e publicitar este trabalho através de exemplares impressos reproduzidos em papel ou de forma digital, ou por qualquer outro meio conhecido ou que venha a ser inventado, de o divulgar através de repositórios científicos e de admitir a sua cópia e distribuição com objetivos educacionais ou de investigação, não comerciais, desde que seja dado crédito ao autor e editor.
Para a Ana, Violeta e João
AGRADECIMENTOS
A conclusão deste trabalho só foi possível graças a várias pessoas e ao qual eu queria agradecer do fundo do meu coração.
Em primeiro lugar queria agradecer à Professora Leonor Cancela pelos conhecimentos, apoio e compreensão ao longo destes anos e em particular pela oportunidade que me deu de realizar este trabalho.
Ao Doutor Paulo Gavaia pelo incansável apoio, por tudo o que me ensinou e em especial por ter sempre acreditado em mim. Sem tudo isto a conclusão deste trabalho não tinha sido possível, muito obrigado amigo!
Ao Márcio, meu colega de bancada e amigo, pela ajuda indispensável na minha integração no laboratório e pela partilha de conhecimentos sobre ciência e sobre tudo o resto. Desejo-te as melhores felicidades!
Aos amigos Mike, Marcelo, António e Gil pelas gargalhadas e apoio nos maus momentos.
À Andreia, Cátia, Iris, Joana, Vânia, Cindy, João e Helena pelo apoio, amizade e solidariedade que sempre tiveram comigo dentro e fora do laboratório.
A todos os meus amigos por tudo de bom que me deram e que trago sempre comigo. À minha mãe e irmão por sempre terem estado lá para mim.
À Ana por acreditar sempre em mim e nos meus sonhos, por ser o sol que me aquece e à Violeta e João por serem os raios que me iluminam.
ABSTRACT
In the past 30 years developed and developing countries faced significant lifestyle changes that made the incidence of diabetes mellitus to reach pandemic proportion worldwide. This increase, seen in both types of the disease, made diabetes mellitus one of the leading causes of morbidity and mortality of our times. Bone is one t of several organs that are affected by diabetes mellitus, being morbidity caused by bone fractures highly correlated to diabetic bone. Alterations in the constituents of bone, microarchitecture changes and bone loss have been pointed as the main reasons for its fragility. This work aimed to contribute to identify the molecular players or the functional changes affecting bone and caused by diabetes mellitus. In chapter 2, using as animal model of type 1 diabetes mellitus the Ins2+/akita mouse, we identified bone growth retardation related to growth plate impairment. These changes were associated to reduced expression of Igf1 and increased expression of cartilage degradation enzymes like Adams-5. We also identified severe microarchitecture changes caused by reduced bone formation and resorption that could be explained by leptin deficiency and/or decreased insulin signaling. In chapter 3, we concluded that paricalcitol (vitamin D analog) and cinacalcet (calcimimetic), two drugs used for the treatment of secondary hyperthyroidism, have beneficial effects in fin regeneration and mineralization in a zebrafish model of diabetes. These results could be explained by the downregulation of pthr suggesting reduced signaling of parathyroid hormone, that is a potent activator of bone remodeling, and increased expression of runx2, indicating increased osteoblast differentiation. Increased expression of the two zebrafish insulin genes, insa and insb, could be observed, suggesting that both drugs promote an increase in insulin signaling. In chapter 4, we suggest that in humans, the insulin
this expression results mainly from expression of the ancestral gene while in mice and zebrafish it is due to expression of the insulin paralogues.
RESUMO
Alterações significativas no estilo de vida nos países desenvolvidos e em desenvolvimento, durante as ultimas décadas, fizeram com que a incidência da diabetes mellitus tenha tomado proporções semelhantes às de uma pandemia. Este aumento, observado em ambos os tipos da doença, fez com que diabetes mellitus se tenha tornado uma das principais causas de morbidade e mortalidade dos nossos tempos. O osso está entre os vários órgãos que são afetados pela diabetes mellitus, estando a morbidade causada por fraturas ósseas, altamente correlacionada com esta doença. Perda óssea, alterações nos constituintes e na microarquitetura do osso, têm sido apontadas como os principais causas para a fragilidade óssea destes pacientes. Neste trabalho propusemo-nos identificar intervenientes moleculares que estão envolvidos nas alterações ósseas despoletadas pela diabetes mellitus. No capítulo 2, usando como modelo animal de diabetes mellitus tipo 1 o ratinho Ins2+ /akita, procurámos
identificar alterações histomorfométricas na estrutura do osso e cartilagem e identificar genes com a expressão alterada através de PCR em tempo real quantitativo. Pudemos observar diminuição no crescimento ósseo causado por uma redução no número de condrócitos proliferativos e aumento no número de condrócitos hipertróficos na placa de crescimento. Estas alterações foram acompanhadas por uma redução na expressão de fatores de crescimento como a Igf1 e aumento da expressão de enzimas responsáveis pela degradação da cartilagem como Adams-5. Igualmente, pudemos observar alterações profundas na microarquitetura do osso do ratinho Ins2 +/akita, que sugerem reduzida formação e reabsorção óssea. O facto de a diabetes mellitus tipo 1 estar associada a um estado de hipoleptinémia e hipoinsulinémia faz com que ambas as hormonas, leptina e insulina, sejam as principais
regeneração e mineralização óssea na diabetes mellitus tipo 1. Foi possível concluir que os medicamentos paricalcitol (análogo da vitamina D) e cinacalcet (calcimimético), usados para o tratamento do hipertiroidismo secundário, têm efeitos benéficos na regeneração e mineralização da barbatana caudal num modelo de diabetes mellitus tipo 1 de peixe-zebra. Estes resultados poderão ser explicados pela diminuição da expressão da pthr, que sugere uma redução da hormona paratiróide circulante, que é um activador da remodelação óssea, e um aumento da expressão de runx2, que sugere maior diferenciação dos osteoblastos, assim como um aumento da expressão de ambos os genes insa e insb da insulina no osso, sugerindo que estes medicamentos poderão por um lado aumentar a expressão extrapancreática no osso e por outro a expressão pancreática, aumentando assim a sua sinalização nas células alvo. No capítulo 4 concluímos que nos humanos, o gene parálogo da insulina, o INS-IGF2, não tem uma função redundante em contaste com o que foi observado nos ratinhos e, provavelmente, no peixe-zebra. Foi também possível concluir que a expressão extrapancreática da insulina ocorre em humanos, ratinho e peixe-zebra e que nos humanos este fenómeno é devido principalmente à expressão do gene ancestral, enquanto no ratinho e no peixe-zebra parece ser devido à expressão dos parálogos respectivos.
TABLE OF CONTENTS
AGRADECIMENTOS ... ix
ABSTRACT ... xi
RESUMO ... xiii
TABLE OF CONTENTS ... xv
TABLE OF FIGURES ... xviii
ABBREVIATION LIST...1
CHAPTER 1. GENERAL INTRODUCTION ...3
1.1. Type 1 Diabetes Mellitus ...5
1.1.1. Prevalence ...5 1.1.2. Causes ...6 1.1.3. Pathophysiology ...7 1.2. Bone ...9 1.2.1. Formation ...9 1.2.2. Remodeling ... 11
1.3. Bone Health in Type 1 Diabetes Mellitus... 12
1.3.1. T1DM and bone loss ... 12
1.3.2. Insulin signaling and IGF1 ... 12
1.3.3. Advanced glycation end products (AGEs)... 14
1.3.3.1. Inflammation ... 14
1.3.4. Bone marrow adiposity ... 15
1.3.5 Leptin and T1DM ... 16
1.4. T1DM animal models used in our study ... 18
1.4.1. Ins2+/akita mouse ... 18
1.4.2. Transgenic zebrafish Tg(ins:Eco.NfsB-mCherry)... 20
2.2. Introduction ... 26
2.3. Materials and Methods ... 28
2.3.1. Mouse models ... 28
2.3.2. Total RNA isolation ... 29
2.3.3. Quantitative real-time polymerase chain reaction (qRT-PCR) ... 29
2.3.4. Bone histology and histomorphometry ... 29
2.3.5. Growth plate measurements ... 30
2.3.6. Immunohistochemistry ... 30
2.3.7. Detection of apoptosis... 30
2.3.8. Micro-computed Tomography (CT) analysis ... 31
2.3.9. Statistical analysis ... 31
2.4. Results... 31
2.4.1. T1DM reduces femur length and body weight in Ins2+/akita ... 31
2.4.2. Growth plate thickness is reduced in Ins2+/akita ... 32
2.4.3. Ins2+/akita have reduced cortical area and higher trabecular bone volume at 4, 6 at 12 months... 34
2.4.3. Expression of cartilage and bone marker genes is altered in Ins2+/akita ... 37
2.1.5. Discussion ... 39
2.6. Acknowledgments ... 43
CHAPTER 3. IMPROVED REGENERATION AND DE NOVO BONE FORMATION IN A DIABETES ZEBRAFISH MODEL TREATED WITH PARICALCITOL AND CINACALCET ... 47
3.1. Abstract ... 47
3.2. Introduction ... 48
3.3. Methods ... 50
3.3.1. Zebrafish strains and maintenance... 50
3.3.2. Procedures ... 50
3.4. Results... 52
3.5. Discussion ... 58
CHAPTER 4. CAN EXTRAPANCREATIC EXPRESSION OF INSULIN AND
PARALOGS REGULATE GLUCOSE HOMEOSTASIS? ... 65
4.1. Abstract ... 65
4.2. Introduction ... 66
4.3. Methods ... 68
4.3.1. Phylogenetic tree construction ... 68
4.3.2. Graphical representation of conserved motifs ... 69
4.3.3. Transcripts and gene expression ... 69
4.4. Results... 70
4.5. Discussion ... 78
CHAPTER 5. GENERAL CONCLUSIONS AND FUTURE PERSPECTIVES ... 83
GENERAL REFERENCES ... 87
TABLE OF FIGURES
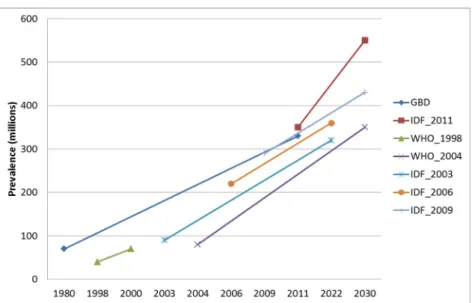
Figure 1. .Estimates and projections of global diabetes prevalence.. ...5
Figure 2. T1DM leads to hyperglycemia and ketoacidosis. ...8
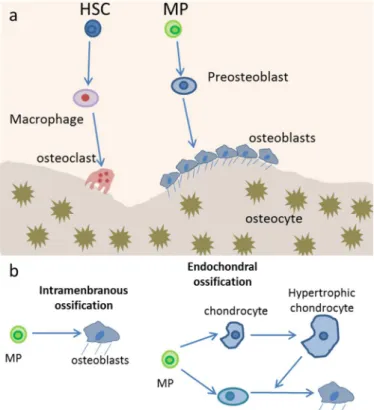
Figure 3. Bone homeostasis is accomplished by osteoclasts and osteoblasts...9
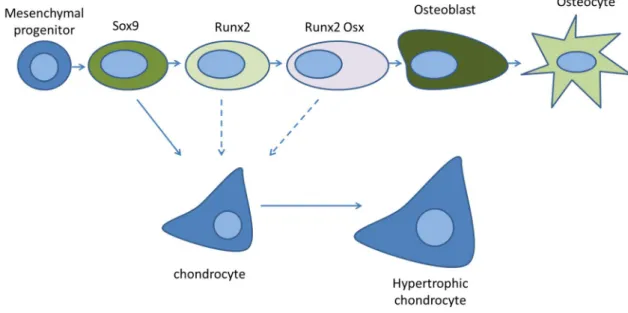
Figure 4. The different stages of osteoblast lineage cell differentiation.. ... 10
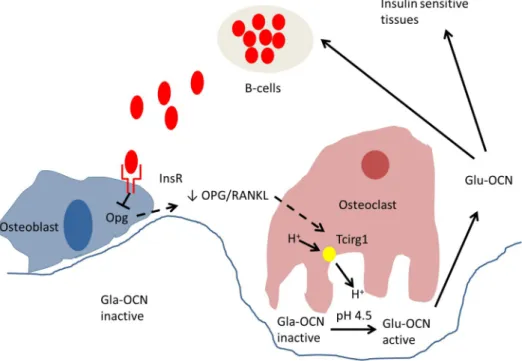
Figure 5. Model of action of insulin in bone resorption and osteocalcin regulation of insulin expression.. ... 13
Figure 6. Principal causes for accumulation of AGEs in bone. ... 14
Figure 7. Models proposed for action of leptin on bone.. ... 17
Figure 8. Diabetes of the Ins2+/akita mouse is caused by a single locus mutation ... 18
Figure 9. Pathway of preproinsulin to insulin in WT and Ins2+/akita mice... 19
Figure 10. Transgenic zebrafish Tg(ins:Eco.NfsB-mCherry) is a suitable model to study DM ... 21
Figure 11. X-ray analysis of Ins2+/akita and WT mice femurs at 4, 6 and 12 months. .. 32
Figure 12. A) Growth plate thickness of Ins2+/akita mice and WT... 33
Figure 13. A) Evaluation of pre-apoptotic cells by Immunohistochemistry. ... 34
Figure 14. A) Histological sections of the cortical proximal diaphyseal, mid and distal diaphyseal shaft of the tibia and microCT images ... 35
Figure 15. A) Histological sections of the proximal mid-epiphysis of the tibia and MicroCT images ... 37
Figure 16. Diabetes in Ins2+/akita induced changes in mRNA gene expression in cartilage and bone ... 39
Figure 19. Treatment with paricalcitol and cinacalcet induced fin regeneration and
bone mineralization in adult diabetic zebrafish. ... 55
Figure 20. RNA gene expression from the vertebral column of diabetic or diabetic
with treatments is altered in zebrafish ... 57
Figure 21. Zebrafish can have extrapancreatic expression of insulin ... 58 Figure 22. Phylogenetic tree of insulin. ... 72 Figure 23. Transcripts for INS and INS-IGF2 in Human, ins2 and ins1 in mouse, insa
and insb in zebrafish. ... 74
Figure 24. Mouse and zebrafish insulin paralogs are highly similar ... 75 Figure 25. Available gene expression per tissue of insulin and paralogs. ... 77
ABBREVIATION LIST
DM diabetes mellitus
INS Insulin
Igf1 Insulin growth factor 1
INS-IGF2-insulin-insulin growth factor 2 pthr parathyroid hormone receptor runx2 runt-related transcription factor 2 insa insulin a
insb insulin b
T1DM Type 1 diabetes mellitus T2DM Type 2 diabetes mellitus HPA hypothalamic pituitary adrenal ACTH adrenocorticotropic hormone MP mesenchymal progenitors cells HSCs haematopoietic stem cells BMD bone mineral density
Gla-OCN carboxylated osteocalcin Glu-OCN undercarboxylated osteocalcin Opg osteoprotegerin
GF1 Insulin growth factor 1 GH Growth hormone
AGEs advanced glycation end products FFA free fatty acids s
OSX osterix
RANKL receptor activator of nuclear factor (NF)-kB (RANK) by RANK ligand
AGEs Advanced glycation end products KO knockout
BV/TV Bone volume/Total volume
Adrb2 β2-adrenergic receptor
qRT-PCR Quantitative real-time polymerase chain reaction VitD Calcitriol; 1,25-dihydroxyvitamin D3 –
MET Metranidazole STZ Streptozotocin
CHAPTER 1.
GENERAL INTRODUCTION
CHAPTER 1. GENERAL INTRODUCTION
1.1. Type 1 Diabetes Mellitus
1.1.1. PrevalenceDiabetes mellitus (DM) is the most rapidly growing chronic disease of our time. In developed and developing countries is predicted to occur a decrease in life expectancy for the first time in 200 years because of DM [1]. In 2011 there were 366 million people with DM and expected to rise to 552 million by 2030 [2] with a estimation of being the 7th leading cause of death in 2030 [3]. Population growth, aging, urbanization, and growing prevalence of obesity and physical inactivity are between the principal causes. Originally expected to occur in type 2 diabetes mellitus (T2DM), the increase in childhood diabetes has been of both type 1 and 2 DM [4]
Figure 1. .Estimates and projections of global diabetes prevalence. All projections from different studies
suggest growing prevalence of diabetes over the next decades. GBD, Global Burden Diabetes, IDF, International Diabetes Federation, WHO, World Health Organization. Adapted from Whiting et al., 2011.
Type 1 diabetes mellitus (T1DM) accounts for 10% of all DM cases [2] with an increasing incidence of 2-5% a year [5]. Although the reasons for this increase are still unknown, genetic susceptibility together with environmental factors suggest that a multifactorial process might be involved [6]. Children with T1DM have in 90–95% of incidences a susceptibility in the human leukocyte antigen complex in chromosome 6 [7], but only 5% of the individuals that carry this susceptibility actually develop the disease [8] supporting the idea that other factors are needed to trigger T1DM.
1.1.2. Causes
T1DM is divided in two sub-groups, the most common is type 1a that is linked to an autoimmune-mediated destruction of beta cells, while in type 1b are included rare forms of the disease associated to genetic defects in beta-cell function, with a sub-classification according to the gene involved.
Type 1a of DM is characterized by a disorder of glucose homeostasis by susceptibility to ketoacidosis. Besides the genetically heterogeneous autoimmune predispositions, environmental triggering hypothesis have been made like hygiene, viral infections, vitamin D deficiency, breast milk and cow's milk [6]. At the present time, the hygiene hypothesis seems to be the best candidate to explain onset of the disease. Strachan [9] proposed that exposure to a variety of infectious agents during early childhood might be protective. Beside this, authors suggest that the reason for the increase in the incidence of the disease probably is multifactorial [6].
Type 1a DM results in a dysregulation to self-tolerance proteins. During thymus development, T-cells that do not express highly self-reactive T cell receptors mature and leave the thymus while highly autoreactive T cells are deleted in healthy individuals. But in T1DM these highly autoreactive T cells are not eliminated and escape to the periphery participating in the pathological immune response to self-antigens.
Type 1b DM, also called monogenic diabetes of infancy, is a broad definition of diabetes, permanent or transient, during the first years of life with onset caused by a single gene defect [10]. Candidate gene defects are homozygous or heterozygous mutations in potassium inwardly-rectifying channel, subfamily J, member 11 (KCNJ11), Glucokinase (GCK), ATP-binding cassette transporter sub-family C member 8 (ABCC8) and insulin genes [11]. It is characterized by patients without pancreatic autoantibodies, implying that these β-cells malfunction is caused by a mutation and not from autoimmune response.
1.1.3. Pathophysiology
Abnormalities in β-cell functions leads to reduced insulin secretion that starts before the onset of symptoms. Low insulin activity results in increased glucose production by the liver and reduced glucose uptake by insulin sensitive tissues. As glucose accumulates in plasma, renal tubules are incapable of reabsorbing all the glucose, producing an osmotic diuresis. As insulin sensitive cells are deprived from glucose, fat and muscle breakdown is initiated to use free fatty acids and amino acids as fuels for glucose production by the liver, leading to weight loss. Accelerated fatty acids breakdown leads to overproduction of ketone bodies, leading to ketoacidosis and together with hyperglycemia and acidosis creates a fatal condition, if insulin therapy is not initiated [12].
Hypoinsulinemia has been associated to the dysregulation of several other hormones that also mediate the onset of T1DM. Lack of insulin signaling in adipocytes leads to low secretion of leptin, leading to increased hypothalamic pituitary adrenal (HPA) axis activity that centrally will increase glucagon, adrenocorticotropic hormone
Figure 2. T1DM leads to hyperglycemia and ketoacidosis. Hypoinsulinemia decreases plasma leptin
concentration by decreasing its secretion from adipose tissue. Low insulin and leptin secretion increase glucagon production by α-cells, signaling glucose release by the liver. Low leptin increases hypothalamus-pituitary-adrenal (HPA) axis activity and Adrenocorticotropic hormone (ACTH) release from the pituitary, increasing cortisol secretion from the adrenal glands and induce lipolysis of adipose tissue triglycerides. The increased release of free fatty acids (FFAs) and glycerol from adipose tissue into the bloodstream increases the delivery of glycerol and fatty acids substrates to the liver. Incomplete oxidation of fatty acids in the liver produces ketone bodies and increases hepatic acetyl-CoA, contributing to hyperglycemia by increasing the conversion of pyruvate to glucose. Adapted from Mittendorfer & Klein., 2014.
In is work , Perry et al. [15] could see that leptin treatment reduced glucagon production, and that gluconeogenesis and fat breakdown in poorly controlled T1DM rats was caused by hypoleptinemia induced activity of the HPA and more importantly, that changes could be dissociated from insulin concentrations.
1.2. Bone
1.2.1. FormationBone homeostasis is achieved by balanced activity of bone forming cells, the osteoblasts, and bone resorption cells, the osteoclasts. Osteoblasts are responsible for the secretion of a group of extracellular proteins that will give rise to the extracellular bone matrix. This includes osteocalcin, alkaline phosphatase and a large amount of type I collagen. First a non-mineralized matrix is formed, constituted by type 1 collagen, named osteoid and later mineralized through the accumulation of calcium phosphate in the form of hydroxyapatite, leading to the formation of the major mineral constituent of bone [16].
Figure 3. Bone homeostasis is accomplished by osteoclasts and osteoblasts. A) Osteoblasts arise from
mesenchymal progenitors (MP) through preosteoblasts and then becomes another type of osteoblast lineage cell, the osteocytes, after being trapped in the bone matrix. Osteoclasts are multinucleated resorptive cells derived macrophages, which are in turn progenies of hematopoietic stem cells (HSCs). B)
Osteoblasts are generated from mesenchymal cells through two distinct processes: intramembranous or endochondral ossification. During intramembranous ossification, mesenchymal progenitors condense and directly differentiate into osteoblasts. But in endochondral ossification, mesenchymal progenitors condense to form chondrocytes and perichondrial cells. Chondrocytes proliferate and undergo hypertrophy, and only then do osteoblasts differentiate from the perichondrial cells [17].
1.2.2. Transcription factors involved in osteoblast differentiation
Osteoblasts differentiation from mesenchymal stem cells initiates by the action of SRY (Sex Determining Region Y)-Box 9 (SOX9) and although SOX9 is indispensable for chondrogenesis, it also marks the mesenchymal progenitors that give rise to all osteoblasts. However, SOX9 is not expressed by mature osteoblasts.
Figure 4. The different stages of osteoblast lineage cell differentiation. Mesenchymal progenitors that
give rise to osteoblasts and chondrocytes are initially marked by the transcription factor SOX9. This is followed by the expression of RUNX2 and then OSX, leading to the development of osteoblasts. Some osteoblasts become osteocytes by being entombed in the bone matrix. SOX9 cells are bipotential and can also differentiate into chondrocytes. Dashed arrows represent that during development osteoblasts can switch fates under these conditions. . Adapted from Long, 2014.
During the process of differentiation, preosteoblasts are characterized by the expression of runt-related transcription factor 2 (RUNX2) and, in a more advanced stage of differentiation, both RUNX2 and osterix (OSX), while mature osteoblasts are characterized by the expression of osteocalcin [16]. Then a part of osteoblasts become osteocytes being trapped within the bone matrix and the rest either go into apoptosis or become inactive bone lining cells [18].
1.2.3. Remodeling
Once formed, bone undergoes remodeling that involves resorption and the formation of new bone; this occurs in micro scale throughout the skeleton. Bone remodeling is the predominant metabolic process regulating bone structure and function during adult life [19]. The cell type responsible for this process is the osteoclast, a tissue-specific macrophage polykaryon created by the differentiation of haematopoietic stem cells (HSCs) lineage at or near the bone surface. Mature osteoclasts activity is triggered by activation of receptor activator of nuclear factor (NF)-kB (RANK) by RANK ligand (RANKL) expressed by osteoblasts [20]. After its activation, osteoclasts undergo internal structural changes that prepare it to resorb bone, such as the rearrangements of the actin cytoskeleton and formation of a tight junction between the bone surface and basal membrane to form a sealed compartment. This external vacuole is then acidified by the export of hydrogen. Secretion continues with the export of the lytic enzymes TRAP and pro-CATK into a resorption pit. Through this process the osteoclast erodes the underlying bone. Degradation products, collagen fragments and solubilized calcium, phosphate and undercarboxylated osteocalcin are processed within the osteoclast and released into the circulation [16].
1.3. Bone Health in Type 1 Diabetes Mellitus
1.3.1. T1DM and bone loss
It is well established that T1DM is linked to a decrease of bone mineral density (BMD) and bone loss in humans [21–26], mice [27–32] and also in fin regeneration in zebrafish [33]. Different factors have been identified as responsible for this outcome. T1DM reduces osteoblast activity, as determined by serum osteocalcin levels which were found to be decreased in DMT1 mice models [31,34,35]. mRNA levels were also found to be reduced and associated with a reduced rate of mineral apposition [31,36– 38]. In addition, several studies have demonstrated an increase in terminal deoxynucleotidyl transferase dUTP nick end labeling (TUNEL) positive dying osteoblasts in diabetic compared to control [39,40]. So, enhanced osteoblast death caused by T1DM contributes to a reduction in osteoblast number and activity. In DMT1 mice models, osteoclast activity does not appear to be altered or decreased [36,41] in the majority of DMT1 studies, with only a few studies showing increased osteoclast markers [42], but this was proposed to be linked to the dose of streptozotocin used to induce diabetes in this model.
1.3.2. Insulin signaling and IGF1
Insulin plays an important role in bone growth due to its anabolic properties. Mice with 3–6 weeks, with insulin receptor (IR) deletion in osteoblasts revealed reduced bone volume and osteoblast number [43]. Also it has been proposed that insulin signaling in osteoblasts is necessary for whole-body glucose homeostasis, because insulin signaling in osteoblasts increase bone resorption by osteoclasts. With the increase in bone resorption, osteocalcin in its undercarboxylated form is released into the blood stream and acts as a hormone, signaling insulin expression in β-cells and other sensitive tissues [44,45]. Furthermore, animal models and cell studies showed that
osteocalcin can increase cell proliferation, stimulate insulin expression and secretion by pancreatic cells and enhance energy expenditure [43,46,47].
Figure 5. Model of action of insulin in bone resorption and osteocalcin regulation of insulin expression.
Insulin signaling in osteoblasts decreases osteoprotegerin (Opg) expression. The decrease in the OPG/RANKL ratio results in an increased expression of Tcirg1 in osteoclasts. Tcirg1 encodes for a
proton (H+) pump subunit and contributes to acidification of the resorption lacunae. The acidic pH of
approximately 4,5 generated during bone resorption is a sufficient mean to decarboxylate and activate the osteocalcin molecules (Gla-OCN) stored in the bone extracellular matrix. The undercarboxylated active osteocalcin (Glu-OCN) promotes insulin sensitivity in peripheral organs and stimulates insulin secretion by the β-cells of the pancreas. Adapted from Clemens and Karsenty, 2011.
Insulin growth factor 1 (GF1) is crucial for postnatal skeletal growth. Although
it is mostly known for its effect on growth plate cartilage, it also regulates various aspects of osteoblast lineage cells metabolism [48]. IGF1 is regulated centrally by growth hormone (GH) and mainly produced by the liver. The direct effects of IGF1 on bone could be seen when IGF1 receptor (IGF1R) knockout (KO) mice specifically in osteoblasts treated with GH failed to increase osteoblast number and osteoblast-specific deletion or overexpression of IGF1R reduced or increased bone formation [49,50].
1.3.3. Advanced glycation end products (AGEs)
Hyperglycemia increases nonenzymatic protein glycation, leading to the formation of a variety of chemically modified proteins known as advanced glycation end products (AGEs). Type 1 collagen is a target for AGEs leading to an increase in non-enzymatic collagen glycation [34], by forming covalent cross-links with collagen molecules through enzymatic reactions. AGEs are associated with reduced osteocalcin levels, inhibiting osteoblastic cells function [51], increasing cell clumping and decreasing cellular spreading [52]. AGEs increase with age and are accumulative and irreversible. Diabetic bone also exhibit increase in AGEs receptor (RAGE) causing AGEs increase [53]. In turn RAGE activation initiates inflammatory signals that stimulate a generation of reactive oxygen species and inflammation mechanisms which enhance AGE formation [54].
Figure 6. Principal causes for accumulation of AGEs in bone. Oxidative stress, high glucose, aging
processes, and low bone turnover contribute to an increased formation and accumulation of AGEs in bone. Together with an increase of certain pro-inflammatory cytokines, AGEs induce both the activation of osteoclastogenesis and osteoblast dysfunction; leading to an accelerated development of osteoporosis. Adapted from Sanguineti et al. 2014.
1.3.3.1. Inflammation
Bone inflammation has been linked to T1DM, principally because of AGEs or by autoimmunity reaction in T1DM.
It is currently assumed that both types 1 and 2 diabetes are associated with inflammation [37,40,55]. RAGE cell expression leads to activation of inflammation and tissue damage, upregulating inflammatory mediators like tumor necrosis factor-alpha (TNF-α), interleukin-1 (IL-1), IL-6, and C-reactive protein (CRP) [54]. These suggest that RAGE activation contributes to perpetuation of AGEs and pro-inflammatory ligands synthesis, generating a microenvironment favorable for ligands production and suppressing protective mechanisms [56]. Diabetic mice models have demonstrated elevated TNF-α mRNA expression in bone marrow and is linked to early osteoblast death [37,57]. Treatment with TNF-α inhibitors reduced diabetes-induced increase in osteoblast apoptosis [58,59], suggesting a role for inflammation within the bone marrow in inducing osteoblast death.
1.3.4. Bone marrow adiposity
Both osteoblasts and adipocytes derive from MSC, this evidence has led to the assumption that lineage selection, adipocyte over osteoblast, could be involved in the diminishing of BMD due to an increase in bone marrow adiposity . Although an increase in marrow adiposity has been observed in some T1DM mice models [31,37], this relation is not seen in the vertebrae where there is a loss of bone but no increase in bone marrow adipocytes [60]. Supporting this idea are the results obtained from treating bone marrow adipocytes, either with PPARƴ antagonist [61] or with leptin [60], where, in both cases, it was possible to prevent marrow adiposity but in neither of the treatments bone loss was prevented. This finding suggests that T1DM bone marrow adiposity increase in some T1DM mice models alone couldn´t be the cause for a decrease in bone volume [27].
1.3.5 Leptin and T1DM
The regulation of bone by leptin has been one of the major findings in the field of bone metabolism in the last fifteen years. Leptin is an adipocyte-derived hormone that is traditionally associated with controlling appetite and reproduction. But it was proposed that leptin signaling, through its receptors in the hypothalamus, stimulates noradrenaline secretion, that binds to β2-adrenergic receptors (Adrb2) on osteoblasts, inhibiting bone formation and increasing RANKL secretion, thus leading to increase bone resorption by osteoblasts [62]. After this findings several works have focused in understanding how leptin regulates bone and to explain the phenotype of the leptin KO ob/ob mice that have increased trabecular bone volume, but decreased cortical bone mass [63–65]. The most important matter of debate at the present moment, is if leptin regulates bone centrally or peripherally or by both ways. After the work of Ducy et al. [66], Steppan et al. [67] could see increase in bone mineral density after peripheral administration of leptin in ob/ob mice (although leptin can cross the blood-brain barrier and could have acted centrally) and similar results could be seen by Burguera et al. [68].
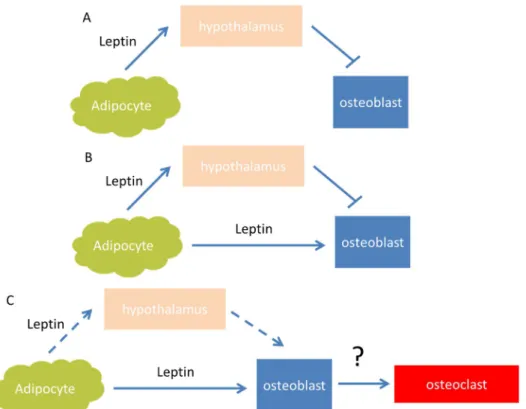
Figure 7. Models proposed for action of leptin on bone. A) Ducy’s model, leptin indirectly inhibits bone
formation through an hypothalamic relay. B) Burguera/Hamrick model, skeletal effects of leptin result from anabolic actions of peripheral leptin and antiosteogenic actions of hypothalamic leptin. C) Turner model, leptin directly increases bone growth, osteoblast number and function, as well as osteoclast function. These physiological actions of the hormone are largely mediated through peripheral leptin signaling. Solid arrows represent the major route of action of action. The question mark indicates that mediation of the leptin-dependent increase in osteoclast activity by the osteoblast is speculative. Adapted from Turner et al., 2013.
Later, Hamrick et al. [63] reported that, consistent with observations from the Karsenty group, ob/ob mice exhibit a high bone mass in the lumbar vertebrae, but a contrastingly low trabecular and cortical bone mass in the femur, proposing a concurrence of both axial catabolic and appendicular anabolic effects of leptin on the skeleton. Finally, Turner et al. [65] was extremely polemic about the work of Ducy et al. [66] saying that the central regulation of leptin is not the principal pathway for the regulation of bone and the direct signaling of leptin through the leptin receptors in both osteoblasts and osteoclasts enhance bone formation and bone resorption respectively.
1.4. T1DM animal models used in our study
1.4.1. Ins2+/akita mouseMice have two different genes for insulin, Ins1 and Ins2, the latter being the ortholog for human INS gene. Ins2+/akita mouse, first generated in 1997 by Yoshioka and
colleagues [69], have only one allele (Ins2) mutated. The mutant allele is characterized by a transition from G to A at nucleotide 1907 disrupting an Fnu4HI site in exon 3. This mutation changes the seventh amino acid in the A chain of mature insulin, from Cys96 (TGC), to Tyr (TAC).
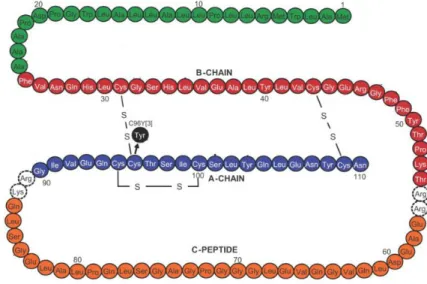
Figure 8. Diabetes of the Ins2+/akita mouse is caused by a single locus mutation, and is inherited in an
autosomal dominant manner. A GA mutation changed amino acid Cys96 (TGC) to Tyr (TAC). Cys96 corresponds to the seventh amino acid in the A chain (A7) of mature insulin and forms one of the three intramolecular disulfide bonds with Cys31 located at B7 [70]. Adapted from Støy J et al.
This cysteine residue normally forms an intramolecular disulfide bond with cysteine at B7. Disruption of the disulfide bonds is expected to induce a drastic conformational change of the molecule. Normal and mutant Ins2 alleles are transcribed similarly in pancreatic islets of heterozygous mice, although immunofluorescence and immunoblot analyses detected reduced levels of insulin and proinsulin [69], rendering β cells incapable of insulin secretion in a dominant negative way [71].
Two of the proteins playing a major role in regulation of Ins2, protein disulfide
isomerase (PDI) and binding immunoglobulin protein (BiP), are overexpressed in the
islets of Ins2+/akita mice. Both proteins reside in the ER, where disulfide formation and folding of secreted protein occur. Disulfide formation can be formed in the wrong temporal order and even randomly in some proteins. In this case, lack of cysteine at A7 in the mutant proinsulin will leave cysteine at B7 free and thereby increase the possibility that later, cysteine forms incorrect disulfide bonds with other molecules. This would affect the disulfide bond formation of coexisting wild-type proinsulin and result in an aggregation in Ins2+/akita mice .
Figure 9. Pathway of preproinsulin to insulin in WT and Ins2+/akita mice. In Ins2+/akita mouse, mutant
proinsulin will acquire a deficient structure, becoming unable to exit the ER. The seventh amino acid of the B chain will create a disulfide bond, with the seventh amino acid of the A chain of proinsulin non mutated allele, forming an aberrant structure. This protein will not be expressed and it will be eliminated.
This form of T1DM, modeled by Ins2+/akita mouse [69,71,72], is also seen in
humans [7-9] and is part of the sub-group Type 1b DM or permanent neonatal diabetes mellitus (PNDM).
Symptoms in heterozygous Ins2+/akita mutant mice include hyperglycemia,
hypoinsulinemia, hypoleptinemia, polydipsia, and polyuria, beginning around 3-4 weeks of age but no obesity, infertility, or immunological alterations have been described to date in these mice. Histological signs of glomerulosclerosis have also been described in 20-wk-old Ins2+/akita mice and renal function impairment after age 30 weeks [73]. But although this model develops bone loss, with a clear decrease in bone mineral density, no histological characterization of its bone structure/morphology or any
in vitro work using Ins2+/akita at adult and aging time points is available.
1.4.2. Transgenic zebrafish Tg(ins:Eco.NfsB-mCherry)
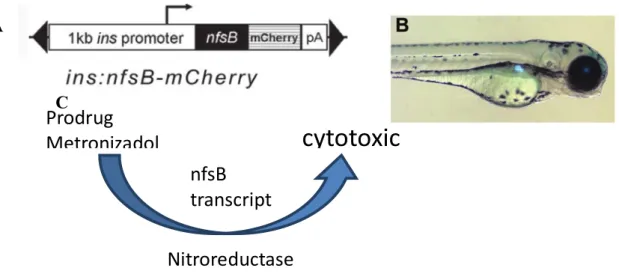
With the objective of generating a zebrafish model of β-cell regeneration, Pisharath and colleagues [74] inserted an Escherichia coli gene downstream from the promoter region of insa gene called nfsB. This bacterial gene encodes a nitroreductase (NTR) enzyme, which can convert prodrugs such as metronidazole (Met) to cytotoxins. By fusing nfsB to a mCherry florescent protein, it is possible to visualize insa expressing cells and ablation of β-cells 3 days after an intraperitoneal (IP) injection with Met.
After this period, increased blood glucose can be detected and progressive regeneration of β-cells leads to normalization of glycaemia after two weeks of Met exposure [75]. Also it was observed that after 3 day exposure to Met, blood glucose readings were higher than in the streptozotocin (STZ) induced diabetic WT zebrafish, suggesting that β-cell ablation may be more complete in the Tg(ins:Eco.NfsB-mCherry), making this model more suitable for the study of diabetes [76].
Also it was observed that β-cell ablation was achieved without affecting the neighboring α and δ cells [74]. During the window period of induced hypoinsulinemia, different protocols can be applied to study the effects of DM, also the hyperglycemic state can be prolonged if continuous exposure to Met is applied.
Nitroreductase
Prodrug
Metronizadol
cytotoxic
CnfsB
transcript
product
AFigure 10. Transgenic zebrafish Tg(ins:Eco.NfsB-mCherry) is a suitable model to study DM; A This model as
a e.coli gene nfsB and a mCherry florescent protein downstream of the promoter region of the insa gene; B Transgenic larvae with florescent insa expressing cells, mainly the pancreas; C nitroreductase enzyme from
nfsB gene catalysis Met generating a cytotoxic compound induced ablation in insa expressing cells. Adapted
1.5. Objectives of this work
In chapter two we proposed to identify histological and microarchitecture alterations in the long bones of diabetic mice model Ins2+/akita and provide some
evidence towards identifying the molecular players regulating these changes. In chapter three we aimed to test the effects of vitamin D, vitamin D analogs and
calcimimetics in fin regeneration and mineralization under diabetic conditions in a transgenic zebrafish model of diabetes.
In chapter four we focused in understanding the role of paralogs genes of insulin in human, mouse and zebrafish, especially if they can also regulate glucose as the ancestral gene. Also in this chapter we proposed to investigate if extrapancreatic expression of both INS and INS-IGF2 can occur, mimicking pancreatic INS action.
CHAPTER 2.
ALTERED BONE ARCHITECTURE IN THE TYPE 1
DIABETES MOUSE MODEL INS2
+/AKITACHAPTER 2. ALTERED BONE ARCHITECTURE IN
THE TYPE 1 DIABETES MOUSE MODEL INS2
+/AKITAFilipe R. Carvalho Sofia M. Calado Gabriela A. Silva Gabriela S. Diogo Joana Silva Rui L. Reis M. Leonor Cancela Paulo J. Gavaia
This chapter is part of a research paper submitted for publication to BONE
Author´s contribution: Study design MLC and PJG. Study conduct: FRC and PJG. Data collections:
FRC, PJG, SMC, GAS, GSD, JS, RLR. Data analyses: FRC and PJG. Data interpretation: FRC and PJG. Drafting manuscript: FRC. Revising manuscript content: PJG and MLC. Approving final version of manuscript: all authors.
2.1. Abstract
Type 1 diabetes mellitus (T1DM) is related to several cartilage and bone alterations including growth retardation, increased fracture risk and bone loss. Accumulation of advanced glycation end products (AGEs), diminished insulin signaling, imbalance in calcitropic hormone levels, and leptin deficiency has been identified as possible causes for these alterations. To determine the effect of long term diabetes on bone we used adult and aging Ins2+/akita mice that develops T1DM of 5 weeks after birth. Both Ins2+/akita and WT mice at 4, 6 and 12 months were used to assess bone parameters such as femur length, growth plate thickness and number of mature and pre-apoptotic chondrocytes. In addition, bone microarchitecture of the
showed a decreased longitudinal growth of the femur that was related to decreased growth plate thickness, reduced number of chondrocytes and to a higher number of pre-apoptotic cells. These changes were associated with increased expression of Adamst-5, suggesting higher cartilage degradation, and with low expression of Igf1 and ColII that influence cartilage matrix formation. Ins2+/akita bone changes were characterized by low cortical bone area (Ct.Ar) but higher trabecular bone volume (BV/TV) and to reduced gene expression of Oc and Runx2. We suggest that Ins2+/akita mice bone phenotype is caused by reduced bone formation and even more reduced bone resorption due to leptin and insulin deficiency.
Keywords: bone; cartilage; diabetes; insulin; leptin.
2.2. Introduction
The global prevalence of type 1 diabetes mellitus (T1DM) has been increasing at a rate of 2-5% a year [5] leading to an increase in diabetes related pathologies, including bone disorders. T1DM was previously shown to induce alterations in cartilage [27,28,31,77,78] and bone loss [27,28,30,35,37,60,79,80], associated to different factors like increased glucose serum concentration and reduced insulin secretion by the β-cells, inflammation and altered gene expression. Advanced glycation end products (AGEs) are proteins or lipids that are formed in hyperglycemic environments. Since their cumulative effects increase with age AGEs represent a key player in vascular disease associated to diabetes [81,82]. In addition to affecting the vascular system, AGEs are involved in an increase of inflammatory activity and associated to a decreased bone formation due to osteoblastic apoptosis and decreased osteoblast proliferation [29,51,52,83] or increased osteoclastic activation [56], and chondrocyte apoptosis in cartilage [29,84]. The receptor for AGEs (RAGE) seems to be the molecular intervenient that activates the pathways leading to oxidative stress and inflammation
[54,85] including in bone since osteoblasts, osteoclasts and chondrocytes express RAGE [53,86]. Hypoinsulinemia present in T1DM can also affect bone metabolism since insulin signaling in osteoblasts was found to regulate bone resorption by activating osteoclasts activity [47], releasing undercarboxylated osteocalcin to the blood stream, which in turn affects glucose homeostasis by signaling insulin secretion in β-cells and others insulin sensitive tissues [43]. This relationship between bone and insulin was demonstrated when Ob-IR mice, lacking the insulin receptor (IR) only in osteoblasts, became glucose intolerant [47]. T1DM patients and mice models face a rapid weight loss during the onset of the disease [27,28,78,80,87], that persists if not treated, creating a state similar to the observed by accelerated fastening, that result in loss of fat and proteins. Weight loss has been associated with low bone mass [88], but interestingly only a decrease in fat mass was found to be correlated with decreased bone mineral density (BMD) and not lean mass or total body weight [89–91]. This close relationship between fat and bone seems to be explained by the fact that adipocytes secrete leptin. Accordingly, both the leptin knockout (KO) mice ob/ob and the leptin receptor KO db/db mice have impaired bone formation, exhibiting a normal or decreased cortical bone volume (BV/TV) although presenting a higher trabecular BV/TV [65,66]. It was then postulated that leptin binding to its receptors in the hypothalamus increases the expression of noradrenaline activating β2-adrenergic receptors pathway in osteoblasts, inhibiting bone formation and increasing the expression of RANKL, promoting the differentiation and proliferation of osteoclasts [62,92,93]. These findings were then supported by the results of β2-adrenergic receptor KO mice (Adrb2-/-), that exhibit an increase in trabecular bone at the age of 6 months
proposed that peripheral leptin induces bone formation and resorption and that it represents the main route of action of leptin in bone. Food intake is correlated with high levels of leptin and fasting periods are associated with low levels of leptin as previously observed in fasting mice and in anorexia nervosa [96,97]. Devlin et al. [96], performing experiments with mice under caloric restriction (CR) from 3 to 12 weeks of age, not only correlated leptin levels with CR, but also with low cancellous BV/TV and low cortical area, assuming that CR in juvenile mice under a fast period of growth lead to bone loss. But unexpected results were observed in the 6 months mice after a period of CR of 10 weeks [98], that presented low cortical mass, but higher trabecular BV/TV in the vertebra and unchanged trabecular BV/TV in the femur. In our study we hypothesized that inflammation together with leptin and insulin deficiency could be the principal causes involved in cartilage and bone phenotype of Ins2+/akita.
2.3. Materials and Methods
2.3.1. Mouse modelsWild type C57BL/6 and Ins2+/akita (C57BL/6 background) mice at 4, 6 and 12 months were used to perform the experimental procedures. Diabetes was monitored by blood glucose measurements using a Glucose Assay Kit (Free Style Precision, Abbott Laboratories, Illinois, USA) and only Ins2+/akita mice with glucose values >300 mg/dl were used in this experiment. All animal manipulations were conducted in accordance with principles and procedures followed the guidelines from the Federation of Laboratory Animal Science Associations (FELASA). Age matched male wildtype mice were purchased from Jackson Laboratory (Bar Harbor, Maine). All mice were kept on a light/dark (12h/12h) cycle at 23ºC, and received food (standard lab chow) and water ad libitum.
2.3.2. Total RNA isolation
Left femur and tibia were isolated, cleaned from adhering tissues then snap-frozen in liquid nitrogen. Frozen bones were crushed using a mortar and pestle and RNA extracted with the Isol-RNA Lysis Reagent 5 PRIME® (Hilden, Deutschland) according to manufacturer’s protocol. RNA integrity was verified using ExperionTM RNA Analysis Kit (BIO-RAD, Hercules, CA, USA).
2.3.3. Quantitative real-time polymerase chain reaction (qRT-PCR)
Reverse transcription was performed using Moloney Murine Leukemia Virus Reverse Transcriptase (M-MLV RT) (Life Technologies, Carlsbad, CA, USA) according to the manufacturer’s protocol. Using iQ™ SYBR® Green Supermix (Life Technologies), qRT-PCR was performed on an CFX96 Touch™ Real-Time PCR Detection System (BIO-RAD, Hercules, CA, USA) 45 cycles 15 sec. for annealing and 30 sec. for amplification. All gene expression data were normalized against
hypoxanthine phosphoribosyltransferase 1 (Hrpt1).
2.3.4. Bone histology and histomorphometry
The right tibias were fixed in 4% paraformaldehyde, (pH 7.4 in PBS), and decalcified in 10% EDTA/TRIS-HCl (pH 7.4) for 15 days, then transferred to 70% EtOH and processed for dehydration and infiltration on a routine overnight processing schedule. Samples were then embedded in paraffin and sections with 6 µm prepared in a microtome. Before staining, sections were deparaffinized in Xylene and dehydrated in an increasing gradient of EtOH. Sections were stained with safranin O, fast green and Mayer´s hematoxylin [99].
2.3.5. Growth plate measurements
For measurement of the growth plate (GP) thickness, 8 to 10 measurements were performed, separated by 0,05 mm of distance per GP. 5 animals for each group were used and 3 consecutive histological sections per tibia were analyzed. Proliferative chondrocytes were identified according to its morphology and position in the growth plate.
2.3.6. Immunohistochemistry
Sections were processed as described above. After deparaffination and hydration, we performed heat mediated epitope retrieval for 25 min in tris-EDTA pH9 buffer and hyaluronidase (Sigma H3506) treatment for 30 min. Sections were then incubated for 30 min. with blocking buffer (Goat serum and BSA) to block unspecific binding sites. Sections were incubated overnight at 4 °C with rabbit polyclonal Anti-Caspase-3 diluted in PBS 1:100 (ab13847, ABCAM, Cambridge, UK). Slides were then incubated in 0.3% H2O2 in PBS with 0.1% Triton X-100 for 15 min. The secondary antibody, anti-rabbit IgG – peroxidase (Sigma Aldrich) was applied diluted 1:100 in PBS and incubated for 90 min at room temperature. The signal was detected by incubating the sections for 4 min in a 0.1% 3,3′-diaminobenzidine (DAB) substrate and 0.02% hydrogen peroxide solution. The sections were counterstained with Mayer’s hematoxylin.
2.3.7. Detection of apoptosis
Total number of Caspase 3 positive proliferative and hypertrophic cells was counted and hematoxylin stained cells were used as negative control for pre-apoptotic cells. From each animal tested at least 3 sections from each femur separated by 25 µm, were counted and the percentage of apoptotic cells in growth plate calculated. Cells were counted using the cell counter plug-in of imagej software.
2.3.8. Micro-computed Tomography (CT) analysis
Three femurs from each time point and genotype were scanned using a Bruker microCT Skyscan™ CT 1072 scanner (Kontich, Belgium) with an accelerated voltage of 50 kV and a current source of 197 uA at 5.1µm of pixel size. Measurements in the trabecular region were made in the distal epiphysis of the femur defined at 0.255mm under the growth plate extending 1mm (200 layers) toward to diaphysis, and excluding the outer cortical shell. Quantitative parameters were obtaining by the Skyscan™ CT-analyzer software for each region of interest. The thickness of the cortical bone was measured through the images of DataViewer software taken from the distal femoral methaphysis and all measurements were done using the ImageJ software.
2.3.9. Statistical analysis
All statistical analyses were performed using Stata Statistical Software data analysis and data was evaluated using the one-way ANOVA followed by Bonferroni multiple comparisons test with p˂0.05 considered statistically significant. Results are presented as means ± standard deviation of the mean (SD).
2.4. Results
2.4.1. T1DM reduces femur length and body weight in Ins2+/akita
Diabetes in Ins2+/akita mice caused a reduction in femur length and body weight at all 3 analyzed age stages. Reduction in femur length were found to be of 5.35%, 5.34% and 3.8%, at 4, 6, and 12 months respectively (figure 10.B), the differences being statistically significant with p<0.001. This reduction was also observed in body weight of Ins2+/akita, with differences of 27.06%, 26.16% and 26.92%, at 4, 6, and 12 months
Figure 11 A) X-ray analysis of Ins2+/akita and WT mice femurs at 4, 6 and 12 months; B) Ins2+/akita
Femur length is highly significant smaller than WT at 4, 6 and 12 months, demonstrating that type 1
diabetes mellitus is related to growth retardation. is li C All body weight of Ins2+/akita is constantly
significantly reduced than WT at 4, 6 and 12 months, caused by the impaired glucose homeostasis leading to activation of alternative pathways degrading fatty acids and proteins from soft tissues leading to weight lost. *p<0.05, **p<0.001.
2.4.2. Growth plate thickness is reduced in Ins2+/akita
Potential alterations in growth plate structure will impair longitudinal bone growth so we investigated if growth plate of Ins2+/akita could be affected. Growth plate measurements showed that at 4 and 6 months the thickness was reduced, but at 12 months of age only a trend for reduction was observed (figure 11.B). Taking into account that it is during the proliferative phase of chondrocytes that bone lengthening occurs, we counted the total number of proliferative chondrocytes and significant differences were observed at 4 and 6 months in Ins2+/akita compared to WT, showing a reduction in the number of proliferative chondrocytes (figure 11.C). No differences
were observed at 12 months, a result which is in agreement with growth plate thickness measurements. To determine if the number of hypertrophic chondrocytes was altered, we performed an immunohistochemical detection of caspase 3 with the objective of identifying pre-apoptotic cells. The total number of chondrocytes in growth plate was determined by counting the cells under the microscope and significant differences were observed at 4 months, with the group of Ins2+/akita having a higher percentage of
pre-apoptotic cells (figure 12.B).
.
Figure 12. A) Growth plate thickness of Ins2+/akita mice and WT. Reduced number of proliferative
chondrocytes leaded to thinner growth plates and to longitudinal bone growth, black arrows represent average of growth plate thickness of WT; B) and C) growth plate thickness and number of proliferative
Figure 13. A) Evaluation of pre-apoptotic cells by Immunohistochemistry in growth plate, black arrow
caspase 3 positive cells, yellow arrow negative cells; B) Ins2+/akita showed increased number of
pre-apoptotic cells in growth plate than WT significant differences *p<0.05.
2.4.3. Ins2+/akita have reduced cortical area and higher trabecular bone
volume at 4, 6 at 12 months
Total area (Tt.Ar) of cortical bone in Ins2+/akita was found to be reduced by 32% at 4 months, 16% at 6 months and 25% at 12 months of age. These differences were significant for all ages analyzed (p˂0.05) (Table 1). The reduction in cortical bone was principally due to a substantial decrease in cortical area (Ct.Ar), of 53% at 4 months, 35% at 6 months and 25% at 12 months, with all results highly significant compared to WT controls (p<0,001) (Table 1 and Figure 13.B). This decline in cortical bone observed in the diabetic mice was confirmed by a decrease in the cortical area fraction (Ct.Ar/Tt.Ar), cortical thickness (Ct.Th) and periosteal perimeter (Ps.Pm) (p<0.05) (Table 1). Although not significantly different, the marrow area (Ma.Ar), showed a reduction in area at all ages. A significant reduction was found in the endocortical perimeter (Ec.Pm) (p<0.05) at 12 months (Table 1). Cortical bone parameters were
relatively constant from 4 to 12 months in Ins2+/akita. Diabetic mice did not show any
Trabecular bone parameters showed opposite results from those found in cortical bone. Differences in bone volume relative to trabecular volume (BV/TV) in Ins2+/akita were found to be highly significant at 4 months (p<0.001) with an increase of 45%, an increase of 46% (p<0,05) at 6 months, and an increase of 30% at 12 months (Table 1 and Figure 14.B).
Table 1. Femur morphometry data of trabecular distal region and of metaphysis distal cortical region.
BV/TV Bone volume %; BS/TV Bone surface density Ratio mm2/mm3; BS/BV Specific bone surface
mm2/mm3; SMI Structure model index; Tb.N Trabecular number 1/mm; Tb.Th Trabecular thickness
mm; Tb.Sp Trabecular separation mm; Tt.Ar Total area inside the periosteal envelope mm2; Ct.Ar
Cortical bone area mm; Ma.Ar Medullary area mm2; Ct.Ar/Tt.Ar Cortical area fraction %; Ct.Th Average
cortical thickness mm; Ps.Pm Periosteal perimeter mm; Ec.Pm Endocortical perimeter mm *p<0.05, **p<0.001.
Differences were also observed on the increased bone surface relative to trabecular volume (BS/TV) at 4 (p<0,001), 6 (p<0.001) and 12 months (p<0.05). Higher BV/TV values in Ins2+/akita were due to a significant increase in the number of trabeculae (Tb.N), that was of 45% at 4 months (p<0.001), 52 % at 6 months (p<0.05) and 43% at 12 months, and not due to the size of the trabeculae, since no differences were observed in the specific bone surface (BS/BV) or in the trabecular thickness
4 months 6 months 12 months
Trabecular Akita n = 3 n = 3 WT Akita n = 3 n = 3 WT Akitan = 3 n = 3 WT BV/TV (%) 33,13* ± 3,53 18,34 ± 0,772 14,86* ± 0,370 8,01 ± 3,420 10,18 ± 1,334 7,13 ± 1,984 BS/TV (mm2/mm3) 0,022** ± 0,001 0,013 ± 0,000 0,012** ± 0,001 0,006 ± 0,002 0,008* ± 0,001 0,005 ± 0,001 BS/BV (mm2/mm3) 0,068 ± 0,004 0,073 ± 0,003 0,082 ± 0,002 0,082 ± 0,010 0,083 ± 0,006 0,073 ± 0,005 SMI 1,82* ± 0,182 2,27 ± 0,070 2,48 ± 0,107 2,69 ± 0,227 2,26 ± 0,033 2,65 ± 0,231 Tb.N (1/mm) 0,0060** 0,0005 ± 0,0033 0,0001 ± 0,0031* ± 0,0002 0,0015 ± 0,0006 0,0021 ± 0,0002 0,0012 ± 0,0003 Tb.Th (mm) 55,29 ± 1,724 55,94 ± 2,391 48,11 ± 1,304 52,93 ± 5,632 47,91* ± 3,041 59,40 ± 1,020 Tb.Sp (mm) 95,79** ± 5,847 160,58 7,572 ± 148,40** ± 1,251 234,20 ± 21,043 200,52** ± 3,991 272,14 ± 23,111 Cortical Tt.Ar (mm2) 1,91** ± 0,180 2,52 ± 0,242 1,97 ± 0,04 2,30 ± 0,06 2,08* ± 0,144 2,60 ± 0,135 Ct.Ar (mm2) 0,76** ± 0,065 1,16 ± 0,076 0,72** ± 0,05 0,97 ± 0,03 0,78** ± 0,060 1,11 ± 0,009 Ma.Ar (mm2) 1,14 ± 0,12 1,36 ± 0,18 1,24 ± 0,01 1,33 ± 0,08 1,30 ± 0,11 1,49 ± 0,14 Ct.Ar/Tt.Ar (%) 0,40* ± 0,015 0,46 ± 0,020 0,37** ± 0,02 0,44 ± 0,02 0,37* ± 0,020 0,43 ± 0,025 Ct.Th (mm) 0,15** ± 0,014 0,20 ± 0,010 0,13** ± 0,01 0,17 ± 0,01 0,15* ± 0,005 0,18 ± 0,013 Ps.Pm (mm) 5,14* ± 0,323 6,04 ± 0,394 5,32* ± 0,07 6,03 ± 0,09 5,36* ± 0,212 6,23 ± 0,292 Ec.Pm (mm) 4,07 ± 0,243 4,55 ± 0,299 4,33 ± 0,01 4,75 ± 0,10 4,31* ± 0,177 5,05 ± 0,527
(Tb.Th) (Table 1). In Ins2+/akita the high Tb.N led to a highly significant (p<0.001)
reduction in trabecular separation (Tb.Sp) parameters in all 3 time points analyzed (Table 1).
Figure 15. A) Histological sections of the proximal mid-epiphysis of the tibia and MicroCT images of the
distal mid-epiphysis of femur of Ins2+/akita and WT mice of 4, 6 and 12 months and significant differences
could be seen in BV/TV, BS/TV, Tb.N and Tb.Sp bone parameters. The higher bone volume observed in
Ins2+/akita trabeculae is explained by the increase in trabeculae number and not trabeculae thickness or
size. These results also suggest reduced bone resorption; B) Ins2+/akita mice has significant increase in
trabecular bone volume (BV/TV) when compared to WT mice at 4, 6 and a trend of increase at 12 months *p<0.05, **p<0.001.
the most abundant protein in cartilage. Adamst-5 was found to be overexpressed at all time points in Ins2+/akita being highly expressed at 4 and 12 months (p<0.001) and also significantly upregulated at 6 months (p<0.05) (Figure 16.A). Col2 expression was found to be downregulated at both 4 and 6 months (p<0.05) compared to WT (Figure 16.B). To determine if growth factors were also affected, Igf1 gene expression levels were found to be downregulated at 6 months (p<0.05) and highly downregulated at 4 at 12 months (p<0.001) (Figure 16.C). Expression levels of Runx2, one of the main transcription factor involved in osteoblast differentiation, was found to be significantly reduced at 4 and 6 months (p<0.05) in Ins2+/akita (Figure 16.E) while the marker of mature osteoblasts osteocalcin (OC or BGP) was signidficantly upregulated at 4 months but not at later stages.
Figure 16. Diabetes in Ins2+/akita induced changes in mRNA gene expression in cartilage and bone; A)
Adamst-5 expression is increased at all ages in Ins2+/akita suggesting higher cartilage degradation; B) Col2
expression is reduced at 4 and 6 months in Ins2+/akita being in accordance with the reduced cartilage matrix
area of growth plate; C. Igf1 expression is reduced at all ages in Ins2+/akita explaining in part the growth
retardation phenotype; D) and E) Oc and Runx2 expression is reduced at 4 months and at 4 and 6 months
Ins2+/akita respectively, suggesting reduced bone growth. *p<0.05, **p<0.001.
2.1.5. Discussion
T1DM is related to bone growth retardation in puberty [100,101] and increased risk of fracture throughout life, leading to increased morbidity and mortality [102]. Increased bone porosity and smaller cortical area are the principal causes for the
also be observed in Ins2+/akita mice, reflected by a decreased length of the femurs when
compared to WT mice at all time points. Similar results were found in Ins2+/akita at 10 weeks [27], in streptozotocin induced diabetic mice and rats [27,28,80], in CR mice [96,98], in ob/ob and leptin receptor db/db mutants [62,63,65]. In our work, impaired bone growth in length could be explained by a reduction in growth plate thickness of
Ins2+/akita mice at 4 and 6 months and increased number of pre-apoptotic chondrocytes
in growth plate at 4 months that reflect a lower metabolic activity of the cartilage and translates in reduced bone growth. Similar results were observed in diabetic rodents and in CR mice [27,79,96] demonstrating a direct relation between diabetes and impairment of long bone growth. Reduction in growth plate thickness could also be explained by a decrease in the number of proliferative chondrocytes and downregulation of Col2, also observed in Ins2+/akita at 10 weeks [27]. Increased bone inflammation has been associated with osteoblast death, that have been related to bone marrow inflammatory events [57] and specially by increasing pro-apoptotic and pro-inflammatory cytokines in bone environment [37]. One of those well-defined cytokines is tumor necrosis factor α
(TNFα) [104,105] which has been associated with upregulation of metalloproteinases
including Adamst-5 [106]. Accordingly, this enzyme was found to be highly expressed in our study, likely contributing to higher cartilage degradation. Our results also showed low expression levels of Igf-1 in Ins2+/akita at all time points. Reduced circulating Igf-1 concentrations have been associated with reduced linear growth [107], cartilage degradation, chondrocytic and osteoblastic proliferation [108]. Serum Igf-1 was also found to be reduced in CR mice [96,98] caused by impaired growth hormone signaling [109]. These results suggest that a decreased Igf signaling might be involved in the reduction of bone quality parameters observed in diabetics. Diabetes has been associated to leptin deficiency [38,110,111], and leptin treated mice were shown to have