Licenciado em Engenharia Civil
Experimental Campaign Addressing
Lap-Splices under Cyclic Loading
Dissertação para obtenção do Grau de Mestre em Engenharia Civil
Orientador: Professor Doutor João Pacheco de Almeida,
Investigador Pós-Doutorado, EPFL
Co-orientador: Professor Doutor Corneliu Cismasiu,
Professor Associado, FCT/UNL
Presidente: Prof. Doutor Carlos M. Chastre Rodrigues, Professor Auxiliar da Faculdade de Ciências e Tecnologia da Universidade Nova
de Lisboa
Arguente: Prof. Doutor António M. P. Ramos, Professor Auxiliar da Faculdade de Ciências e Tecnologia da Universidade Nova de Lisboa
Vogal: Prof. Doutor Corneliu Cismasiu, Professor Associado da Faculdade de Ciências e Tecnologia da Universidade Nova de Lisboa
“Copyright” Tiago Miguel Nico Pereira, FCT/UNL e UNL
Acknowledgements
Em primeiro lugar um especial agradecimento para a minha família por todo o apoio que me deu ao longo de todo um percurso de cinco anos pela universidade.
For this dissertation, I want to express my deepest gratitude to all the EESD lab in EPFL in particular to my co-advisors Danilo Tarquini and João Pacheco de Almeida for the opportunity and for all the help along the former semester.
I
Abstract
Many existing bridges were built before modern seismic design guidelines were written. This means that particularly in countries with moderate seismicity where another type of loads such as gravity, wind or snow are more demanding, the seismic hazard may have been underestimated in the past years. Past experience shows that critical details, including lap-splices on the potential plastic hinge region above the foundation and low transverse reinforcements ratios, can lead to a small deformation capacity of the existing bridge piers and therefore to a possible major structural damage.
The performance of RC members featuring lap splices was extensively studied in the past. However, a large number of authors focused on the force capacity of lap splices while their deformation capacity was rather neglected. This topic has become a target of interest only recently.
This dissertation represents the first part of a research project developed at École Polytechnique Fédérale de Lausanne that has the final goal of presenting a constitutive law capable of predicting the lap splice behavior, in particular its deformation capacity. The dissertation presents an experimental campaign regarding the lap splice performance under cyclic loading.
This experimental campaign gives continuity to the experimental campaigns presented by Bimschas (2010) and Hannewald et al. (2013), where three large-scale piers featuring lap splices near the foundation were tested. Three specimens representing a boundary region of the previously specimens are presented in this dissertation.
The test specimens subjected to the same cyclic load history only differ regarding the transversal reinforcement. Particular attention is given to the slippage between the rebars and the steel strains in the lap splice zone.
These tests along with the results of future specimens intend to create a database that will allow to validate the future expression mentioned above.
III
Resumo
Grande parte das pontes existentes foram construídas antes dos atuais códigos de dimensionamento o que significa que particularmente em países onde seja admitida uma sismicidade moderada e onde outro tipo de cargas tais como as cargas gravíticas, do vento ou da neve assumem maior importância, o risco sísmico pode ter sido subestimado no passado. Experiências passadas mostram que detalhes construtivos como emendas em potenciais zonas de rotulas plásticas bem como baixos rácios de armadura transversal podem levar a uma pequena capacidade de deformação dos pilares existentes e como consequência levar grandes danos estruturais.
O desempenho de elementos de betão armado com emenda foi extensivamente estudado no passado. No entanto, a maior parte dos autores focaram-se na resistência das emendas enquanto que a sua capacidade de deformação foi desprezada sendo apenas foco de maior interesse mais recentemente.
A presente dissertação está integrada num projeto de investigação desenvolvido pela École Polytechnique Fédérale de Lausanne que tem o objetivo final de apresentar uma expressão que consiga prever o comportamento das emendas, em particular a capacidade de deformação em elementos de betão armado. Esta tese apresenta uma campanha experimental referente ao desempenho das emendas quando carregadas ciclicamente.
Esta campanha experimental dá continuidade as campanhas experimentais apresentadas por Bimschas (2010) e Hannewald et al. (2013), onde foram testados três pilares com emendas perto da fundação. Nesta dissertação vão ser apresentados três espécimes representativos do extremo dos pilares acima referidos.
Os espécimes sujeitos ao mesmo carregados cíclico apenas diferem na quantidade de armadura transversal. Particular atenção vai ser dada ao deslizamento e às extensões na armadura longitudinal na zona da emenda.
Estes testes, conjuntamente com os resultados de futuros espécimes, têm como principal objetivo criar uma base de dados que permita validar a futura expressão acima referida.
v
Contents
Acknowledgements ... III Abstract ... I Resumo ... III
1 Introduction ... 1
1.1 Motivation ... 1
1.2 Objectives of the Study ... 3
1.3 Outline of the Dissertation ... 4
2 Literature Review ... 5
2.1 General Introduction ... 5
2.2 Post-Earthquake Field Observations ... 8
2.2.1 Columns ... 8
2.2.2 Walls ... 10
... 11
2.3 Review of Past Experimental Campaigns ... 12
2.3.1 Beams and Columns ... 12
2.3.2 Walls ... 14
2.4 Factors Affecting Strength and Deformation Capacity of Lap Splices ... 17
2.4.1 Splice Length and Bar Diameter ... 17
2.4.2 Concrete cover ... 18
2.4.3 Transversal Reinforcement... 18
2.4.4 Loading History ... 19
2.4.5 Moment Gradient ... 19
2.5 Simplified constitutive models for Lap-Splices ... 20
2.5.1 Lap-Splice Strength ... 20
2.5.2 Lap-Splice Displacement ... 22
3 Experimental Test Campaign ... 27
3.1 Background ... 27
3.2 Characteristics of the test specimens ... 29
3.3 Material Proprieties ... 31
3.3.1 Concrete ... 31
3.3.2 Steel ... 31
3.4 Load History ... 32
vi
3.6 Test Observations ... 38
3.6.1 LAP-P1 ... 38
3.6.2 LAP-P3 ... 41
3.6.3 LAP-P2 ... 43
3.7 Test Results ... 45
3.7.1 Load Step to ∆ = 𝟑 𝒎𝒎 ... 48
3.7.2 Load Step to ∆ = 𝟔 𝒎𝒎 ... 57
3.7.3 Load Step to ∆ = 𝟗 𝒎𝒎 ... 66
3.7.4 Load Step to ∆ = 𝟐𝟏 𝒎𝒎 ... 73
3.7.5 During second cycle to ∆ = 𝟐𝟒 𝒎𝒎, LAP P1 failure... 75
3.8 Summary of Results and Comparison with available models ... 80
4 Conclusions and Outlook ... 83
vii
List of Figures
Figure 1.1: Seismic Risk Zones according to SIA 261 (SIA.SIA261, 2003) ... 2
Figure 2.1-Representation of the transfer of forces; (a) bond force on bar and (b) components on concrete ... 6
Figure 2.2: Failures Modes; (a) pullout failure and (b) splitting failure (ACI-ASCE, 2012) ... 6
Figure 2.3: Physical Model of splitting failures ... 7
Figure 2.4: Poor performance of columns during the Northridge Earthquake 1994 (Melek, et al., 2003) ... 8
Figure 2.5: Field Observations after Turkey Earthquake in 1999 (Melek, et al., 2003; Sezen, et al., 2002) ... 9
Figure 2.6: Reinforcement Detail at around 17.5 m height (Kim, et al., 2012) ... 11
Figure 2.7: Lap splice damage on a chimney during Niigata-ken Chuetsu-Oki earthquake (Kim, et al., 2012) ... 11
Figure 2.8: (a) Test Setup, (b) Unretrofitted Columns and (c) Strengthened Column (Aboutaha, et al., 1995) ... 13
Figure 2.9: Stress distribution along the splice length ... 17
Figure 2.10: Qualitative representation of the moment-curvature relation for all the above-mentioned plastic hinge models (Tarquini, et al., 2017) ... 24
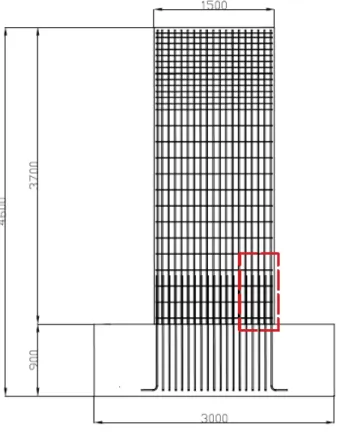
Figure 3.1: Typical wall tested by Bimschas (2010) and Hannewald et al. (2013) and representation of suggested test specimen ... 27
Figure 3.2: Comparison between (a) Test Setup Angeli et al. (2013) and (b) Test Setup of the author ... 28
Figure 3.3: Test specimen model and its reinforcement ... 29
Figure 3.4: Force-displacement (a) tension and (b) compression ... 32
Figure 3.5: Loading history Graph ... 33
Figure 3.6: Test setup 3D view ... 35
Figure 3.7: Instrumentation, (a) LEDs pattern and (b) LVDTs base length ... 37
Figure 3.8: Sketches of Lap-P1 after failure ... 40
Figure 3.9: Pictures at different load levels Lap-P1; (a) Vertical splitting cracks that appear when achieved the yielding of rebars; (b) Splitting cracks along the length of the splice; (c) Last cycle before failure ... 40
Figure 3.10: Sketches of Lap-P3 after failure ... 42
Figure 3.11: Pictures at different load steps Lap-P2; (a) Small vertical splitting at 2 mm of displacement; (b) Splitting cracks at the Northeast side; (c) Picture at the end of the cycle to 12 mm of displacement ... 42
Figure 3.12: Sketches of LAP-P2 after failure ... 44
Figure 3.13: Pictures at different load levels Lap-P3; (a) Vertical Splitting cracks near top splice; (b) Failure of the first lap splice at the first cycle to 6 mm; (c) Failure of the remaining lap splices trough vertical splitting cracks... 44
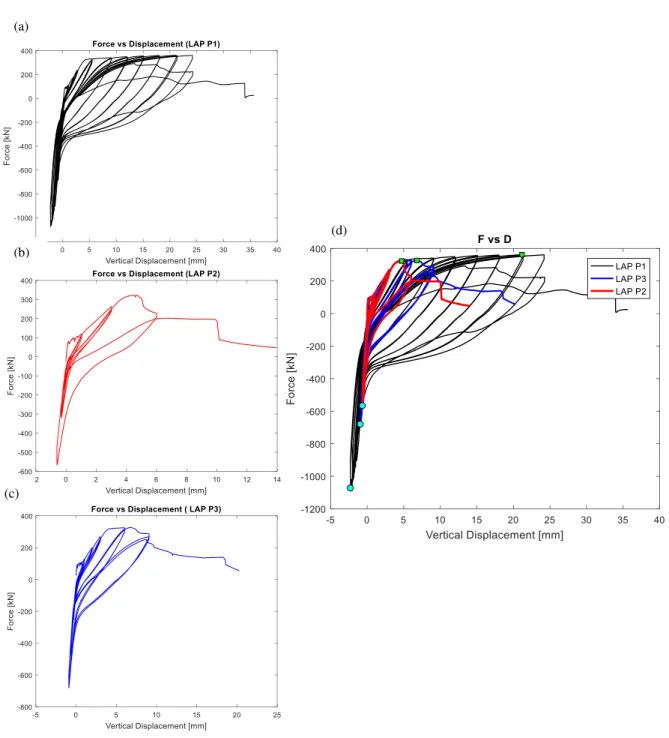
Figure 3.14: Force Displacement Relation in (a) LAP P1, (b) LAP P2, (c) LAP P3 and (d) comparison between the three specimens ... 46
Figure 3.15: Maximum values of (a) Strength and (b) Strain for each specimen ... 47
Figure 3.16: Strains of Lap P1 after load step to 3 mm ... 48
Figure 3.17: Slip LAP P1 after load step to 3 mm ... 49
Figure 3.18: Strains LAP P2 after load step to 3 mm... 50
Figure 3.19: Slip LAP P2 after load step to 3 mm ... 51
viii
Figure 3.21: Slip LAP P3 after load step to 3 mm ... 53
Figure 3.22: Picture of the crack on the top of the splice region at the end of load step to 3 mm .... 55
Figure 3.23: Strains of Lap P1 after load step to 6 mm ... 57
Figure 3.24: Slip LAP P1 after load step to 6 mm ... 58
Figure 3.25: Strains of Lap P2 during load step to 6 mm at peak strength ... 59
Figure 3.26: Slip LAP P2 during load step to 6 mm at peak strength ... 60
Figure 3.27: Strains of Lap P2 after load step to 6 mm ... 61
Figure 3.28: Slip LAP P2 after load step to 6 mm ... 62
Figure 3.29: Strains of Lap P3 after load step to 6 mm ... 63
Figure 3.30: Slip LAP P3 after load step to 6 mm ... 64
Figure 3.31: Strains of Lap P1 after load step to 9 mm ... 66
Figure 3.32: Slip LAP P1 after load step to 9 mm ... 67
Figure 3.33: Strains of Lap P3 during load step to 9 mm at peak strength ... 68
Figure 3.34: Slip LAP P3 during load step to 9 mm at peak strength ... 69
Figure 3.35: Strains of Lap P3 after load step to 9 mm ... 70
Figure 3.36: Slip LAP P3 after load step to 9 mm ... 71
Figure 3.37: Strains of Lap P1 after load step to 21 mm ... 73
Figure 3.38: Slip of Lap P1 after load step to 21 mm ... 74
Figure 3.39: Strains of Lap P1 at failure ... 75
Figure 3.40: Slip of Lap P1 at failure ... 76
ix
List of Tables
Table 2.1: Resume of the main characteristics of experimental tested walls with lap splices ... 16
Table 3.1: Characteristics of Test Specimens of first test series ... 30
Table 3.2: Concrete proprieties ... 31
Table 3.3: Steel proprieties... 31
Table 3.4:Summary of Results ... 81
xi
List of Symbols
𝐴𝑏 Single Spliced bar area
𝐴𝑠𝑡 Area of stirrups
𝐴𝑡𝑟𝑥 Area stirrups in x
𝐴𝑡𝑟𝑦 Area stirrups in y
𝑏 Section width
𝑐𝑏 Clear cover between the longitudinal reinforcement and the bottom face
𝑐𝑠𝑖 Clear distance between longitudinal reinforcement
𝑐𝑠𝑜 Clear cover between longitudinal reinforcement bar and the side face
𝐸𝑐Concrete Young’s Modulus
𝐸𝑠Steel Young’s Modulus
𝐹𝑠𝑝𝑙𝑖𝑡𝑡𝑖𝑛𝑔 Splitting force
𝐹𝑠𝑡𝑖𝑟𝑟𝑢𝑝 Force carried out by a stirrup
𝑓𝑐𝑡 Concrete Tensile Strength
𝑓𝑦 Steel yield stress
𝑓𝑢 Steel ultimate Stress
𝑓𝑢,𝑙𝑠 Equivalent ultimate stress in lap splices
𝑓𝑦,𝑙𝑠 Equivalent yielding stress in lap splices
𝑓𝑠,𝑙𝑝 Lap splice Stress
𝑓′𝑐 Concrete compressive strength
𝐿𝑠 Shear Span of RC member
𝑙𝑠 Lap splice length
xii
𝑁𝑙 Number of stirrup legs
𝑛 Number of bars being developed in a splice
𝑛𝑖 Number of cycles per load step
𝑠 Spacing between stirrups
𝑅 Strain hardening parameter
𝛾𝑐𝑐 Concrete specific weight
𝛾𝑠Steel specific weight
𝜀𝑐𝑐 Concrete strain at peak compression stress
𝜀𝑦,𝑙𝑠 Equivalent yielding strain in lap splices
𝜀𝑦 Steel yield strain
𝜀𝑢 Steel ultimate strain
𝜀𝑢,𝑙𝑠 Equivalent ultimate strain in lap splices
𝜂 Number of load steps
𝜂𝑡𝑜𝑡𝑎𝑙 Total number of load steps
𝜌𝑤 Confining reinforcement ratio
𝜌𝑥 Confining reinforcement ratio in x
𝜌𝑦Confining reinforcement in y
𝜎𝑠𝑡 Stress in Stirrups
∅𝐿
Longitudinal Reinforcement Diameter
1
1
Introduction
1.1
Motivation
The occurrence of earthquakes is still an unpredictable phenomenon. Their occurrence cannot be predicted neither as regards to time, magnitude nor location. To overcome this randomness, it is assumed a certain return period, i.e., an average period of time between two seismic events in a given region. This leads to a distinction between regions in accordance with their return period. Thus, regions with high risk of a seismic event have a smaller return period. On the other hand, longer time without any significant seismic event means a low risk region.
Switzerland is considered a region with a low to moderate seismicity. But even if the earthquake damage in regions with moderate seismicity is not often associated to a life safety hazard, the economic and social damage can be very harmful. However, the low probabilities for seismic events in Switzerland led to a disregard of the importance of this hazard while others more frequent loads like for example wind had a greater importance on the design codes.
The first Swiss Code that included seismic provisions was released in the year of 1970, (SIA160, 1970). To define a seismic event, the code adopted a maximum peak ground acceleration between 0.02𝑔 and 0.05g, according to the importance of the structure. The maximum peak acceleration was increased in 1989 when a new generation of codes was established. Different peak ground-accelerations are distinguished using a map of different seismic zones.
2 According to Bimschas (2010) about 90 % of all bridges in Switzerland were constructed before 1990, half of those between 1970 and 1989 and the rest before that date. Therefore, it can be assumed that a large amount of the Swiss bridge population do not feature adequate seismic construction details and therefore it is not capable of sustain the modern codes demands.
Although in modern codes lap splices are no more accepted in the inelastic regions of RC members, there are a large number of published studies (Lowes, et al., 2012; Hardisty, et al., 2015; Sritharan, et al., 2014) showing that longitudinal rebars of many bridge piers are spliced at the base of the column, i.e., in the zone where a plastic hinge is expected to developed.
Experimental tests backed up by field reports shown that the presence of lap splices in RC members may lead to a poor behavior of the member and especially if located in the high deformation region and poorly detailed.
Most of the already published research focused mainly the strength capacity of lap splices while the deformation capacity of this construction detail was just addressed in a few of more recent papers. The information about the influence on the deformation capacity of members with lap splices, particularly on RC walls, is still scarce.
Trough experimental campaigns on RC walls, Bimschas (2010) and Hannewald et al. (2013), demonstrated that splicing the longitudinal reinforcement near the plastic hinge region leads to a significant reduction of
3 their displacement capacity. Furthermore, the authors claim that the transversal reinforcement, the splice length and the loading history have a significant importance in the response of the member.
While the transversal reinforcement was assumed as the most critical factor on the response of lap splices, a small splice length will not be able to effectively distribute the strength along its length and a cyclic loading have proved to be much more detrimental to lap splices than repeated loads.
More recently, Tarquini et al. (2017) proposed a model to predict the monotonic response of lap splices for RC walls where it considers the transversal reinforcement and splice length. However, this model was only validated against experimental data on experimentally tested RC walls piers and is only valid for monotonic load, not considering cyclic or reversing loading.
A constitutive model for the average behavior of lap splices, under cyclic loading, is still lacking in the literature. Experimental data are required to establish the cyclic behavior of lap splices, including the effects of the splice length and the transversal reinforcement.
1.2
Objectives of the Study
The main goal of this dissertation is to plan and carry out an experimental campaign to better understand the expected performance of RC members with lap splices when subjected to cyclic loading.
The specimens presented on this dissertation allow to study in more detail the expected behavior of lap splices in the event of an earthquake. In particular, the experimental campaign presented in the present dissertation was conducted in order to examine the influence of the transversal reinforcement ratio on the displacement capacity of lap splices.
Future tests regarding the former experimental campaign will allow to study the influence of another features that also effect the displacement capacity of this construction detail and they will allow to create an important database that is currently missing.
4
1.3
Outline of the Dissertation
Before starting addressing the experimental campaign is important to understand the behavior of lap splices. The chapter 2 present a literature review about this construction detail.
First, in section 2.1, a theoretical introduction of the lap splice strength is presented, explaining its force transfer mechanism, and its failure modes.
Afterwards, in section 2.2, Post-Earthquake field observations are presented. This section presents different problems seen in RC members after recent seismic activities where lap splice played an important role.
As the present dissertation addresses an experimental campaign, the section 2.3 will present the past experimental campaigns that focused on the same subject. This summarizes the different obtained results from the past experiences in beams, columns and walls and can be useful to have an idea of the past studies and the work that is still missing regarding the lap splice displacement.
The following section 2.4, presents a summary of the factors that most significantly influence lap splices and the correlation that the formers have with each other. The chapter 2 is finished with a sub-section where the past simplified constitutive models for lap splice strength and displacement are presented.
After that the experimental campaign will be introduced. The sections 3.1, 3.2 address the background of the campaign and the characteristics of the test specimens respectively. The following sections, 3.3, 3.4 and 3.5, respectively, indicate the material proprieties, the load history and to give more detailed information about the test setup and instrumentation.
In the sections 3.6 and 3.7 test observations and the test results of each specimen of this experimental campaign are represented. Lastly, in section 3.8 a summary of the results of the test specimens is presented.
5
2
Literature Review
2.1
General Introduction
The most convenient location, for constructive reasons, for a lapped spliced in a column is immediately above the foundation or above the floors in the case of a multi-story building. This location coincides with the maximum moment along the height of the column. For wind loading the existing codes rules can guarantee a satisfactory splice performance since no large inelastic demands will be reached. However, in case of severe ground shaking, the resulting moments can differ significantly from the ones obtained from the standard elastic analysis established in the codes for lateral seismic loading.
Although the force transfer mechanism between concrete and rebars have been extensively studied in the past years the experiments were mostly centered on monotonic loads while bond cyclic loads received minor attention. These cyclic loads can be divided into two categories, low cycle, and high cycle. The former, concerning both earthquakes and wind loadings, has few cycles at a bigger intensity while the latter, has more cycles at a low bond intensity (e.g. fatigue load).
Similarly, bond behavior can be further subdivided according to the type of stress applied. One is unidirectional loading, which implies that the bar stress does not reverse from tension to compression during a load cycle and the other is regarding when the rebar is alternatively subjected to tension and compression and it is defined as reversed/cyclic loading. Earthquake loading is typically a cyclic loading. (ACI-ASCE, 2012)
Since concrete is a non-homogeneous material neither is expected to be free of internal cracks it can be assumed different levels of strength at the top, bottom or side of the lap splice zone. Additionally, past experimental research have shown that local stresses can be four or five times higher than the average stresses along the bond. However, the currently required development lengths are based on a uniformly distributed bond stress assumption over the entire length of the rebar.
6
Figure 2.1-Representation of the transfer of forces; (a) bond force on bar and (b) components on concrete
These forces can be related directly to the different types of bond failures. The first, pull out failure, occurs due to the shearing of the concrete between the ribs and it is likely to happen when the concrete cover and the transverse reinforcement prevent the splitting. The resistance depends firstly on the concrete strength and in the pattern and geometry of the rebar while the size and spacing of the transverse reinforcement also plays an important role by keeping the slitting cracks small. (See figure 2.2 (a))
However, after the slip of the longitudinal reinforcement some resistance is still maintained due to friction and the interface shear.
Figure 2.2: Failures Modes; (a) pullout failure and (b) splitting failure (ACI-ASCE, 2012)
(a) (b)
7 The second type of bond failure is the splitting failure and is depicted in figure 2.2 (b). This type of failure takes place when concrete cover or confinement is insufficient to attain the entire pull out strength. As said above, this type of failure is due to radial stresses which induce tension stresses to the surrounding concrete and hence, small lateral cracks appear.
This type of failure generally manifest for bars with three or less diameters of concrete cover and thus it’s most likely to happen for usual RC structures than the pull-out failure.
The number and configuration of the bars will establish the orientation of the splitting cracks. For members featuring bars with a concrete cover less than half the bar spacing splitting cracks will occur parallel to the bar and correspondently perpendicular to the surface (face-splitting). For bars in which the concrete cover is higher than twice the bar spacing, splitting cracks tend to appear in the plane of the reinforcement (side-splitting). (ACI-ASCE, 2012)
8
2.2
Post-Earthquake Field Observations
This section discusses the damage mainly caused by lap splices on RC members seen in several post-field observations. The section will be divided into two sub-sections, the first addresses the visible damage caused by the presence of lap splices into columns while the second treats the damage on lap splice regions of RC walls.
2.2.1 Columns
In this sub-section damage in the lap splice region observed in the earthquakes of Northridge, 1994 and Turkey 1999 is summarized. (Melek, et al., 2003; Sezen, et al., 2002)
Consequent of the Northridge earthquake shear and spliced failures in reinforced concrete columns could be seen in particular in older buildings. In figure 2.4 (a) is presented an exterior column of a one story parking structure with a 450 mm square cross section and 20∅𝐿 splice length.
The post-earthquake reports state that the cross section of the interior columns was posteriorly increased in accordance with the initial project, however, no apparent changes were made on the exterior columns. Damage in the column indicated that slip occurred along the splice together with the spalling of the concrete.
(a) (b)
9 Following this seismic event, it also was found more damaged columns in an eight-story parking structure represented in figure 2.4 (b). In this case splice damage was limited due to the use of shear walls which limited the lateral drift imposed on the columns (Melek, et al., 2003).
Another example of an extensive damage on reinforced concrete columns occurred during the 7.4 magnitude earthquake that struck northwestern Turkey on August 17, 1999.
Post-field observations shown that the behavior of splices may have played a role on the collapse of buildings in 1999, Turkey. Figure 2.5 (b) shows a typical beam-column connection for a six-floor building and the failure surface indicates that longitudinal bars of the column were inadequately anchored and probably they were pulled out at relative low load levels. (Melek, et al., 2003)
The reports made after the fields observation show that the Turkish earthquake code provisions were not followed in detailing reinforced concrete columns, especially in potential plastic hinge zones at the end of the columns. As shown by figure 2.5 (a) lap splices were typically made at the column bottom (floor or foundation interface) without the needed confinement to perform in a ductile way. The reports have also showed that the buildings that featured shear walls as structural elements generally didn’t manifest much damage under the seismic event. (Sezen, et al., 2002)
In summary, column damage linked with the poor behavior of splices have been often observed in recent earthquakes with the damage ranging from minor cracking to collapse.
Figure 2.5: Field Observations after Turkey Earthquake in 1999 (Melek, et al., 2003; Sezen, et al., 2002)
10
2.2.2 Walls
In the reports by Birely (2012), Song et al. (2012) and Sritharan et al. (2014) is possible to find an extensive database including the damages presented on RC walls associated with lap splices that occurred during the past years. The authors observed that the majority of the damage was located near the interface between floors where the splices of the longitudinal reinforcement were made.
Focusing on the most recent events, damage to more than one hundred high-rise RC walls buildings resulting from lap splice failures was recorded in the Chile earthquake of February 2010.
Song et al. (2012) observed lap splice failures on a collapsed building. Song et al. (2012) claims that even if the cause that led to a collapse of an entire building can be always debatable, longitudinal bars were cut off in the lap splice zone which indicates a clear lap splice failure.
Also the 2010 Canterbury earthquake revealed problems in the lap splice zone. Sritharan et al. (2014) reported a concentrate damage above the lap splice region in RC walls of a seven-story building. Although the lap splice wasn't located in the plastic hinge region the damage can be explained by the poorly detailed transversal reinforcement and the scarcity of stirrups between the two layers of web reinforcement.
Lap splices also contributed to the failure of a chimney. During the Niigata-ken Chuetsu-Oki earthquake in Japan a chimney with 58 m height failed. Figure 2.7 shows the damage on the chimney at the lap splice zone at approximately 17.5 m from the ground level.
11
Figure 2.6: Reinforcement Detail at around 17.5 m height (Kim, et al., 2012)
(a) (b)
12
2.3
Review of Past Experimental Campaigns
On this sub-section will be presented the recent experimental studies that address the behavior of lap splices, under monotonic and cyclic loading, on beams, columns and walls.
The goal of this sub-section is to report the characteristics of the past experimental tests as well as the obtained results, compiling a data which can describe the member behavior and how this one is modified by the presence of lap splices.
2.3.1 Beams and Columns
Experimental tests on beams and columns have been extensively carried out along of the past years. The first extensive campaign regarding the influence of lap splice in RC beams was at the end of the 1970s at Cornell University. (Sivakumar, et al., 1982; Gergely, et al., 1980)
The former campaign was particularly important because the influence of lap splices under repeated and reversed loading was approach for the first time and it was also the first one which state the importance of the stirrups along the splice. The study showed that it is possible to design lapped splices to sustain repeated loading beyond yield if closely spaced stirrups are used and if the splice length has an appropriate length. The location of the stirrups along the splice length was also studied and the results revealed differences between monotonic and cyclic loading. (See sub-section 2.4.3)
Based on the results from this campaign some authors proposed design procedures and expressions to determine the amount of transversal reinforcement needed to resist to a larger number of reversed cyclic loads. These recommendations were corroborated by the observations of Sparling and Rezansoff (1986) where the authors affirmed that the provisions for the seismic application increased considerably the ductility of the specimens.
The first experimental tests on columns with deficient lap splices was just reported later. (Chai, et al., 1991; Aboutaha, et al., 1995)
Both, Chai et al. (1991) and Aboutaha et al. (1995), proposed the reinforcement of RC concrete columns with inadequate lap splices and poor transversal reinforcement through steel jackets (see figure 2.8). Theirs experimental campaigns were important because columns were tested for the first time under cyclic lateral loads.
13
Figure 2.8: (a) Test Setup, (b) Unretrofitted Columns and (c) Strengthened Column (Aboutaha, et al., 1995)
More recently, Pam et al. (2010), studied the differences of the locations of lap splices on the flexural strength and ductility of RC columns. The experimental campaign concluded that although the specimens that feature lap splices in the critical region had a largest strength than the ones with a continuous longitudinal reinforcement, their ductility capacity decreased. These results will be further discussed in sub-section 2.4.
14
2.3.2 Walls
Experimental tests of lap splices on the longitudinal reinforcement of walls were only recently reported. The main characteristics of all the tested walls presented in this sub-section are listed in table 2.1.
The first experimental campaign regarding the behavior of RC walls with lap splices was just reported in 2003, by Paterson and Mitchell. Two non-retrofitted RC walls were tested, one with lap splices in the critical region while the other had the lap splice outside the critical region (W1 and W2).
The test specimen that featured the lap splice near the foundation exhibit a poor ductility failing soon after the yielding of the rebars. The lap splice failure was evident by the vertical splitting cracks along the length of the splice. The other specimen, that had the lap splice outside of the critical zone, showed a ductility response three times bigger than the specimen with the longitudinal reinforcement spliced near the critical zone. A large amount of cracking appeared at the base of the wall damaging this area and leading to a brittle tensile failure of one lap splice, resulting in a large drop in the capacity of the specimen.
At 2008 in McMaster University, Canada, Elnady (2008) carried out an experimental campaign where two RC walls with lap splices where tested (CW2 and CW3)
Both walls were identical but they were subjected to different horizontal loads that imposed different moments along the member. The horizontal actuators were controlled so that the moment to shear ratio (M/VL) was held constant at 5 and 2.25 for each specimen.
The first test specimen, subjected to horizontal forces, showed flexural cracks at the bottom of the wall at the very first loading cycle, as the horizontal loads continue to increase the cracks on the bottom spread to near mid-height and a new horizontal crack developed at the top end of the splice. Finally, the wall failed prematurely due to bond slip of the lap splice. The yielding of the longitudinal reinforcement was not achieved. The second wall showed a higher deformation capacity, the first cracks just developed at a value of drift five times bigger than the drift achieved at failure in the former wall. While loading the cracks, inclined at 45°, opened up and extended from corner-to-corner of the wall in both diagonal directions. The wall finally failed due to bond slip of the lap splice.
After, Bimschas (2010) tested one other RC wall with lap splices at the base (VK2). The damage in the wall began with side splitting cracks in the tensile edge of the wall and after by the development of a large bond crack with the same length as the splice which cause a drop in the flexural strength of the member. With the increasing of the load the bond failure of the splices occurred causing a progressive degradation of the cyclic strength of the member.
15 The next experimental campaign addressing lap splices in RC walls was presented by Layssi et al. (2012). The campaign counted with two specimens that feature lap splices near the plastic hinge zone (W1* and W2*). Both specimens revealed a non-ductile response due to a brittle side splitting of the external lap splice prior to yielding that led to a significant drop in the strength capacity. Furthermore, neither of the specimens achieved the predicted flexural capacity.
Birely (2012) reported the following experimental campaign focused on RC walls. One specimen with lap splice at its base was studied (PW2) and revealed a behavior similar to the formers specimens already mentioned on this sub-section. Cover spalling appeared above the splice region at an early stage of the test followed by the exposition of the longitudinal reinforcement which led to the buckling of the rebars. Increasing the applied forces, the concrete crushed where buckling occurred and the damage extended to the web of the wall propagating afterwards to the top of the web splices.
A paper presented by Aaleti et al. (2013) reported another experimental campaign regarding structural RC walls featuring lap splices near the base. Only one specimen with this construction detail was tested (RWS). The damage on the specimen was mainly visible by the cracks above the lap splice region and in the wall base, a strength degradation appeared probably due to slipping in the splice region. With the demand, bond degradation progressed increasingly.
More recently, four large scale RC walls were tested by Villalobos and Pujol (2014) (60-C, 40-C, W-60-N and W-W-60-N2). The specimens intended to represent the configuration of structural walls featuring lap splices that have failed in the Earthquake of Chile, 2010. The behavior of the four specimens was substantially identical. First, side splitting cracks appear near the splice ends being widest near the base. The loss of strength due to the bond degradation was clear by the force displacement response of the member. At the final imposed displacement, one specimen showed vertical cracks along the length of the splice.
The last experimental campaign known by the author was reported by Almeida et al. (2017) at École Polythechnique Fédérale de Lausanne. The experimental test only featured one RC wall with lap splices at the plastic hinge region (TW3). The behavior of the specimen was governed by signs of damage in the lap splice region. At an earlier loading stage, a first face splitting vertical crack appear, with the increasing of the imposed displacement, some side splitting cracks showed up extending throughout the entire lap splice length. Later, wide horizontal cracks above and below the splice developed. In the end of the test, it was clear that the damage concentrates essentially in the lap splice region while the remaining part of the member remained intact.
16
Table 2.1: Resume of the main characteristics of experimental tested walls with lap splices
Test
Specimen Reference Scale 𝒍𝒔 (mm) ∅𝑳 (mm)
Number of splices
𝑳𝒔 (mm)
Wall Length
(mm)
W1 (Paterson, et
al., 2003)
1:1 900 25 2 3250 1200
W2 1:1 900 25 2 3750 1200
CW2 (Elnady,
2008)
1:3 360 16 2 5000 1000
CW3 1:3 360 16 2 2250 1000
VK2 (Bimschas,
2010) 1:2 600 14 4 3300 1500
VK4 (Hannewald,
2013)
1:2 600 14 4 3300 1500
VK5 1:2 600 14 4 4500 1500
W1* (Layssi, et
al., 2012)
1:1 600 20 2 3250 1200
W2* 1:1 600 20 2 3250 1200
PW2 (Birely, 2012) 1:3 609 13 2 6710 3048
RWS (Aaleti, et al., 2013) 1:2
19 2
2 6096 2286
29 2
W-60-C
(Villalobos, et al., 2014)
1:1 1520 25 2 3660 1520
W-40-C 1:1 1020 25 2 3660 1520
W-60-N 1:1 1520 25 2 3660 1520
W-60-N2 1:1 1520 25 2 3660 1520
17
2.4
Factors Affecting Strength and Deformation Capacity of Lap Splices
The prediction of the behavior expected by RC members with lap splices is always a difficult task since both the lap splice strength and strain depend largely on the correct identification of its governing factors. On the following sub-section, a summary of the factors that most affect the strength and strain of lap splices will be presented.
2.4.1 Splice Length and Bar Diameter
As seen in sub-section 2.1, the transfer of forces between the rebars is made along the entire splice length. Thus, the influence of a small splice length can be easily understood. The smaller the splice length, the higher is the value of the stresses along its length. Consequently, a small length of the splice can lead to peak stresses that in turn can lead to an important reduction of the ductility and member strength.
However, a constant increasing of the splice length would not inherently increase the splice strength. In fact, as the length of the splice increases, the effectiveness of the splice length decreases, the assumption of a uniform distribution of stresses is properly accurate if the lap splice is short but with the increasing of the splice length this idea becomes less valid. (Chinn, et al., 1955; Fergunson, et al., 1971; Canbay, et al., 2005).
Figure 2.9 represents the stress distribution along the splice length. The ineffectiveness into increasing the splice length can be explained by the tendency of bond stresses to concentrate near the region of the end of the splice instead of an approximately constant distribution. (Canbay, et al., 2005)
Furthermore, in a poorly confined member adding splice length is of little value. Paulay (1982) reported that in long splices not well confined longitudinal splitting cracks will propagate along the splice length, reducing progressively the length over which the force from one bar can be effectively transmitted to the other.
18 The effectiveness of the splice length is also strongly dependent on the bar size. Almeida et al. (2017) pointed out that bond stress concentration is more pronounced for smaller diameters and hence a ratio between the splice length and the bar diameter should be taken into consideration. However, several researches showed that increasing the diameter of the bar will not increase the splice strength and can lead to a decrease of the deformation capacity of the splice. (ACI-ASCE, 2012)
Therefore, the splice length is relative and must be adapted to the bar diameter. For this reason, a given splice can be considered long for a given bar diameter while the same length can be considered short for bars with larger values of bar diameters.
2.4.2 Concrete cover
As addressed previously one of the failure modes for RC members with lap splices is related with the development of splitting cracks. Although the concrete cover can be directly linked to the formation of cracks it is still not clear the influence of this on the deformation capacity of the member.
The concrete cover can largely influence the failure mode. When the concrete cover is smaller than 2.5 bar diameters, a splitting tensile failure is likely to happen at a shorter anchorage length than the one needed for sustain pull out failure. (ACI-ASCE, 2012)
The abovementioned report also claim that the influence of the concrete cover is even more important for cyclic loads since more severe cracking will likely occur.
2.4.3 Transversal Reinforcement
The effect of transversal reinforcement have been highly studied in the past years and its influence both on strength and strain capacity of lap splices is particularly important. The importance of the transversal reinforcement is even more highlighted by the current codes that only allow lap splices in the plastic hinge region if a minimum amount of transverse reinforcement is provided.
The transversal reinforcement is particularly important after splitting cracks taken place. As seen in sub-section 2.1, tensile stresses will be applied to the surrounding concrete leading to transversal cracks and hence, posteriorly to splitting, the tensile stresses will be sustained by the transversal reinforcement.
Several researches showed that a well confined splice can achieve a displacement ductility at least two times higher than the displacement achieved by specimens with less transversal reinforcement ratio when subjected to many cycles of repeated load. (Gergely, et al., 1982; Sparling, et al., 1986; Lukose, et al., 1982).
Although well detailed lap splices can increase the flexural strength of the member, an excessive amount of transversal reinforcement can decrease significantly its ductility performance. A large amount of transversal reinforcement can lead to a failure mechanism that relocates the plastic hinge on the top of the splice and concentrating the damage on that zone. (Pam, et al., 2010; Lowes, et al., 2012).
19 increasing resulting in large steel strains which can lead to a possible fracture of the longitudinal reinforcement. (Almeida, et al., 2017; Paulay, 1982)
Past researchers reported that also the layout of the transversal reinforcement plays a role in the strength and strain of lap splices. While in the past Gergely et al. (1982) stated that multiple stirrups at splice ends are more effective for monotonic loads, for cyclic loads, yield penetrate in the splice and it will progress at an accelerated rate if internal confinement along the splice length is poor. (ACI-ASCE, 2012)
2.4.4 Loading History
The difference between monotonic, repeated and reversed load has been a case of study for the past years. Many experimental campaigns have proved that reversed cycle loads are more detrimental to splice performance than are repeated loads. This comparison is made by the amount of cycles that the same test specimens need to reach failure in the both loading protocols.
Gergely (1982) showed through experimental tests in beams that repeated loading and the number of load cycles do not have a pronounced effect on the performance of lap splices if the load level is below 75% of the monotonic capacity of the member.
According to Sparling at al. (1986), cyclic loading will origin an increase of stiffness deterioration, mainly due to cracking and crushing of the concrete, bar slip and softening of the reinforcement, which will reduce the deformation capacity of the RC member when compared to monotonic and repeated tests.
Although the failure modes for both loading cases are essentially the same, both authors agreed that the number of cycles to failures is much less when in the presence of reversed load cycles.
2.4.5 Moment Gradient
The moment gradient in relation with lap splices was not extensively studied in the past. When the effect of moment gradient was firstly addressed, some authors claimed that the effect of the former did not have relevance enough to justify its inclusion on the developed expression for the bond strength. (Orangun, et al., 1977)
The influence of the moment gradient just became clear on the experimental campaign at Cornel University by Lukose et al. (1982). Reported by the authors the test results clearly demonstrate the increasing of the performance of the test specimens in the presence of shear in comparison with the specimens loaded with a constant moment along the splice. With a uniform moment, the damage progresses from both ends of the splice and hence, enhancing its detrimental interaction. Adding shear forces on the splice, the failure will begin at the extremity with the highest moment and the interaction between the two splices is reduced.
However, the same authors claim that the shear forces aggravate the damage on the region of the splice where is present the high moment. Extensive transversal cracking take place due to i) the change in the stiffness beyond the splice end; ii) stress concentrations at the bar ends; and iii) due to flexural shear cracks.
20 beams in the experimental campaigns of Richter (2012) and Hardisty et al. (2015). The authors claimed that the results showed that the beams tested under constant moment had splice failures while in the structural walls tested by Villalobos et al. (2016) no splice failures occurred. It was therefore concluded by the authors that the response of the splices can differ with respect to the scale of the test specimens.
2.5
Simplified constitutive models for Lap-Splices
Modelling the lap splice behavior is a challenging task since this regard the accurate modelling of the non-linear behavior on the interface between the two rebars. As have been mentioned previously, to model the behavior of lap splices two different methods can be used, i) a force approach, which is interested in estimating the lap splice strength and ii) a displacement approach, is used to predict the displacement capacity of lap splices.
Although the strength of a lap splice has an important part on the assessment of RC members, its deformation capacity cannot be neglected. Furthermore, while the force capacity of lap splices has been rather studied in the past years, for predicting their displacement capacity just few models are available that can accurately represent their deformation ductility.
The following sub-section intends to present the most relevant models to estimate both the lap splice strength as the lap splice displacement available.
2.5.1 Lap-Splice Strength
In the author opinion, the model currently available that predict more accurately the lap splice strength is the model proposed by Canbay and Frosch (2005). The model was chosen among the available formulations because is the only model that accounts for the different lap splice failures, side-splitting and face-splitting (see sub-section 2.1) and it was verified through the results from 203 unconfined and 278 confined beam tests subjected to monotonic loading.
According with Canbay and Frosch (2005) the maximum bar stress can be evaluated:
𝑓𝑠,𝑙𝑝 = 𝐹𝑠𝑝𝑙𝑖𝑡𝑡𝑖𝑛𝑔𝑛𝐴 + 𝐹𝑠𝑡𝑖𝑟𝑟𝑢𝑝
𝑏tan (𝛽)
(2.1)
Where
𝛽 = 20 𝑑𝑒𝑔𝑟𝑒𝑠
𝐴𝑏= 𝑠𝑖𝑛𝑔𝑙𝑒 𝑠𝑝𝑙𝑖𝑐𝑒𝑑 𝑏𝑎𝑟 𝑎𝑟𝑒𝑎
𝑛 = 𝑛𝑢𝑚𝑏𝑒𝑟 𝑜𝑓 𝑏𝑎𝑟𝑠 𝑏𝑒𝑖𝑛𝑔 𝑑𝑒𝑣𝑒𝑙𝑜𝑝 𝑜𝑟 𝑠𝑝𝑙𝑖𝑐𝑒𝑑
To calculate of the splitting force (𝐹𝑠𝑝𝑙𝑖𝑡𝑡𝑖𝑛𝑔) geometrical relations are provided for effective concrete cover
21
𝑐𝑏,𝑒𝑓𝑓 = 𝑐𝑏0.77
√𝑐∅𝑏
𝐿
≤ 𝑐𝑏
(2.2)
𝑐𝑠𝑜,𝑒𝑓𝑓= 𝑐𝑠𝑜0.77
√𝑐∅𝑠𝑜
𝐿
≤ 𝑐𝑠𝑜
(2.3)
𝑐𝑠𝑖,𝑒𝑓𝑓= 𝑐𝑠𝑖0.77
√𝑐∅𝑠𝑖
𝐿
≤ 𝑐𝑠𝑖
(2.4)
𝑙𝑠,𝑒𝑓𝑓 = 𝑙𝑠 53.48
√ 𝑙𝑠
∅𝐿× √𝑓′𝑐
4 ≤ 𝑙𝑠
(2.7)
Where 𝑐𝑏 is the clear cover between the longitudinal reinforcement and the bottom face; 𝑐𝑠𝑖 the clear distance between longitudinal reinforcement bars and 𝑐𝑠𝑜 the clear cover between the longitudinal reinforcement bar and the side face.
With the expressions of the effective cover and effective splice length is possible to model the splitting force depending on the type of failure expected
For side-splitting failure
𝐹𝑠𝑝𝑙𝑖𝑡𝑡𝑖𝑛𝑔 = 𝑙𝑠,𝑒𝑓𝑓[2𝑐𝑠𝑜,𝑒𝑓𝑓+ (𝑛 − 1)2𝑐𝑠𝑖,𝑒𝑓𝑓]6 √𝑓′𝑐
(2.5)
22
𝐹𝑠𝑝𝑙𝑖𝑡𝑡𝑖𝑛𝑔= 𝑙𝑠,𝑒𝑓𝑓[2𝑐𝑏,𝑒𝑓𝑓+ 0.1 (𝑐𝑐𝑠𝑜,𝑒𝑓𝑓
𝑏,𝑒𝑓𝑓 + 0.9)
+ 2𝑐𝑏,𝑒𝑓𝑓(𝑛 − 1) (𝑐𝑐𝑠𝑖,𝑒𝑓𝑓
𝑏,𝑒𝑓𝑓 + 0.9)] 6 √𝑓′𝑐
(2.6)
Where
0.1 (𝑐𝑠𝑖,𝑒𝑓𝑓𝑐 ; 𝑐𝑠𝑜,𝑒𝑓𝑓
𝑏,𝑒𝑓𝑓 + 0.9) ≥ 1.0
(2.7)
For the side-splitting case, the additional force on the failure plane created by stirrups can be formulated as
𝐹𝑠𝑡𝑖𝑟𝑟𝑢𝑝 = 𝑁𝑠𝑡𝑁𝑙𝐴𝑠𝑡𝜎𝑠𝑡
(2.8)
Where 𝑁𝑠𝑡 represents the number of stirrups within the splice length; 𝑁𝑙 number of stirrup legs; 𝐴𝑠𝑡 area of stirrups and 𝜎𝑠𝑡 stress of stirrups.
By opposite, and admitting orthogonal cracks for face splitting the force developed by the stirrups can be formulated as
𝐹𝑠𝑡𝑖𝑟𝑟𝑢𝑝 = 𝑁𝑠𝑡𝑛𝐴𝑠𝑡𝜎𝑠𝑡
(2.9)
However, the presented model has some important limitations. First does not account for the cyclic loading, since the splice strength was obtained by the evaluation of splices under monotonic loading and the beneficial effect of the moment gradient in the lap splice strength is not consider.
2.5.2 Lap-Splice Displacement
Currently few proposals are available to determine the ultimate strain limit of lap splices in RC walls. Furthermore, the existing ones, are used in conjunction with plastic hinge models where are proposed moment-curvature relations to account for the presence of lap splices.
Plastic hinge models can be resumed as a method that assumes that the inelastic curvatures are concentrated in a limited region, within they are linearly distributed and outside of this zone the deformations of the member are accepted as elastic. Thereafter, the global force-displacement response of a structure can be achieved by the moment-curvature relation determined for the section at which the maximum moment occurs.
23 calculated after which a decreasing of the flexural resistance of the member begins. If the yield stress is higher than the maximum equivalent tension, the nominal moment capacity is kept constant up to a curvature corresponding to a compression strain limit of 𝜀𝑐 = 0.002 followed by the failure of the RC member. The idea of adopting compression strain limits is linked with the formation of longitudinal splitting cracks that reduce the concrete resistance in compression and tension. The author claims that after reached the ultimate strain level, a residual moment can be admitted for the member. The former that can be defined by a residual strength that the lap splices can sustain without falling for large slip values.
Following the displacement approach started by Priestley, Biskinis and Fardis (2007) developed simple rules for the calculation of the flexural resistance of RC members that feature lap splices in the plastic hinge region. The authors suggested an expression obtained from experimental tests on beams and columns. The expression was based on tensile strains limits that were defined as corresponding at 20% of the drop of lateral force of the specimens.
Finally, Hannewald (2013) based on compression strains limits in the context of plastic hinge analyses of three RC walls reported that the strain limit proposed by Priestley et al. (1996) was quite conservative while the strain at peak stress proposed by Mander (1988) provided better results.
Both, Hannewald (2007) and Biskinis and Fardis (2013), do not provide any values for residual forces after exceeding the strain limits proposed.
24
Figure 2.10: Qualitative representation of the moment-curvature relation for all the above-mentioned plastic hinge models (Tarquini, et al., 2017)
Recently, in École Polytechnique Fédérale de Lausanne (EPFL), supported by a campaign in which were tested RC walls featuring lap splices, was introduced a simple equivalent uniaxial stress-strain model that claims to be capable of representing the behavior of the steel reinforcement and the bond slip mechanism present in the lap splice easily in a common finite element software. (Tarquini, et al., 2017)
Is important to note that although this model does not concern reversed loading, being only applicable for monotonic load, the former was calibrated from data on cyclic tests and so, the effect of the cyclic loading is indirectly included.
The stress-strain curve proposed can be divided in two components, first an elastic branch until the equivalent yielding point (𝜀𝑦,𝑙𝑠, 𝑓𝑦,𝑙𝑠) follow by a post-yield behavior up to an ultimate point (𝜀𝑢,𝑙𝑠, 𝑓𝑢,𝑙𝑠). The equivalent yield strain of the former (𝜀𝑦,𝑙𝑠) can be simply define dividing the equivalent yield stress by
the Young’s modulus 𝐸𝑠 of the reinforcement steel. The equivalent yield stress (𝑓𝑦,𝑙𝑠) is characterized by
25 The expression to identify the ultimate strain limit is
𝜀𝑢,𝑙𝑠= 𝜀𝑦,𝑙𝑠 + 0.65 × 𝜌𝑤+ 0.03 ×𝐿𝑙𝑠
𝑠
(2.10)
Where 𝜀𝑦,𝑙𝑠 represents the equivalent yield strain, 𝑙𝑠 the length of the outermost lap splice in tension, 𝐿𝑠 the shear span of the member and 𝜌𝑤 the confining reinforcement ratio that is defined as
𝜌𝑤= 𝜌𝑥+ 𝜌𝑦
(2.11)
𝜌𝑥 = 𝐴𝑡𝑟𝑥×𝑠𝑁𝑙
𝑥× 𝑏
(2.12)
𝜌𝑦= 𝑠 𝐴𝑡𝑟𝑦
𝑦× (∅𝐿+ 𝑐𝑏𝑜)
(2.13)
Where 𝜌𝑥and 𝜌𝑦 represent the reinforcement ratios in the different planes of bending, 𝐴𝑡𝑟𝑥 and 𝐴𝑡𝑟𝑦 the area of the stirrups, s the spacing between them, 𝑛𝑙𝑒𝑔𝑠 the number of stirrup legs, 𝑑𝑏𝑙 the diameter of the longitudinal bars, 𝑏 the section width and 𝑐𝑏𝑜 the clear face concrete cover.
Attained the value of the ultimate strain limit the authors propose to predict the equivalent ultimate stress
𝑓𝑢,𝑙𝑠 as follows:
i) If the steel yield stress 𝑓𝑦 is bigger than the lap splice strength 𝑓𝑠 it is assumed that the splice maintains a constant strength up to the ultimate strain limit and thus 𝑓𝑢,𝑙𝑠= 𝑓𝑦,𝑙𝑠 = 𝑓𝑠; ii) If the equivalent yield stress is governed by the value of the steel yield stress (𝑓𝑦,𝑙𝑠 = 𝑓𝑦)
then the stress strain curve is assumed to be equal to the one of the reinforcing steel until the strain limit 𝜀𝑢,𝑙𝑠.
27
3
Experimental Test Campaign
3.1
Background
To calibrate a constitutive law that can predict the lap splice behavior, experimental data about the factors governing the lap splices performance is required.
Since building a specimen in real scale of a bridge pier is an expensive and time-consuming task it was necessary to find a solution that could allow the authors to test a relevant amount of specimens in a feasible time.
The test program was built follow up the campaign of Angeli et. al. (2013). Following the experimental campaign of Bimschas (2010) and Hannewald et al. (2013) which tested RC walls with lap splices at the bottom, Angeli et al. (2013) carried out an experimental campaign to study the behavior of lap splices under cyclic loading.
The suggested test specimen, depicted in figure 3.1, reproduces the behavior of a small corner region which
will roughly correspond to the “influence zone” of a single lap splice and it will provide information about
the factors controlling its behavior.
28 The results of this preliminary test shown the general viability of such experimental approach but they were strongly influenced by the chosen boundary conditions. Thereby, the shape of the test specimen was adjusted, introducing RC blocks on the top and bottom of the column creating an I-shaped figure (see figure 3.2).
Furthermore, the instrumentation used on the test of Angeli et al. (2013) was also updated, increasing the number of optical measurements in a way to achieve a better understanding of the average strains on the reinforcement bars and on the concrete cover.
The main tested parameters were chosen based on the literature review on chapter 2. Naturally different parameters can play a role and therefore the casting of the test specimens will be scheduled according with the test results. Thus, after the results of the first test series the configuration of new specimens will be chosen in order to study in more detail different parameters, such as splice length and smooth rebars.
(a)
Figure 3.2: Comparison between (a) Test Setup Angeli et al. (2013) and (b) Test Setup of the author
29
3.2
Characteristics of the test specimens
The characteristics of each column are presented on table 3.1. The specimens’ share the same dimensions, a cross section with 200 × 200 𝑚𝑚2and a total height of 1260 𝑚𝑚 (see figure 3.3).
For the first phase three specimens were tested. Each specimen feature two stiff RC blocks at the foundation and in the head which intend to simulate a fixed-fixed boundary conditions and this way be better representative of the real conditions on the wall. These rigid blocks have a rectangular cross section
550 × 300𝑚𝑚2 and a total height of 550𝑚𝑚.
30 The first specimens were mainly focus in the influence of the transversal reinforcement. Thus, the specimens just differ with respect to the transverse reinforcement which consists on stirrups of 6𝑚𝑚 diameter. Three different layouts were chosen, stirrups with 10𝑐𝑚 spacing for LAP-P1, stirrups with 20𝑐𝑚 and for LAP-P3 and finally 30𝑐𝑚 between the stirrups on the specimen LAP-P2. This amount to a respective transversal reinforcement ratio of 0.283% 0.141% and 0.094%.
Considering the old Swiss design codes, that allowed a minimum splice length of 40𝜙𝐿, a splice length of
560𝑚𝑚 was chosen for the longitudinal reinforcement of the test specimens P1, P2 and LAP-P3.
Table 3.1: Characteristics of Test Specimens of first test series
LAP-P1 LAP-P3 LAP-P2
Section (𝒎𝒎 × 𝒎𝒎) 200 × 200 200 × 200 200 × 200 Height (𝒎𝒎) 1260 1260 1260
Longitudinal
Reinforcement Layout (𝝆𝒔) 4 × ∅14𝑚𝑚 4 × ∅14𝑚𝑚 4 × ∅14𝑚𝑚 Longitudinal
Reinforcement Ratio (%) 1.53 1.53 1.53
Transversal Reinforcement
Layout (𝝆𝒘) ∅6𝑚𝑚//10𝑐𝑚 ∅6𝑚𝑚//20𝑐𝑚 ∅6𝑚𝑚//30𝑐𝑚 Transversal Reinforcement
Ratio (%) 0.283 0.141 0.094
Splice Length (𝒍𝒔) (𝒎𝒎) 560 560 560
31
3.3
Material Proprieties
3.3.1 Concrete
A number of three concrete compression tests were carried out in cylinders specimens to determine the compression strength for the concrete used in the tested piers. Table 3.2 presents the results obtained from three cylinders with 200 𝑐𝑚2 section and a height of 31.5 𝑐𝑚.
Table 3.2: Concrete proprieties
Material Properties
Concrete 𝑓′𝑐 [𝑀𝑃𝑎] (First Test Series)
31.7
3.3.2 Steel
Two different types of reinforcement were used in the tested specimens.
To determine the proprieties of the 14 mm and 6 mm diameter reinforcement six and eight different steel bars, respectively, were tested. With these tests the modulus of elasticity, the yield and ultimate strength and the yield and ultimate strain were obtained. The results are presented in table 3.3
Table 3.3: Steel proprieties
Material Properties
Steel 𝑓𝑦[𝑀𝑃𝑎] 𝑓𝑢[𝑀𝑃𝑎] 𝐸𝑠 [𝑀𝑃𝑎] 𝜀𝑦[%] 𝜀𝑢[%]
∅𝟔𝒎𝒎 475.0 625.0 183313 - 9.8
32
3.4
Load History
The existing load protocols are based in recordings from regions of high seismicity. Since the goal of this experimental campaign is to be representative of Swiss bridge population and the Swiss seismicity is assumed as moderate this can lead to overestimate damage demands.
A correct assumption of the loading history, for regions with low to moderate seismicity, will inherently result in less strength and deformation demands and hence in less expensive retrofit measures. (Mergos, et al., 2014). Therefore, this experimental campaign will consider the proposed loading protocols by Mergos et al. (2014) that limit the amount of load steps in function of seismicity, period and the number of cycles per step.
The total amount of loads step is typically
𝜂𝑡𝑜𝑡𝑎𝑙= 𝜂 × 𝑛𝑖
(3.1)
Where 𝜂 represent the number of load steps and 𝜂𝑖 represents the number of cycles per step.
This adaption of the loading protocol will increase the approximation of the test results with the real behavior of bridge piers in Switzerland when subjected to seismic action and hence lead to more accurate results.
To anticipate the behavior of the specimens was made a simple numerical model with the commercial software SeismoStruct. The model, with continuous reinforcement along its height, was loaded with incremental displacement until failure. The results represented in figure 3.4 were considered in the loading protocol.
(a) (b)
33 The loading protocol consisted in two alternate cycles, compression and tension, at the same value of displacement. When two cycles in tension and two cycles in compression were completed the applied displacement increased.
The applied displacement was increased progressively along the test for both compression and tension. The levels of displacement were based on strains measured near the base for the walls tested by Bimschas (2010) and Hannewald et al. (2013).
Since the horizontal load in the abovementioned specimens led to different levels of compression and tension strains at the base of the walls a compression-tension proportion is required to define the displacement applied levels of the proposed test.
The proportion compression-tension chosen was constant throughout all cycles being the compression displacement 10% of the displacement applied in tension. This proportion value was taken from the relation between the compressive and tensile strains near the base at failure of the abovementioned walls.
In figure 3.5 is presented the loading history graph. The quasi-static test began with a cycle to 1 mm and 0.1 mm in tension and compression respectively and it was increased to 2 mm-0.2 mm and then to 3 mm-0.3 mm. After the displacement was increased 3 mm at the time.
34
3.5
Test Setup and Instrumentation
In figure 3.6 is shown the test setup used on this experimental campaign. Before placing the specimens in the machine each specimen was painted and instrumented.
Since one of the aims of this campaign is to describe the progressive increasing of the cracks and the evolution of their widths the correct painting of the specimens has a particular importance.
When the load is low, the cracks will in correspondence have a smaller width and size. This means that, due to the elastic behavior of commercial paints, the former can cover the concrete and hide the small cracks of the specimen. Therefore, a white paint that does not feature this type of performance it was adopted.
To have the correct boundary conditions the RC blocks in the head and in the foundation of each specimen needed to be attached to the actuator and to the bottom of the engine respectively. To make this connection were chosen four T-shaped steel profiles that were clamped at each specimen and which in turn were connected to the press.
At first, the steel profiles were connected to the actuator. Knowing that the specimen will be subjected only to axial load the perpendicularity of the steel profiles had a particular importance since these would affect directly the perpendicularity of the tested piers. An imperfection in the verticality of the specimens can origin moments which could lead to an unrealistic response of the pier. To measure the verticality of the steel profiles vertical lasers and manual inclinometers were used.
When guaranteed the verticality, the steel profiles were connected to the actuator on the top and to the bottom through 8 bolts per each profile which makes up a total of 32 bolts. The bolts used in this link had all the same proprieties, a property class of 10.9 and a diameter of 24 𝑚𝑚. Each bolt was pre-stressed posteriorly to 350 𝑁𝑚.
Completed the preparation works, the specimens were erected and placed between the two steel plates on the top and on the foundation. In order to guarantee a correct perpendicularity, the piers were aligned through stiff steel plates under the foundation. These allows ensuring a support on the bottom which is particularly important before the final pre-stress between the steel plates and the test experiment be applied.