PAPER • OPEN ACCESS
Long term application of bus monitoring system to
short and medium span bridges and damage
detection
To cite this article: Ayaho Miyamoto et al 2015 J. Phys.: Conf. Ser. 628 012037
View the article online for updates and enhancements.
Related content
Enhanced thermoelectric performance in CdO by nano-SiO2 inclusions
Longjiang Li, S Liang, Shanming Li et al.
-Electrochemical multiphase microsensor for detection of organophosphates
M Sayyah, A Salehi-Khojin, K Y Lin et al.
-Piezoelectric and pyroelectric properties of conductive polyethylene oxide-lead titanate composites
H Khanbareh, S van der Zwaag and W A Groen
-Recent citations
A Vehicle-based Health Monitoring System for Short and Medium Span Bridges and Damage Detection Sensitivity
Ayaho Miyamoto et al
-Damage Detection Sensitivity of a Vehicle-based Bridge Health Monitoring System
-Long term application of bus monitoring system to short and
medium span bridges and damage detection
Ayaho Miyamoto1,a
, Válter J. G. Lúcio2,a
, Hisao Emoto1,b
and Hideaki Tanaka1,c 1
Graduate School of Science & Engineering, Yamaguchi Univ., Ube, Japan a
E-mail: miya818@yamaguchi-u.ac.jp
2
Faculty of Science and Engineering, NOVA de Lisboa Univ., Lisbon, Portugal a
E-mail: vlucio@unl.pt
Abstract. In this study, as one solution to the problem for condition assessment of
existing short and medium span reinforced/prestressed concrete bridges, a new
monitoring method using a public bus as part of a public transit system (bus monitoring
system) is proposed, along with safety indices, namely, characteristic deflection, which
is relatively free from the influence of dynamic disturbances due to such factors as the
roughness of the road surface, and a structural anomaly parameter. A basic study was
conducted by using the results of technical verification experiments and numerical
analysis simulation. This paper describes the details of not only how to assess the bridge
condition by public bus vibration measured in operating on Ube City bus network as a
specific example for verify the system but also what kind of consideration we need to
apply the system to existing bridges in overseas country.
1. Introduction
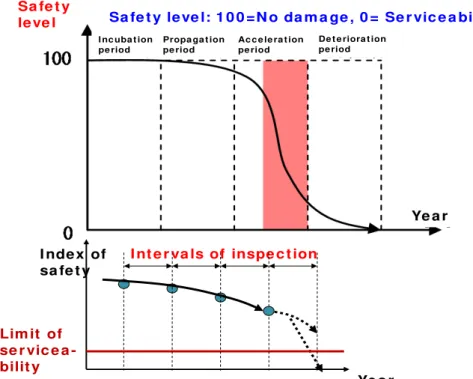
In order to properly maintain numerous short and medium span bridges in Japan by conducting periodic inspections, it is necessary to develop an easy-to-use and efficient bridge monitoring system. The authors are developing a short and medium span bridge monitoring system for detecting deterioration in safety and other performance of existing bridges by use of under-rear-wheel-spring acceleration sensors installed on fixed-route buses (hereinafter referred to as the "bus monitoring system") (Miyamoto and Yabe 2012; Yabe, Isoda and Miyamoto 2011). The proposed monitoring system represents a monitoring system, to be applied mainly to short and medium span bridges, making use of a fixed-route bus operated as part of a public transit system. The aim of the proposed system is to detect the transition from the "acceleration stage," in which the safety performance of a bridge sharply declines because of aging, to the "deterioration stage" (see Fig. 1). This paper presents the result of a three-year field test of the bus monitoring system conducted by using an in-service fixed-route bus in Ube City. For the bus monitoring system, "characteristic deflection" was defined as an indicator that may be useful in efficiently detecting a structural anomaly of a bridge. For the purpose of examining the sensitivity of characteristic deflection, the effect of artificial damage (bridge guardrail removal) on characteristic deflection was evaluated by using an aged (out-of-service) bridge being removed. Another field test was conducted jointly with the Universidade Nova de Lisboa (New University of Lisbon) in Portugal as an overseas application of the bus monitoring system. By analyzing the field test results thus obtained, possible steps in realizing practical application of the bus monitoring system were considered systematically.
2. Principles and Overview of the Bus Monitoring System
The bus monitoring system has been developed by the method of monitoring short and medium span bridges by using fixed-route buses operated as part of public transport systems. Fig. 2 illustrates the bus monitoring system, and Fig. 3 shows the analysis flow of the monitoring method. Main reasons why the use of fixed-route buses, which are large and heavy vehicles, was considered are as follows:
1) If a large vehicle about 10 m in length is used for on-the-move measurement on a short or medium span bridge, that vehicle is likely to be the only vehicle passing over the bridge at point in time.
2) In order to make a short or medium span bridge, whose stiffness is relatively high, it is necessary to use a reasonably heavyweight vehicle.
3) Large vehicles used to vibrate bridges make it easier to reproduce measuring conditions such as travel time, route, frequency of passages and vehicle speed.
4) By using a fixed-route bus equipped with acceleration sensors, main short and medium span bridges in the area of interest can be monitored on a regular basis. By so doing, monitoring cost would be substantially less than in the case where sensors were installed at all bridges.
5) Power for the measuring devices can be supplied from the power supply available in the bus.
The vertical displacement, δa(t) of the bridge and the bus under its rear wheel springs is an estimated deflection
obtainable by integrating the vertical acceleration waveform twice. That displacement can be expressed, as the sum of (1) the static displacement, δsa(t) dependent on bridge stiffness and bus weight, (2) a non-steady-state
vibration component having a stochastic nature characterized as a Gaussian process attributable to a rough road surface and having a mean value of 0, (3) vibration components governed by the equation of motion such
I nt e r va ls of inspe c t ion
Ye a r I nde x of
sa fe t y
Lim it of se r vic e a -bilit y
Ye a r Sa fe t y
le ve l Sa fe t y le ve l: 1 0 0 =N o da m a ge , 0 = Se r vic e a bilit y lim it I nc uba t ion
pe riod
Propa ga t ion pe riod
Ac c e le ra t ion pe riod
De t e riora t ion pe riod
Figure 1 Reduction path of safety level and coverage of proposed system
Monitoring bridge vibration with acceleration sensor
Bus station
Bridge A
Bridge B
Calculating “characteristic deflection” as a bridge condition indicator
as the bridge and the vehicle, and (4) external disturbance factors, δx(t) due to differences in the operating
conditions of the bus and differences in data extraction and processing methods, as follows:
(1)
where,
Sr(Ω, t): density function of road roughness,
Ω: spatial frequency of road surface,
X(f): Fourier coefficient.
For the purposes of this study, characteristic deflection μa (Yabe 2006) is defined as the estimated deflection
obtained from Eq. (1) averaged in the bridge section of the road. Studies have shown that characteristic deflection can be made to converge to the extent that anomaly evaluation results are not affected by increasing the number of samples, N, by using the central limit theorem, in order to allow for the influence of various external disturbance factors, δx(t), including the operating conditions of the bus. In this study, the authors used
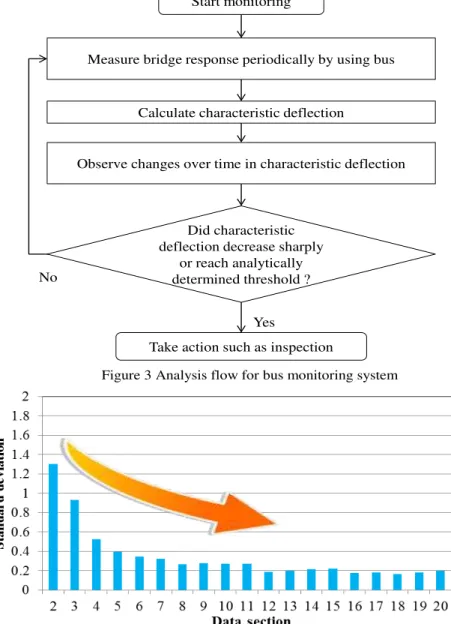
the moving average method to process characteristic deflection data and see what happens. In the moving average method, averages are calculated for incrementally shifted data sections. Fig. 4 shows standard deviations of characteristic deflection values obtained by calculating characteristic deflection averages for
( )
t( )
t S(
t)
X( )
f e ftidf x( )
t rsa
a
δ
δ
δ
= + Ω + ⋅ π +∫
−+∞∞2
,
Figure 4 Changes in standard deviation estimated by the moving average method Yes
No
Start monitoring
Measure bridge response periodically by using bus
Calculate characteristic deflection
Observe changes over time in characteristic deflection
Did characteristic deflection decrease sharply
or reach analytically determined threshold ?
Take action such as inspection
Figure 3 Analysis flow for bus monitoring system
incrementally shifted data sections. As shown in Fig. 4, as data sections become larger, standard deviations tend to decrease. It can also be seen that after data section size exceeds a certain limit, standard deviations do not change significantly thereafter. This indicates that by the moving average method mentioned above, the variability of characteristic deflection values decreased and converged so that anomalies can be detected by observing such changes.
3.
Long-term Monitoring of Short and Medium Span Bridges along Bus Routes in Ube City
3.1 Field test
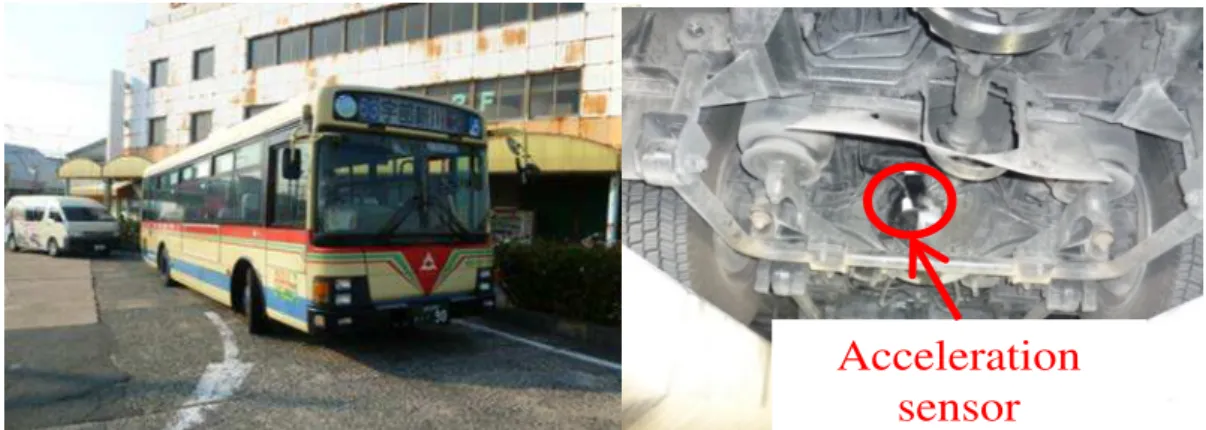
As a long-term application of the bus monitoring method of measurement, a field test utilizing Ube City's bus routes has been underway. The long-term experiment, which uses fixed-route buses being operated in the city, has been continued for about three years since December 2010 and is supposed to be continued in the years to come. Fig. 5 shows the fixed-route bus used in the experiment and the under-rear-wheel-spring acceleration sensors installed to the bus. The acceleration sensors were bonded to the under-rear-wheel-spring section of the bus and was coated with epoxy resin for protection over a long period of time. The sensors used consisted of a triaxial acceleration sensor and uniaxial acceleration sensors (backups). These sensors were oriented along the direction of travel of the bus (X-axis), the transverse direction (Y-axis) and the vertical direction (Z-axis). The acceleration sensor cables were passed through the floor drain of the bus. Thus, the acceleration sensors are connected to the data logger and the computer in the bus so that the vibration of the bus crossing the bridge can be monitored in real time. Although the acceleration sensors, the data logger and the computer are designed to be powered by the power source of the bus, in the experiment a portable rechargeable battery was used. Table 1 lists main bridges of interest located on the bus routes and summarizes data on those bridges. As an example of measurement data, this paper shows the measurements results obtained from the Shingondai Bridge (see Fig. 6), one of the bridges (prestressed concrete(PC) girder bridge) managed by Ube City on the bus routes.
3.2 Characteristic deflection calculation method
This section describes how to calculate characteristic deflection, an indicator of bridge performance used by the bus monitoring system. A flow diagram for the calculation of characteristic deflection following measurement data acquisition is shown in Fig. 7, and each step is described in detail below. The steps (1) through (5) shown below correspond to the numbers shown in Fig. 7.
Figure 5 Fixed-route bus and sensor used for long-term field testing
Acceleration
sensor
Bridge name Completed in Span length (m) Bridge length (m)
Start point side 1 Prestressed concrete slab bridge (pretensioned slab) 18.0
2 Prestressed concrete slab bridge (pretensioned slab) 16.0
3 Prestressed concrete slab bridge (pretensioned slab) 18.0
4 Prestressed concrete slab bridge (pretensioned slab) 14.0
End point side 5 Prestressed concrete slab bridge (pretensioned slab) 19.0
Start point side 1 Reinforced concrete (T-girder) 7.0
End point side 5 Reinforced concrete (T-girder) 7.0
Shingondai
Bridge June 1998 22.4 23.6
Type of superstructure
85.0
15.8
Girder bridge (other) Shiratsuchi
Daini Bridge
1933 (estimated)
Jase Bridge 1976 Span No.
Span No.
1) Extract data on vertical acceleration during bridge crossing
Extract data on vertical acceleration during the crossing of the bridge from the acceleration measurement data by referring to the combination of the time at which the bus crossed the bridge and GPS data.
2) Estimate the time when the bus passed midspan points
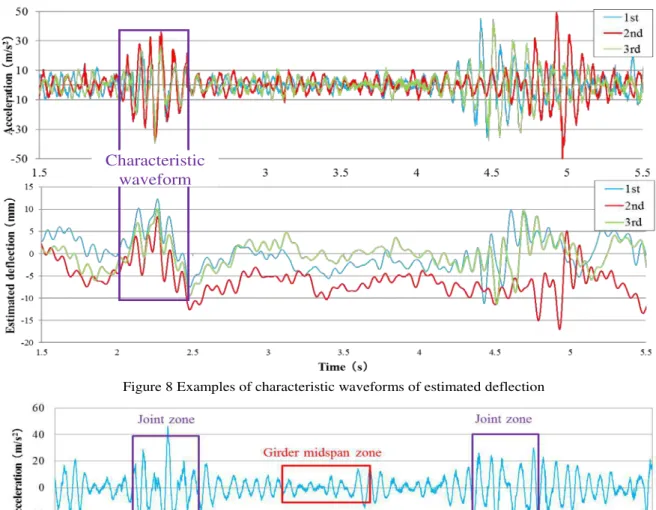
The extracted data on acceleration during the crossing of the bridge include data on strong vibrations recorded at bridge joints. It is therefore necessary to use girder midspan acceleration data that do not include such joint vibration data. The time when the midspan point of a girder is passed can be estimated by extracting data for between-joint data meeting certain criteria such as time intervals(sec) and the number of waves. Since, however, acceleration data vary considerably in magnitude depending on such factors as the operating conditions of the bus, it may be difficult to identify joint-zone data. In order to accurately estimate the time when the midspan point of a girder is passed, attention was paid to deflection estimates that can be obtained by integrating vertical acceleration data twice. As an example, Fig. 8 shows measured acceleration waveforms and estimated deflection values obtained by integrating
bridge-crossing acceleration data twice. As shown in Fig. 8, distinctively characteristic waveforms appear when the bus passes joints. Hence, on the basis of characteristic waveforms appearing on estimated deflection diagrams when the bus passes the joints of the bridge of interest, girder midspan waveforms are estimated and determined by synchronizing different data sets.
3) Extract midspan vertical acceleration data
Extract the midspan vertical acceleration data determined as described in Step (2). Fig. 9 shows examples of joint and midspan portions of vertical acceleration data. In the example shown in Fig. 9, a portion of midspan region data corresponding to about 0.8 sec (about 10 waves) was identified as data to be extracted. The most important thing in calculating characteristics deflection is to determine the range of data to be extracted according to such criteria as the number of waves and time(sec) and extract acceleration waveforms from the same regions every time.
4) Integrate extracted acceleration data twice
Extracted acceleration data are converted to velocity by the first integration and to displacement by the second integration. At this step, the vertical displacement obtained by integrating vertical acceleration twice is taken as an estimated deflection.
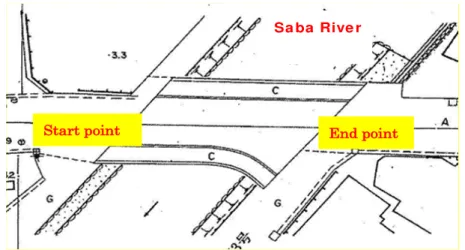
Sa ba Rive r
Start point End point
Figure 6 Plan view of Shingondai Bridge
Measurement data
(1) Extract data on vertical acceleration induced by bridge-crossing bus
(2) Estimate girder midspan time
(3) Extract data on vertical acceleration data induced by bus passing midspan
(4) Integrate extracted acceleration data twice
(5) Calculate average of estimated deflections
Characteristic deflection
Figure 7 Flow of characteristic deflection calculation following measurement data
acquisition
An example of a deflection estimation result is shown in Fig. 10.
5) Average estimated deflection
Calculated characteristic deflection by averaging the deflection estimates shown in the graph obtained at Step (4) in the direction of time (Fig. 10).
3.3 Experiment results
First of all, let us consider whether or not it is possible, in the event of a structural anomaly of the bridge of interest, to detect the anomaly from the under-rear-wheel-spring acceleration response of the bus. In a previous study, vibration analysis using FSWT (Frequency Slice Wavelet
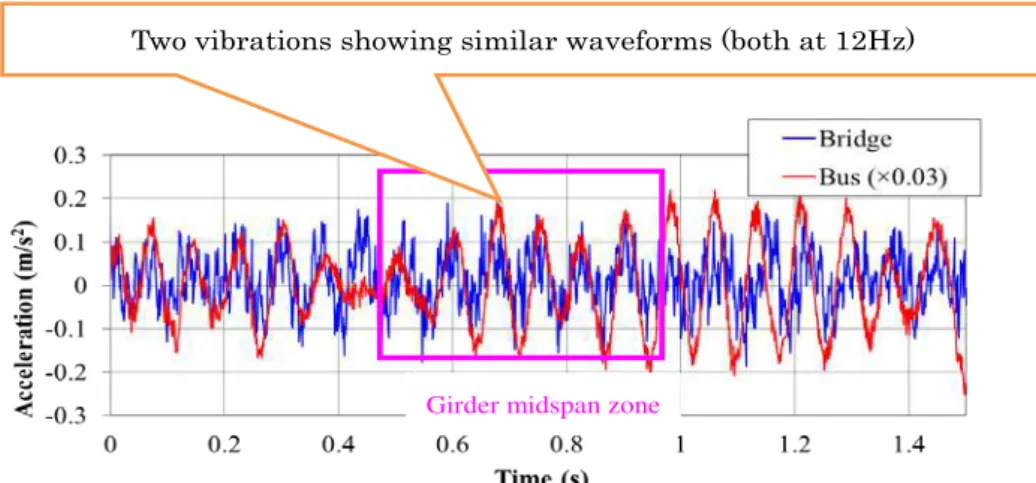
Transform), a time–frequency analysis method, was conducted to analyze acceleration response (Yan, Miyamoto and Jiang 2009). The FSWT analysis of the girder-midspan and under-rear-wheel-spring acceleration responses conducted in this study indicated that the under-rear-wheel-spring region of the bus was always vibrating at around 12 Hz, regardless of whether or not the bus was crossing the bridge. On the other hand, with respect to the acceleration response of the bridge, it has been confirmed that the girder-midspan region of the bridge was actually vibrating at around 12 Hz (Yabe et al. 2012). Fig. 11 shows the acceleration responses of the under-rear-wheel-spring region of the bus and the girder midspan region of the bridge observed when the bus passed the girder midspan section of the bridge. It can be seen that in terms
Figure 10 Example of deflection calculation Figure 9 Example of determination of acceleration data extraction range
Characteristic
waveform
of the magnitude of acceleration response, the two waveforms show a fair degree of similarity although the under-rear-wheel-spring response values tend to be larger. From these results, it can be concluded that the vibration properties of the bridge of interest can be identified according to the under-rear-wheel-spring vibration of the bus.
Next, let us consider characteristic deflection calculation results. Fig. 12(a) and (b) show changes in characteristic deflection at the Shingondai Bridge during the initial and return trips, respectively, of the bus calculated from the measurement data obtained during a total of 56 days in 2010 to 2013. There are differences in the number of data sets between initial trip data and return trip data because there were some invalid cases such as a case in which the bus stopped on a bridge. The data shown in Fig. 12(a) and (b) were obtained by applying a serious deterioration threshold specifying the limit of the degree of seriousness of bridge anomalies.
Girder midspan zone
Two vibrations showing similar waveforms (both at 12Hz)
Figure 11 Comparison of girder-midspan and under-rear-wheel-spring acceleration responses
(a) Tokonami→Nishikiwa Gakkomae
(b) Nishikiwa Gakkomae→Tokonami
Figure 12 Long-term changes in characteristic deflection (Shingondai Bridge)
In this connection, it has been found that characteristic deflection increases to 193% in the event of deterioration that causes the introduced prestressing force to decrease by 50% and to 286% in the event of deterioration that causes the introduced prestressing force to decrease by 90% (NILIM 2010). It was therefore decided to calculate the average of the characteristic deflection values obtained from the first 15 measurements and use the characteristic deflection value equal to 1.93 times the average value as the threshold level for Phase 1 deterioration (red line) and the characteristic deflection value equal to 2.86 times the average value as the threshold level for Phase 2 deterioration (green line). The actual procedure is to measure characteristic deflection on a continual basis and, if the threshold level is reached or exceeded, suspect the occurrence of some kind of serious damage to the bridge of interest and conduct visual inspection immediately. Inspection needs to be conducted when characteristic deflection has reached or exceeded the threshold level on the initial or return trip. Characteristic deflections in “Data Section 15“ obtained by the moving average method are shown in Fig. 12, where a single characteristic deflection point represents the average of 15 measurement results. Comparison of Fig. 12(a) and (b) reveals that characteristic deflection values differ between the initial trip and the return trip. This is thought to be because the Shingondai Bridge is not symmetrical as shown in Fig. 6. Long-term changes in characteristic deflection showed little change although Fig. 12(a) shows slight changes. In contrast, Fig. 12(b) shows that the lowest value of characteristic deflection decreased gradually. Nevertheless, in both cases, the serious deterioration threshold was not reached or exceeded. It can therefore be concluded that serious damage has not yet occurred on the initial trip route or on the return trip route.
4. Effect of artificial damage on characteristic deflection
This section reports on the result of a study on the influence of artificial damage (bridge guardrail removal) conducted, by using an aged (out-of-service) bridge being removed, to investigate the sensitivity of the bus monitoring system to characteristic deflection.
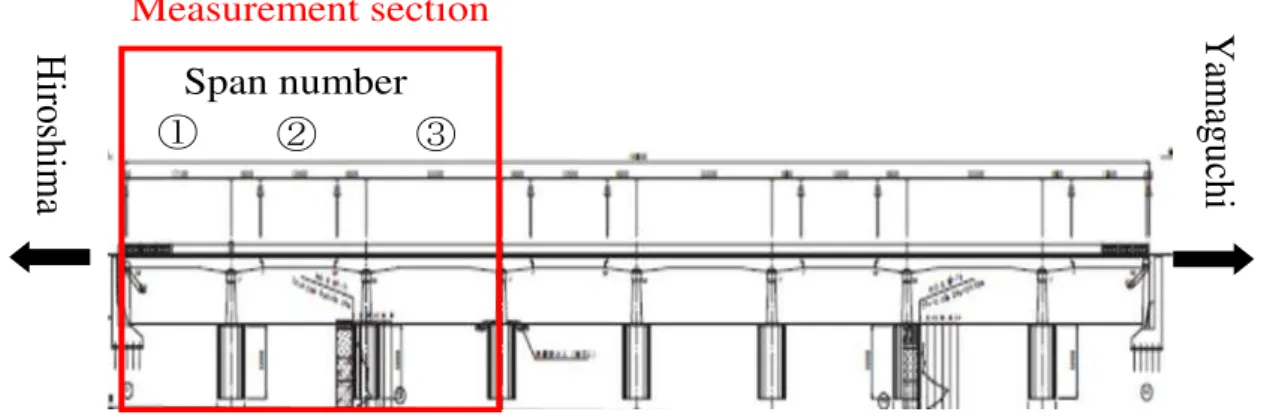
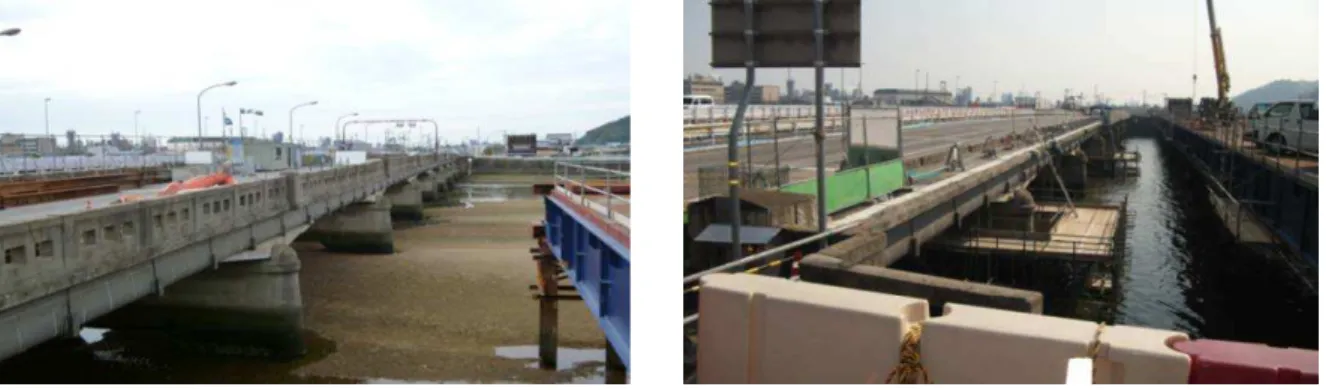
In the experiment conducted for the purpose mentioned above, acceleration sensors were installed to a sightseeing bus weighing about 15 tons as shown in Fig. 13 by using a bridge being removed for the construction of a new bridge. The bridge is a 168.29-meter-long, eight-span reinforced concrete(RC) cantilever T-girder bridge as shown in Fig. 14. In consideration of such factors as seasonal changes and the presence or absence of bridge railings, the measurement was conducted four times, namely, in September, 2012, and January, February and March, 2013. Fig. 15 shows how the bridge looks before and after guardrail removal.
Fig. 16 shows the average values of 15 sets of
characteristic deflection measurements calculated from the total of 4 sets of measurements. As can be seen from Fig. 16, the concrete guardrails were removed between the second measurement and the third measurement. The characteristic deflection values before and after the guardrail removal, therefore, were
Figure 13 Sightseeing bus used for the field test
Measurement section
①
②
③
Span number
Ya
m
aguc
hi
Hir
oshim
a
compared. The amount of change in the flexural stiffness of the bridge structure due to the guardrail removal was a decrease of about 5%. Examination of Span 3 (see Fig. 14) reveals that the two measured values of characteristic deflection after the guardrail removal (−2.97, −2.89) were about 10% smaller than the values of characteristic deflection after the guardrail removal (−2.67, −2.61). This is thought to be because the decrease in the flexural stiffness of the bridge structure influenced characteristic deflection. However, examination of Span 2, which includes the cantilever structure, reveals that the measured value of characteristic deflection obtained from the fourth measurement (−2.24) is slightly greater than the characteristic deflection before the guardrail removal. The reason for this is thought to be that since Span 2 includes the cantilever structure, it had some kind of influence on characteristic deflection. It is necessary, therefore, to continue various studies, including simulation analyses, on how to deal with spans that include cantilever structures.
5. Overview of Overseas Field Test
This section reports on the field test conducted in the city of Lisbon in Portugal as an overseas application of the bus monitoring system.
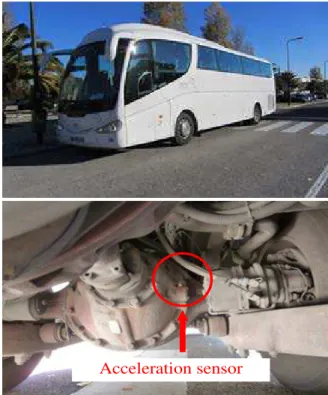
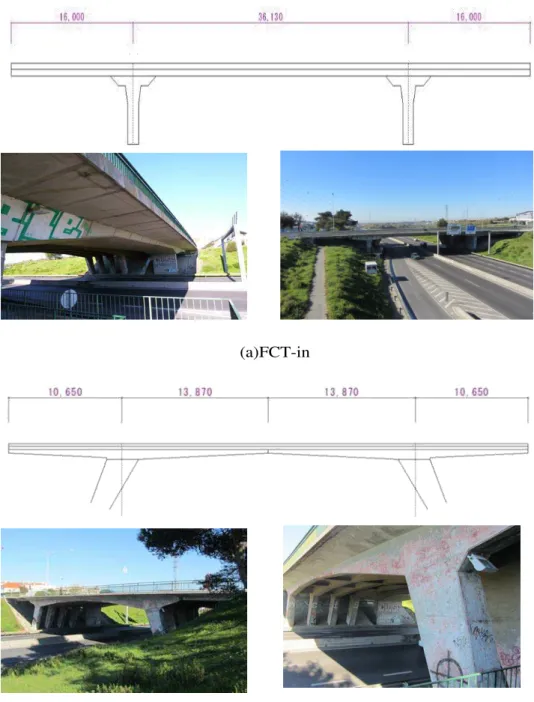
As part of a joint study made by Yamaguchi University and the Universidade Nova de Lisboa (NOVA), the field test was conducted with the cooperation of a group led by Prof. Válter J. G. Lúcio of NOVA. Fig. 17 shows the fixed-route bus used in the experiment. The bus used in the field test is a fixed-route bus actually operating in Lisbon. The total weight is about 14 tons, and an under-rear-wheel-spring triaxial acceleration sensor was installed to the bus. Two bridges located near the university were chosen for the experiment. In this paper, the two bridges are referred to as "FCT-in" and "FCT-out." Table 2 and Fig. 18(a) and (b) show the structural types, dimensions and appearances of the bridge, along with other general information. For the purpose of checking the coupling between the bus and the bridge of interest, a velocity sensor was installed in the middle section of each bridge to measure the velocity of the bus passing by on the bridge. The velocity
-2.30 -2.29 -2.60 -2.24 -2.67 -2.61 -2.97 -2.89 -3.50 -3.00 -2.50 -2.00 -1.50 -1.00 -0.50 0.00
2012/8 2012/9 2012/10 2012/11 2012/12 2013/1 2013/2 2013/3 2013/4
C h ar ac te ri st ic d ef le ct io n ( m m )
Months in which measurement was conducted
2nd span (cantilever)
3rd span
Figure 16 Changes in characteristic deflection due to guardrail removal Figure 15 Bridge view before and after guardrail removal
(a) Before guardrail removal (b) After guardrail removal
sensor actually used in the field test is shown in Fig. 19. At each bridge, measurement was conducted 15 times at a travel speed of 40 km/h.
Fig. 20(a) and (b) compare the under-rear-wheel-spring acceleration of the bus and the girder midspan acceleration of the bridge measured when the bus crossed the two bridges. The under-rear-wheel-spring acceleration response of the bus here is the vertical acceleration data obtained from a triaxial acceleration sensor, and the center-of-bridge acceleration response of the bridge was obtained by converting the velocity data obtained from a velocity sensor by differentiating it once. At FCT-in, which is a continuous slab girder bridge as shown in Fig. 18(a), the under-rear-wheel-spring acceleration response of the bus and the middle section acceleration response of the bridge are fairly similar as shown in Fig. 20(a). At FCT-out, which is a cantilever bridge as shown in Fig. 18(b), the under-rear-wheel -spring acceleration response and the bridge acceleration response were fairly similar when the bus was passing the center-of-cantilevered-span zone at the left as shown in Fig. 20(b). When the bus was passing the center-of-bridge joint zone, however, the bridge showed a larger acceleration response to the extent that similarity with the under-rear-wheel-spring acceleration of the bus
was no longer discernible. This is thought to be because the bus practically climbed over the central joint (i.e. cantilever joint) so that the vibration caused by the weight of the bus had a great influence on the bridge. Thus, it was found that the bus monitoring system can be applied to a continuous girder or simple girder bridge but cannot be applied to a cantilever bridge with a midspan joint like FCT-out.
This section shows characteristic deflection calculation results for FCT-in, which was thought to be a bridge of the type to which the bus monitoring system can be applied. As the first step, to determine the characteristic deflection of FCT-in, data for a period of about 1.8 seconds corresponding to the time the bus took to pass the middle section of the slab girder bridge (the encircled area in Fig. 20(a)) were extracted, and deflection was calculated by integrating acceleration twice. Fig. 21 shows examples of deflection estimates thus obtained. Showing estimated deflection on the vertical axis and time on the horizontal axis, Fig. 21 shows estimated deflection values obtained from the 15 measurements. As shown in Fig. 21, data were extracted from the same section, and the obtained waveforms show similarity. Characteristic deflection is calculated by averaging estimated deflection values in this extraction section. Table 3 lists the characteristic deflection values obtained from the 15 measurements. Thus, the average of the results of the 15 measurements that make characteristic deflection converge to a median is −4.10 mm (standard deviation: 0.63). It is important to continue to conduct more measurements by using this average as a criterion value and monitor changes in characteristic deflection over a long period of time.
Acceleration sensor
Figure 17 Fixed-route bus used and sensor location
Bridge name
Start point 1 16.00
2 36.13
End point 3 16.00
Start point 1 10.65
2 13.87
3 13.87
End point 4 10.65
Bridge length (m)
68.13
49.04 Type of superstructure
FCT-in FCT-out Span number Span number
3-span continuous prestressed concrete slab girder bridge
Figure 19 Velocity sensor (a)FCT-in
(b)FCT-out
Figure 18 Fixed-route bus used and sensor location
As mentioned above, the field test results that have been obtained indicate that the proposed system can be applied to a continuous or simple girder bridge but cannot be applied to a cantilever bridge with a midspan joint like FCT-out. It is therefore necessary to conduct more field tests on other types of bridges. In view of the result of the test conducted in a country other than Japan, it has also been found that the proposed system can be used in other countries where conditions such as the instrumentation environment and vehicles used for measurement differ from those in Japan. The next task is to apply the proposed system to more bridges in other countries, conducting not only short-term but also long-term behavior measurements.
Figure 20 Comparison of under-rear-wheel-spring and girder-midspan acceleration responses during bridge crossing
6. Conclusions
This paper has reported on the development of a new short and long span bridge monitoring method using a fixed-route bus, presented field test results and discussed evaluation methods. Then, as a result of this study, this paper has shown that it may be possible to detect structural anomalies of bridges efficiently from changes in "characteristic deflection." On the other hand, it has also been found that characteristic deflection values calculated from measurement data varied widely. This is thought to be due to differences in the operating conditions of the bus. As the next step, it is necessary to conduct more measurements and investigate the effects of long-term operating conditions on results obtained, with the aim of improving characteristic deflection so as to reduce its variability and putting the proposed system to practical use as a long-term monitoring system.
The findings of this study are summarized below:
1) The development of a new short and medium span bridge monitoring system utilizing a publicly operated fixed-route bus and field test results have been reported, and evaluation methods have been discussed. As a result, it has been shown that it may be possible to
detect structural anomalies of bridges through long-term measurement of characteristic deflection. It has also been found, however, that characteristic deflection values calculated from measurement data varied considerably. This is thought to be attributable to differences in the operating conditions of the bus. Changes in characteristic deflection have been observed for about three years through field testing. Since no sharp declining trend has been observed, it is necessary to continue long-term measurement.
2) In the field test carried out by using an aged (out-of-service) bridge being removed, a study was conducted on the influence (sensitivity) of artificial damage (bridge railing removal) on characteristic deflection. The experimental results for Span 3 of the bridge indicate that characteristic deflection is reasonably sensitive to declines in the flexural stiffness of the bridge structure. Since the characteristic deflection results for Span 2 show a considerable degree of variability, various studies including simulation analyses need to be conducted.
3) The field test of the bus monitoring system in an overseas environment showed that the system can be used without being affected by the measuring environment and the vehicle used. It has also been found, however, that it may be difficult to apply the system to certain types of bridges such as cantilever bridges.
7. References
[1] A. Miyamoto and A. Yabe: Development of Practical Health Monitoring System for Short-and Medium-Span Bridges based on Vibration Responses of City Bus, Journal of Civil Structural Health Monitoring, International Society for Structural Health Monitoring of Intelligent Infrastructure (ISHMII,), Vol.2, No.1, pp.47-63, May 2012.
[2] Yabe, A., Isoda, S. and Miyamoto, A.: "Development of bridge anomaly detection using characteristic deflection: analytical study" (in Japanese), Proceedings of the 66th Annual Conference of the Japan Society of Civil Engineers, I-275, Sept. 2012.
[3] Japan Society of Civil Engineers: Standard specifications for concrete structures: maintenance, Dec. 2011. [4] Yabe, A.: "Development of a method for analyzing moving body–structure dynamic interaction using the substructure method" (in Japanese), Proceedings of the 61st Annual Conference of the Japan Society of Civil Engineers, pp. 845–846, Sept. 2006.
[5] Z. Yan, A. Miyamoto and Z. Jiang: “Frequency Slice Wavelet Transform for Transient Vibration Response Analysis”, Mechanical Systems and Signal Processing, Vol. 23, Issue 5, pp. 1474-1489, July, 2009. [6] Yabe, A., Isoda, S., Nagata, M. and Miyamoto, A.: "Field test on short/medium span bridge monitoring
system based on public bus vibration" (in Japanese), Proceedings of the 67th Annual Conference of the Japan Society of Civil Engineers, VI-232, 2012.
1 -4.51 2 -4.06 3 -4.37 4 -4.26 5 -4.65 6 -4.67 7 -3.72 8 -2.97 9 -4.87 10 -4.23 11 -3.33 12 -4.83 13 -4.44 14 -3.43 15 -3.11 AVERAGE -4.10 No. Characteristic deflection (mm)
Table 3 Characteristic deflection (FCT-in)