Mariana Filipa de Almeida Viegas
Licenciada em Biologia
Towards determining the structure of
human KIFC1, a potential target for drug
development in cancer therapy
Dissertação para obtenção de Grau de Mestre em Genética
Molecular e Biomedicina
Orientador: Prof. Dr. Frank Kozielski, Professor de
“Pharmaceutical and Biological Chemistry”
, School of
Pharmacy, University College London
Júri:
Presidente: Prof. Doutora Paula Maria Theriaga Mendes Bernardes Gonçalves;
Doutor Pedro Miguel Ribeiro Viana Baptista;
Arguente: Doutora Maria Alexandra Núncio de Carvalho Ramos Fernandes.
Mariana Filipa de Almeida Viegas
Towards determining the structure of human KIFC1, a potential target
for drug development in cancer therapy
Dissertação apresentada à Faculdade
de
Ciências
e
Tecnologia,
Universidade Nova de Lisboa para
obtenção de Grau de Mestre em
Genética Molecular e Biomedicina.
Área de Concentração: Cancer
Therapy
Orientador: Prof. Dr. Frank Kozielski
Lisboa
iii
Towards determining the structure of human KIFC1, a potential target for
drug development in cancer therapy
Copyright © Mariana Filipa de Almeida Viegas, Faculdade de Ciências e Tecnologia, Universidade Nova de Lisboa
v
Acknowledgements
My deepest appreciation to Prof. Frank Kozielski and Dr. Sandeep Talapatra for all their guidance, support and precious advice during the course of this project and writing of my thesis.
Furthermore, I would like to thank my former colleges, Federica Riccio and Chatrin Chatrin, for their help during my initial period in the laboratory.
vii
Abstract
Normal cell division is initiated upon centrosome duplication and the two centrosomes move towards the cell periphery to form the poles of a bipolar mitotic spindle, a function that is essential for accurate chromosome segregation. Aberrant centrosomes duplication leading to more than two centrosomes is referred to as centrosome amplification. Centrosome amplification causes genetic instability and is a hallmark in cancer cells. Cancer cells survive the multiple mitotic spindle formation by clustering Microtubules Organizing Centres (MTOCs) to form two supernumerary centrosomes and a single pseudo-bipolar spindle during metaphase. KIFC1, a kinesin essential for this process, is particularly interesting as a potential therapeutic target. This is due to its non-essential role in cell division in normal cells but crucial centrosome clustering function in cancer cells with supernumerary centrosomes.
The overall goal of this project was to determine the structure of the catalytic domain, also known as motor domain, of KIFC1 to aid future structure-based drug-design.
In this project, I have established the expression and purification protocol for the KIFC1 motor domain. The protocol enables to obtain large amounts of protein at highest purity. Although I obtained crystals initially, their reproduction was difficult and therefore high-resolution crystals of the KIFC1 motor domain proved difficult to obtain. As such, the search for crystallisation conditions that allow the formation of high-resolution and reproducible crystals of the KIFC1 motor domain continues. Once this bottleneck is surpassed, it will be possible to use the structure for future structure-based drug-design.
ix
Resumo
A divisão celular normal é iniciada quando o centrossoma sofre duplicação e os dois centrossomas se deslocam para a periferia celular para formar os polos do fuso mitótico bipolar, uma função que é essencial para a segregação cromossomal precisa. A duplicação centrossomal aberrante que resulta em mais de dois centrossomas é referida como amplificação centrossomal. A amplificação centrossomal causa instabilidade genética e é uma característica das células cancerígenas. As células cancerígenas sobrevivem ao fuso mitótico multipolar pelo agrupamento de Centros Organizadores de Microtúbulos (MTOCs), formando dois centrossomas supernumerários e um único fuso pseudo-bipolar durante a metáfase. KIFC1, uma cinesina essencial para este processo, é particularmente interessante como potencial alvo terapêutico. Isto deve-se ao seu papel na divisão celular de células normais não ser essencial, mas, no entanto, a sua função de agrupamento de centrossomas ser crucial em células cancerígenas com centrossomas supernumerários.
O objetivo geral deste projeto foi determinar a estrutura do domínio catalítico, também conhecido como domínio motor, de KIFC1 para futuro desenho de fármacos com base em estrutura.
Neste projeto, estabeleci um protocolo para expressão e purificação do domínio motor de KIFC1. O protocolo permite obter grandes quantidades de proteína com altos níveis de pureza. Apesar de ter obtido cristais inicialmente, a sua reprodução foi difícil e, portanto, cristais de alta-resolução do domínio motor de KIFC1 provaram ser difíceis de obter. Como tal, a procura por condições de cristalização que permitam a formação de cristais do domínio motor de KIFC1 de alta resolução e reprodutíveis continua. Uma vez esta barreira ultrapassada, será possível usar a estrutura para futuro desenho de fármacos com base em estrutura.
xi
Table of Contents
Acknowledgements ...v
Abstract... vii
Resumo ... ix
Table of Contents ... xi
List of Figures ... xv
List of Tables ... xvii
List of Abbreviations ... xix
List of Acronyms ... xxi
1. Introduction ... 1
1.1. Kinesin superfamily ... 1
1.1.1. Structural characteristics of kinesins ... 2
1.1.2. Motility of kinesins... 3
1.1.3. Functions of kinesins ... 4
1.2. Human KIFC1 ... 6
1.2.1. Structural organisation of human KIFC1 ... 6
1.2.2. Functions of KIFC1 ... 6
1.2.3. KIFC1 as a novel target for cancer chemotherapy ... 7
1.3. Aims of the project ... 9
2. Materials and Methods ... 11
2.1. Materials ... 11
2.1.1. Consumables ... 11
2.1.2. Equipment ... 11
2.1.3. Software packages ... 12
2.2. Methods ... 13
2.2.1. Transformation for obtaining plasmid DNA (pDNA) and protein expression ... 13
2.2.2. Midi-prep protocol for pDNA purification ... 13
2.2.3. Restriction and purification of the restricted DNA ... 14
2.2.4. Ligation and transformation of restricted DNA ... 14
2.2.5. Purification of ligated pDNA using the Mini-Prep Kit ... 15
2.2.6. Diagnostic restriction, transformation for protein expression and purification and Midi-prep protocol for pDNA purification ... 15
2.2.7. Small-scale protein expression and purification ... 15
2.2.8. Large-scale protein expression and purification ... 16
2.2.9. Crystallisation trials using a nanodrop robot ... 18
xii
2.2.11. Desalting of KIFC1-MD ... 19
2.2.12. Optimization of the crystallisation conditions from nanodrops to microdrops ... 19
2.2.23. ATPase Assay ... 25
2.2.24. Amino acids sequence alignment ... 26
2.2.25. Fragment-based screening ... 26
3. Results ... 27
3.1. Restriction of the vectors and the insert containing plasmid for sub-cloning of KIFC1-MD ... 27
3.2. Diagnostic restriction digest to check for positive sub-cloning of KIFC1-MD ... 28
3.3. Small-scale purification to determine the best conditions of KIFC1-MD expression ... 29
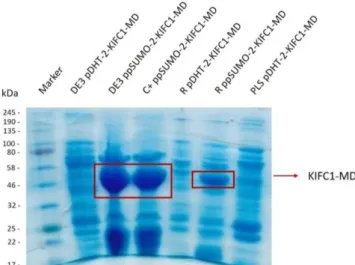
3.3.1. Small-scale expression of pDHT-2-KIFC1-MD and ppSUMO-2-KIFC1-MD in different E. coli strains ... 29
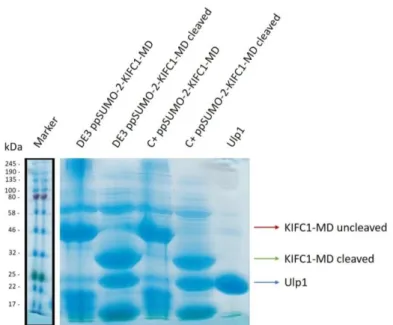
3.3.2. Assessment of the His and SUMO tags cleavage efficiency ... 29
3.4. Large-scale purification to obtain large amounts of KIFC1-MD at high purity ... 30
3.4.1. First purification step by nickel-affinity column ... 30
3.4.2. Second purification step by nickel-affinity column ... 31
3.4.3. Gel filtration chromatography ... 32
3.5. First crystallisation screen ... 33
3.6. Optimization plate Nº 1 ... 34
3.7. Optimization plates Nº 2-11 ... 36
3.8. Second crystallisation screen ... 36
3.9. Optimization plates Nº 12-14 ... 38
3.6. ATPase Assay ... 38
4. Discussion ... 41
4.1. Sub-cloning, expression and purification of human KIFC1-MD ... 41
4.2. Crystallisation ... 41
4.3. Final remarks ... 47
5. Conclusion ... 49
6. References ... 51
7. Attachments ... 55
7.1. Vectors’ details ... 55
7.2. Amino acids sequences of the purified KIFC1-MD before and after cleavage ... 56
7.3. E. coli cells details ... 56
7.4. Additional Materials ... 57
7.5. Large-scale protein expression and purification (batch Nº 2) results ... 57
7.6. Large-scale protein expression and purification (batch Nº 3) results ... 58
7.7. Large-scale protein expression and purification (batch Nº 4) results ... 59
7.8. Large-scale protein expression and purification (batch Nº 5) results ... 60
xv
List of Figures
Figure 1.1. The structure and phylogeny of major KIFs……….2
Figure 1.2. Diagrammatic representation of Ncd………6
Figure 2.1. Scheme representing the process of gel filtration……….18
Figure 2.2. Scheme representing the reactions involved in the ATPase assay………...26
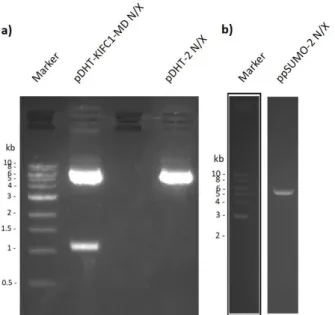
Figure 3.1. Agarose gels containing the restricted DNA from a) pDHT-KIFC1-MD plasmid and pDHT-2 vector and b) ppSUMO-2 vector………...………..27
Figure 3.2. Agarose gels containing the pDNA from the diagnostic restrictions of a) the ppSUMO-2 constructs and b) the pDHT-2 constructs………..……...28
Figure 3.3. SDS-PAGE gel with small-scale expression/purification samples……….29
Figure 3.4. Assessment of the His and SUMO tags cleavage efficiency………..30
Figure 3.5. SDS-PAGE gel of KIFC1-MD large-scale first purification step by nickel-affinity column………31
Figure 3.6. SDS-PAGE gel of KIFC1-MD after the second purification step by nickel affinity column………31
Figure 3.7. UV profile of KIFC1-MD final purification step by gel filtration…………..………..32
Figure 3.8. SDS-PAGE gel of purified KIFC1-MD after gel filtration………..32
Figure 3.9. Crystals found in MORPHEUS® Screen at 4ºC, 6 days after the screen setup………...33
Figure 3.10. Crystals found in the RdRP Screen at 4ºC, 2.5 months after the screen setup………..33
Figure 3.11. Diffraction pattern obtained from the crystal of H6 condition of MORPHEUS® Screen…...34
Figure 3.12. Crystals found in well D6 of optimization plate Nº1, in 2:1 ratio Hanging drop, 4 days after the plate setup………..34
Figure 3.13. Crystals found in optimization plate Nº1, four weeks after the plate setup……….35
Figure 3.14. Crystals found in the RdRP Screen of the second crystallisation screen, 4 days after the screen setup………..36
Figure 3.15. Crystals found in the second crystallisation screen, 15 days after the plates setup………37
Figure 3.16. Characterization of the basal ATPase activity of KIFC1-MD………39
Figure 4.1. Structure of the motor domain of KIFC1 in complex with Mg2+ and ADP (PDB ID: 2REP)...48
Figure 7.1. Scheme representing vector pET28a………55
Figure 7.2. UV profile of KIFC1-MD final purification step by gel filtration (batch Nº2)………...58
Figure 7.3. SDS-PAGE gel of purified KIFC1-MD after gel filtration (batch Nº2)………58
Figure 7.4. UV profile of KIFC1-MD final purification step by gel filtration (batch Nº3) ………59
Figure 7.5. SDS-PAGE gel of purified KIFC1-MD after gel filtration (batch Nº3)………59
Figure 7.6 UV profile of KIFC1-MD final purification step by gel filtration (batch Nº4) ………60
Figure 7.7. SDS-PAGE gel of purified KIFC1-MD after gel filtration (batch Nº4)………60 Figure 7.8. UV profile of KIFC1-MD final purification step by gel filtration (batch Nº5)………61
Figure 7.9. SDS-PAGE gel of purified KIFC1-MD after gel filtration (batch Nº5)………61
xvii
List of Tables
Table 2.1. Summary of DNA transformed in each E. coli strain and respective purpose……….13
Table 2.2. Antibiotic supplements provided for each E. colistrain………...………..16
Table 2.3. Summary of crystals measured, cryoprotectant used and place of measurement……….…..19
Table 2.4. Summary of optimization plates setup………20
Table 2.5. Crystallisation conditions optimization plan for optimization plate Nº1………...…21
Table 2.6. Crystallisation conditions optimization plan for optimization plate Nº2………...…21
Table 2.7. Crystallisation conditions optimization plan for optimization plates Nº3/4………..22
Table 2.8. Crystallisation conditions optimization plan for optimization plate Nº7………...22
Table 2.9. Crystallisation conditions optimization plan for optimization plate Nº8………...23
Table 2.10. Crystallisation conditions optimization plan for optimization plate Nº9……….24
Table 2.11. Crystallisation conditions optimization plan for optimization plate Nº12………...24
Table 2.12. Crystallisation conditions optimization plan for optimization plate Nº13………...25
Table 2.13. ATP concentration series (mM) used in the ATPase assay………...26
Table 3.1. Summary of crystals obtained………..38
xix
List of Abbreviations
1-HB One-Head Bound 2-HB Two-Heads Bound CV Column Volume C-terminal Carboxyl-terminaldsDNA Double-Stranded DNA
EMT Epithelial-Mesenchymal Transition ER Endoplasmatic Reticulum
IFT Intraflagellar Transport Kav Partition coefficient
KIFC1-MD KIFC1 motor domain MCS Multiple Cloning-Site MT(s) Microtubule(s)
Ni2+-NTA Ni(II)-Nitrilotriacetic Acid
NL Neck-Linker N-terminal Amino-terminal
NSCLC Non-Small-Cell Lung Cancer pDNA plasmid DNA
xxi
List of Acronyms
βMe β-Mercaptoethanol
ACES N-(2-Acetamino)-2-Aminoethanesulfonic Acid ADP Adenosine Diphosphate
ATP Adenosine Triphosphate
CENP-E Centromere-associated Protein E DNA Deoxy-Ribonucleic Acid
DTT Dithiotheitol
E. coli Escherichia coli
EDTA Ethylene-Diamine-Tetra-Acetic Acid
HEPES 2-[4-(2-Hydroxyethyl)piperazin-1yl] Ethanesulfonic Acid His Poly-histidine
IPTG Isopyl-beta-D-thyogalactopyranoside K-EGTA K-Egtazic Acid
Kid Kinesin-like DNA Binding Protein KIFS Kinesin Superfamily Proteins KHC Kinesin-1 Heavy Chain KSP Kinesin Spindle Protein LB Luria-Bertani
LDH Lactate Dehydrogenase
MCAK Mitotic Centromere-Associated Kinesin MES 2-(N-Morpholino) Ethanesulfonic Acid MKLP-1 Mitotic Kinesin-Like Protein 1
MME Monomethyl Ether
MMT Methylcyclopentadienyl Manganese Tricarbonyl MOPS (3-N-Morpholino) Propanesulfonic Acid
mRNA Messenger RNA
MTOC(s) Microtubule organizing centre(s)
NADH Nicotin Amide Adenine Dinucleotide (Reduced) NCBI National Center for Biotechnology Information Ncd Non-claret disjunctional
NLS Nuclear Localization Signal OD Optical Density
P-loop Phosphate-Binding Loop
PAGE Polyacrylamide Gel Electrophoresis PDB Protein Data Bank
xxii
PK Pyruvate Kinase
PMSF Phenyl-Methane Sulfuryl Fluoride RNA Ribonucleic Acid
SDS Sodium Dodecyl Sulphate SUMO Small-Ubiquitin-Related Modifier TAE TRIS-Acetate-EDTA
TB Terrific Broth
TLRR Testis Leucine-rich Repeat Protein TRIS Tris(hydroxy-methyl)aminoethane tRNA Transfer RNA
UV Ultraviolet
1
1. Introduction
Normal cellular function and morphology are dependent of intracellular transport (Miki et al., 2005). Most proteins are actively transported by molecular motors along cytoskeletal filaments to their site of function in the cell (Hirokawa and Tanaka, 2015; Hirokawa et al., 2009).
Three large superfamilies of molecular motors are involved in intracellular transport and work by associating with and moving along cytoskeleton filaments — dyneins, myosins and kinesins (Hirokawa et al., 2009; Kolomeisky, 2013). Dyneins move along microtubule (MT) tracks towards their minus-end and drive motility of cilia and flagella, intracellular transport and are involved in cellular division (Kolomeisky, 2013; Roberts et al., 2013; Schliwa and Woehlke, 2003). They are processive molecular motors meaning that they are able to take hundreds of discrete steps in the cytoskeleton before dissociating from it (Kolomeisky, 2013). Myosins move along actin filaments and are responsible for muscle contraction and short-range transport beneath the plasma membrane (Gross, 2004; Hirokawa et al., 2009). They are non-processive molecular motors since they typically make only one or few steps before detaching from their tracks, working in large groups in the cells to fulfil their functions. On the other hand, Kinesins transport cargo along MTs in a processive manner, being essential for proper cellular function and morphology, and have important roles during cellular division (Kolomeisky, 2013; Miki et al., 2005). They use the chemical energy of adenosine triphosphate (ATP) hydrolysis to drive internal conformational changes that generate motile force to fulfil a diverse set of functions in the cell (Kolomeisky, 2013).
1.1. Kinesin superfamily
In 1985 a motile protein was extruded from the cytoplasm of the giant axon of the squid. The purified protein is now known as kinesin-1 (Kolomeisky, 2013). For years, kinesin-1 was the only motor protein known that moved towards the MT plus-end. However, in the 1990s, many kinesin-related proteins were found by sequence homology relating to kinesin-1 heavy chain, Drosophila melanogaster’s KHC. Later, screening for proteins containing the highly conserved motor domain of the kinesin family, revealed a large number of kinesin-related proteins in other organisms, including humans (Kolomeisky, 2013).
Kinesins (KIFs) form a superfamily of more than 650 members identified to date in all eukaryotes (Kozielski, 2015). Currently, there are 15 phylogenetic groups termed kinesin-1 to kinesin-14B (Hirokawa and Tanaka, 2015; Hirokawa et al., 2009) and several ungrouped kinesins. Till date there are as many as ~45 kinesin-like proteins in humans (Kolomeisky, 2013).
Introduction
2 In general, N-type kinesins and C-type kinesins drive MT plus end- and minus end-directed motilities, respectively, and M-type kinesins depolymerize MTs (Hirokawa et al., 2009; Sablin, 2000).
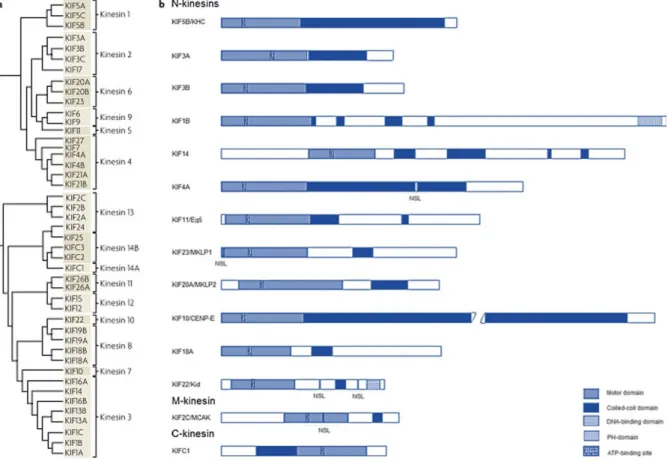
Figure 1.1: The structure and phylogeny of major KIFs. a) A phylogenetic tree of major KIFs, which are classified into 15 families; b) The functional and structural domains of major KIFs. In general, kinesins comprise a motor domain and a coiled-coil domain. Some also contain specific domains or regions, such as the pleckstrin homology (PH) domain of KIF1B, the DNA binding domain of kinesin-like DNA binding protein (Kid), and nuclear localization signals (NLSs) of KIF4A, Mitotic Kinesin-Like Protein 1 (MKLP-1), Kid, and Mitotic Centromere-Associated Kinesin (MCAK). CENP-E refers to Centrosome-associated Protein E. Adapted from Hirokawa and Tanaka, 2015; Yu and Feng, 2010.
1.1.1. Structural characteristics of kinesins
The ‘conventional’ kinesin (known as KIF5/kinesin-1) is a heterotetrameric protein with two heavy chains (110-120 kilo Daltons (kDa)) and two light chains (60-70 kDa). KIFs can have one of five possible conformations: monomers (KIF1), homodimers, heterodimers, heterotrimers (KIF3 has two distinct heavy chains, KIF3A and KIF3B, and one light chain, KAP3) and heterotetrameric (KIF5) (Seog et al., 2004).
All KIFs contain a motor domain, also referred to as the head, where the biochemical reactions are catalysed, usually attached to a stalk and tail (Endow et al., 2010; Kolomeisky, 2013).
Introduction
3 helix α2 and contains a highly conserved GxxxxGKT/S motif that forms the phosphate-binding loop (P-loop), which binds tightly to the β-phosphate of the nucleotide. Two other motifs, conserved from G-proteins, switch I (α3-L9-α3a) and II (L11, α4-L12-α5), change in conformation during the ATP hydrolysis cycle (Endow et al., 2010; Marx et al., 2009).
Since the motor domain is conserved in all KIFs, motor directionality is determined by the region adjacent to the motor core, the neck (Endow et al., 2010; Sablin, 2000). In contrast to the core, the neck is not similar in all KIFs. In C-type kinesins, the neck is helical and N-terminal to the core. In N-type kinesins, the neck is C-terminal to the core and includes a small β-sheet, known as the neck linker (NL), and an additional coiled coil helix called the neck coiled coil. In M-type kinesins, the neck is helical and N-terminal to the core (Miki et al., 2005; Sablin, 2000).
The α-helical stalk mediates oligomerization. It also coordinates the head, allowing processivity, and, along with the tail, may be involved in regulation of the motor. For example, the kinesin-1 stalk contains a flexible region – the hinge – that lets the tail fold back onto the head, inhibiting MT-binding (Endow et al., 2010; Sablin, 2000).
One of the functions of the tail is to bind to cargo, which is essential for transport, but has been less studied than the head and stalk. The light chains can exist in different isoforms that arise by alternative splicing which permits binding to different vesicles and organelles. Furthermore, adaptor proteins that bind kinesins to specific cargo have also been identified. For example, the adaptor protein Milton mediates kinesin-1 binding to mitochondria, process that is inhibited by Ca2+. Other molecules facilitate kinesin-1 binding to endosomes, vesicles and organelles (Endow et al., 2010).
1.1.2. Motility of kinesins
Kinesin-1 is highly processive motor taking more than hundred steps by a ‘hand-over-hand’ mechanism each time it binds to a MT. Each step is ~8 nanometres and requires the hydrolysis of one ATP molecule (Endow et al., 2010; Schief and Howard, 2001).
On the other hand, Kinesin-14 Non-claret disjunctional (Ncd) (homolog to human HSET/KIFC1) is non-processive meaning it binds to the MT, hydrolyses a single ATP and then detaches (Endow et al., 2010; Schief and Howard, 2001). Multiple Ncd molecules probably act in arrays in vivo to functionally crosslink and slide MTs (Endow et al., 2010).
MCAK and other kinesin-13 motors, instead of moving directionally on MTs, bind them and diffuse to the plus- or minus-ends where they promote depolymerisation. The divergent motility mechanisms of KIFs reflects their diverse cellular functions (Endow et al., 2010).
Introduction
4 the MT, and a one–head-bound (1-HB) state, where a single head (tethered head) remains free. The processivity is allowed by gating mechanisms that maintain the catalytic cycles of the two heads out of phase (Milic et al., 2014). The NL is a key structural element for this coordination. In the 1-HB state, a conformational change of the NL is induced by nucleotide binding, immobilizing it against the MT-bound catalytic domain (Endow et al., 2010; Milic et al., 2014). This “NL docking” promotes unidirectional motility by biasing the position of the tethered head towards the next MT binding site (Milic et al., 2014). Although NL docking was present in some crystal structures, its role in generating force is controversial because it occurs with a small free energy change. Alternatively, the ‘cover strand’, a structural element at the N-terminus of the motor, was proposed act together with the NL when docking onto the catalytic domain to drive kinesin-1 steps along MTs – hypothesis that has been supported by mutant analysis showing that the cover strand is essential for kinesin-1 motility. Furthermore, mutating a head interacting conserved neck residue causes Ncd to move in either direction of MTs, proving the neck determines directionality (Endow et al., 2010). The completion of a step requires the tethered head to bind the MT, ATP hydrolysis, and trailing head detachment, thereby returning the motor to the ATP-waiting state (Milic et al., 2014). The Mg2+ ion of the active site is important for ATPase activity and for establishing this ADP-trapped state, in which Mg2+ADP is stably bound to the active site. Purified KIFs (and most kinesins crystal structures) tend to retain Mg2+ADP in their active sites since, in absence of MTs, the ATPase cycle pauses at this state (Cross and McAinsh, 2014).
The opposite directions of motion of conventional kinesin and Ncd dimers may be explained by the major differences between their structures. The kinesin dimer is asymmetric, with its two heads well separated and rotated by about 120°, while the Ncd dimer structure is symmetric, with the catalytic cores positioned much closer to each other. The tethered heads of kinesin and Ncd with bound heads positioned similarly on MTs, point towards the MT plus-end and minus-end, respectively, indicating that the different symmetries lead them to position the unbound heads in the direction of their movement. This specific positioning of the tethered heads is determined by their distinct neck regions (Sablin, 2000). The kinesin neck consists of a NL followed by a neck coiled coil which are connected by short loops while the Ncd neck forms a parallel coiled coil completely helical (Jana et al., 2012; Sablin, 2000). The different architectures of the necks respond and transmit the nucleotide-binding information differently to the partner heads, enabling movement in opposite directions along the MT. In opposition to the NL-docking that occurs for kinesin, in Ncd, nucleotide binding induces small structural changes that are amplified to the neck and stalk, which rotate, resulting in a power stroke towards the minus-end of MTs (Kull and Endow, 2013; Szcz̧sna and Kasprzak, 2012).
M-kinesins do not possess traditional motor activity as they function as ATP-dependent MT-destabilizing enzymes. MT depolymerisation may be induced by conformational chances caused by the energy of kinesins specific binding and not from ATP hydrolysis, as this is needed for dissociating M-kinesins from the complex with tubulin dimers (Sablin, 2000).
1.1.3. Functions of kinesins
Introduction
5 and adaptor proteins and signalling-pathway-interacting proteins. As such, it can transport diverse cargos and spatially regulate signal transduction (Endow et al., 2010; Hirokawa, 2011).
Synapse generation and maintenance of synaptic transmission depend highly on molecular motors (Hirokawa, 2011). Kinesin-1 has been implicated in Alzheimer, Huntington and Parkinson disease (Endow et al., 2010). It transports synaptic vesicle precursors and membrane organelles that contain presynaptic plasma membrane proteins, such as syntaxin 1 and SNAP25 (Hirokawa et al., 2009). The kinesin 3 family motors KIF1A and KIF1Bβ also transport synaptic vesicle precursors that contain synaptophysin, synaptotagmin and the small GTPase RAB3A (Endow et al., 2010; Hirokawa, 2011). Another kinesin, KIF17, transports vesicles containing NMDA-type glutamate receptors to dendrites and was proved to have a role in learning and memory (Hirokawa, 2011).
KIFs are also involved in transport inside the cell body of neurons and non-neuronal cells. Specifically, they transport lysosomes, endosomes and cargo from the Golgi to the Endoplasmic Reticulum (ER) and from the Trans-Golgi Network (TGN) to the plasma membrane. For instance, the kinesin-3 family motor KIF13A binds to β1-adaptin, a subunit of the AP-1 complex that is engaged in vesicular transport from the TGN to the plasma membrane. KIF5 also transports a post-Golgi traffic marker, vesicular stomatitis virus G protein (VSVG), towards the plasma membrane (Hirokawa et al., 2009).
Additionally, KIFs regulate transport inside cilia and flagella. For example, kinesin-2 heterotrimeric motors are involved in intraflagellar transport (IFT) needed for formation and maintenance of flagella and cilia, which are essential to many human cells for generation of motility, fluid flow and mechanochemical sensation (Endow et al., 2010; Hirokawa et al., 2009). Furthermore, the heterotrimeric KIF3 complex (KIF3A/KIF3B/KAP3) functions both in IFT of ciliary components and in the exclusion of oncoproteins from the perinuclear region. It prevents the accumulation of the N-cadherin/β-catenin complex in the cytoplasm and nucleus that would enhance canonical Wnt signalling facilitating cell proliferation and reducing cell–cell adhesion by N-cadherin, transforming neuroepithelial cells into tumours (Hirokawa, 2011).
KIFs also have essential functions in both mitosis and meiosis by assembling spindles, separating centrosomes and attaching chromosomes to spindles (Endow et al., 2010; Miki et al., 2005). They produce tension on kinetochore fibres, disassemble kinetochores and depolymerize MTs driving chromosomes to move to the poles during anaphase. Female sterility, cell cycle arrest or cell death are common consequences of mutation of KIFs (Endow et al., 2010).
Introduction
6
1.2. Human KIFC1
Kinesin-14 family members are C-terminal motor proteins, which move towards the minus-end of MTs in an ATP-dependent, non-processive manner (Braun et al., 2013; Xiao and Yang, 2016). In humans, this family comprises only three known elements: KIFC1 (HSET), KIFC2, and KIFC3. Focus has been on KIFC1, which has a function in mitotic spindle organization. Homologues of human KIFC1 include Ncd in Drosophila sp., XCTK2 in Xenopus sp. and Kar3 in Saccharomyces sp. (Xiao and Yang, 2016).
1.2.1. Structural organisation of human KIFC1
Structurally, kinesin-14 motors, including KIFC1, have a homodimeric conformation and each monomer has a C-terminal conserved kinesin-like motor domain, a central coiled-coil stalk, and an N-terminal tail (Figure 1.2) (Cai et al., 2009; Wu et al., 2013; Yang et al., 2014). The motor domain processes an ATP-dependent MT-binding site and the tail possesses a second MT-binding site that binds MT in an ATP-independent fashion, which enables kinesin-14 family members to cross-link and slide MTs (Cai et al., 2009).
As referred in section 1.1.2., the KIFC1 homologue Ncd dimer structure is symmetric, with the catalytic cores positioned much closer to each other when compared to kinesin-1. Furthermore, also unlike kinesin-1, the Ncd neck is entirely helical forming a parallel coiled coil (Jana et al., 2012; Sablin, 2000).
Figure 1.2: Diagrammatic representation of Ncd. Ncd has three distinct domains: an N-terminal tail is followed by a central stalk, which is joined to the globular C-terminal motor domain. The proposed functions of each of the domains are listed. The structure of the tails is based on the predicted amino acid sequence of Ncd. Adapted from Chandra et al., 1993.
1.2.2. Functions of KIFC1
The human kinesin-14 KIFC1, in vivo, is predominantly present in MT lattices where it cross-links MTs and, during mitosis, regulates spindle length by sliding MTs relative to each other (Braun et al., 2013).
Introduction
7 found to be co-localized with KIFC2 and dynein during endocytic vesicle transport in human liver cells (Xiao and Yang, 2016).
One of the most important mammalian processes that require KIFC1 is spermatogenesis. It has vital roles in acrosome biogenesis and nucleus deformation. In the first case, KIFC1 helps in Golgi apparatus transport through its vesicle association tail domain. In the second case, with the aid of testis leucine-rich repeat protein (TLRR), KIFC1 coordinates the positioning of the regulatory factors on the nuclear membrane that mediate the deformation of the nucleus and even facilitate acrosomal biogenesis (Xiao and Yang, 2016).
KIFC1 also has a central role in oocyte division and embryonic development (Xiao and Yang, 2016). Specifically, in oocytes, cells devoid of centrosomes, KIFC1 is indispensable for assembling a fusiform bipolar spindle (Pannu et al., 2015). Moreover, KIFC1, along with KIF17 is periodically expressed in the early stage human placenta, rising suspicion of a role in gestation (Xiao and Yang, 2016).
Finally, it has been reported that KIFC1 actively transports and binds double-stranded deoxy-ribonucleic acid (DNA) (dsDNA) (Farina et al., 2013; Pannu et al., 2015; Xiao and Yang, 2016). Gene therapy relies on transportation of exogenous DNA into the nucleus. Yet, whether this occurred by diffusion or via motor transport remained unknown until a study demonstrated that the motility of DNA in HeLa cells in vitro dramatically decreased in the absence of KIFC1 (Farina et al., 2013; Xiao and Yang, 2016).
1.2.3. KIFC1 as a novel target for cancer chemotherapy
Introduction
8 signals such as DNA-damage, is essential for the viability of cancer cells bearing extra centrosomes (Pawar et al., 2014; Xiao and Yang, 2016). This results in lower missegregation levels allowing survival of cancer cells with a certain degree of genetic instability, augmenting the likelihood of mutation and enhancing tumour malignancy (Xiao and Yang, 2016).
A model was proposed to explain KIFC1’s role in this process. Centrosome amplification occurs during interphase causing a transient multipolar spindle during prometaphase. This creates chromosome instability. Then, a merotelic kinetochore attachment to MTs forms and begins driving centrosome clustering. Shortly afterwards, syntelic attachments with kinetochores (in which both sister kinetochores interact with MTs that emanate from the same spindle pole (Gregan et al., 2011)) further promote formation of the pseudo-bipolar spindles and centrosome clustering. During this process, KIFC1, which binds to plus ends of the MTs, crosslinks and then slides along the antiparallel MTs while it moves towards the spindle pole, creating MT locking forces that cause centrosomes to cluster together. Increased expression of some cyclins causes an anaphase delay giving KIFC1 the time required to transform the transient multipolar spindle into a bipolar spindle, whilst shortening the whole cell cycle (Xiao and Yang, 2016). Furthermore, KIFC1 protects cancer cells surviving signals, further enhancing malignancy – it is capable of binding to survivin, inhibiting its poly-ubiquitination and subsequent degradation, therefore, protecting the cells from apoptosis. At the point of mitotic exit, KIFC1 is degraded (Mittal et al., 2016; Xiao and Yang, 2016).
KIFC1 is abundantly expressed in cancer cells of the ovary, breast, bladder, lung, kidney and other cancers (Mittal et al., 2016; Pannu et al., 2015; Pawar et al., 2014; Xiao and Yang, 2016). Particularly, in non-small-cell lung cancer (NSCLC), KIFC1 is an indicator of brain metastasis by real-time quantitative reverse transcriptase PCR screening analysis (Pannu et al., 2015; Pawar et al., 2014; Xiao and Yang, 2016). Likewise, KIFC1 is also reported as a candidate for a prognostic and metastases onset biomarker in ovarian cancers. Details on the role of KIFC1 in metastasis are still unknown but suspicion is that its function in the survival of multi-centrosome cells enhances cancer cell polarity, hence powering the epithelial-mesenchymal-transition (EMT) and cell motility (Mittal et al., 2016; Pawar et al., 2014; Xiao and Yang, 2016).
Moreover, KIFC1 is among the factors relating to drug resistance in breast and prostate cancer. Docetaxel, along with paclitaxel, bind to β-tubulin to prevent the depolymerisation of MTs disrupting their proper dynamics (Kozielski, 2015; Xiao and Yang, 2016). KIFC1, along with three other KIFs, KIFC3, KIF1A, and KIF5A, were found to be overexpressed in docetaxel resistant breast cancer cell lines, indicating that the binding of KIFs to MTs opposes the stabilizing effect of the drug. This suggests that a combination therapy of kinesin inhibitors and taxol could potentially overcome resistance (Kozielski, 2015; Pannu et al., 2015; Xiao and Yang, 2016). Consistently, inhibiting both KIFC1 and MCAK has been seen to increase prostate cancer cells’ sensitivity to taxane (Xiao and Yang, 2016).
(kinesin-Introduction
9 5 family) and CENP-E (kinesin-7 family) have proceeded into clinical trials and positive reports have been published (Xiao and Yang, 2016). Now, the focus in this area falls upon KIFC1 due to the fact that it is indispensable for survival of cancer cells regardless of normal or supernumerary centrosome number (Kozielski, 2015; Li et al., 2015; Xiao and Yang, 2016). However, the other roles that KIFC1 plays during vesicular and organelle trafficking, spermatogenesis, oocyte development and dsDNA transportation, raise concerns about using KIFC1 inhibitors medically. These concerns could be disregarded since KIFC1 is actually dispensable in ordinary somatic cells which have only one pair of non-supernumerary centrosomes, as KIFC1 and NuMA are thought to be redundant in MT minus-end organization (Xiao and Yang, 2016). It is also reported that the viability of non-multiple centrosome MCF-7 cell lines is not significantly influenced by depletion of KIFC1 (Kwon et al., 2008; Xiao and Yang, 2016; Yang et al., 2014). As such, KIFC1 is a particularly interesting therapeutic target because normal cells division does not require it and KIFs are amenable to inhibition by small molecules (Kwon et al., 2008).
To this point, three small-molecule KIFC1 inhibitors were found (Xiao and Yang, 2016). Two directly inhibit KIFC1, AZ82 and CW069, causing centrosome de-clustering in cancer cells with amplified centrosomes (Pawar et al., 2014; Xiao and Yang, 2016). AZ82 binds to the KIFC1-MT complex, inhibiting the binding of ATP and release of ADP. When cancer cells with extra centrosomes are treated with AZ82, fatal multipole spindles appear (Wu et al., 2013; Xiao and Yang, 2016; Yang et al., 2014). In addition, a study showed AZ82 yielded high and sustained exposure in mouse after intraperitoneal injection, being, therefore, suitable for further in vivo studies (Yang et al., 2014). However, an overdose of AZ82 can lower the selective efficiency of the drug. CW069 is a highly selective small-molecule KIFC1 inhibitor with an affinity to the loop-5 cleft of the motor domain, which disrupts KIFC1’s motility. CW069 proved lethal to breast cancer cell lines while the spindle shape of normal dermal fibroblast cells was not significantly altered. In addition, the specificity of CW069 is sufficient to avoid any mitotic phenotype that would occur upon the inhibition of kinesin spindle protein (KSP) even though it has up to 80% similarity with KIFC1. This makes its action more predictable making it a desirable clinical drug candidate (Xiao and Yang, 2016). Another inhibitor, PJ34, may also be a promising option. KIFC1’s messenger ribonucleic acid (RNA) (mRNA) level is shown to be significantly reduced in various PJ34 treated breast cancer cell lines, suggesting PJ34 transcriptionally suppresses expression of KIFC1 (Li et al., 2015; Xiao and Yang, 2016).
1.3. Aims of the project
KIFC1 is considered as a potential and novel target for drug development in cancer chemotherapy. The overall goal of this project was to determine the structure of the KIFC1 motor domain for future structure-based drug-design.
The first aim was to clone, express and purify the human KIFC1 motor domain (KIFC1-MD) in large amounts and high purity.
11
2. Materials and Methods
2.1. Materials
2.1.1. Consumables
The pDHT-2 vector, ppSUMO-2 vector and pDHT-KIFC1-MD plasmid were provided by GenScript® (for details on vectors and predicted KIFC1-MD amino acid sequence see Attachments sections 7.1 and 7.2, respectively). Escherichia coli (E. coli) DH5α, BL21 (DE3), RosettaTM BL21 (DE3) and RosettaTM BL21 (DE3) pLysS cells were bought from Novagen. E. coli BL21 Codon Plus (DE3) RIPL Cells were obtained from Agilent Technologies (for details on E. coli strains see section 7.3). The following kits were obtained from Qiagen®: Hi-Speed Plasmid Midi Kit, Gel Extraction Kit, MiniPrep Kit and Ni(II)-Nitrilotriacetic Acid (Ni2+-NTA) columns. CutSmart Buffer (10x concentrated), Restriction Enzymes (XhoI at 20.000 U/mL and NcoI at 10.000 U/mL), 1kb DNA ladder (500 µL/mL), Purple Gel Loading Dye (6x concentrated) and Pre-Stained Protein ladder (11-245 kDa) were bought from New England Biolabs® Inc. SyBrSafe Dye and Protein Loading Dye (4x concentrated) were obtained from InvitrogenTM. DNA Rapid Ligation Kit was obtained from Roche Diagnostics, Bugbuster Reagent was bought from Milipore Corp., Instant BlueTM was obtained from Expedeon Ltd. and 1x Bradford Reagent was bought from BIO-RAD®. SnakeSkin® Dialysis Tubing 10 kDa was obtained from Thermo Scientific. His-trapTM FF Crude 5 mL, 96 clear wells Microplates, Masterblock 96 well 2 mL and 96 wells microplate µClear® were bought from Greiner Bio-One. Amicon® Ultra-15 Centrifugal Filter Ultracel® 3 kDa was obtained from Milipore Corp. ASNA Screen, RdRP Screen and PEG ION Screen were provided by Dr. Sandeep Talapatra. MORPHEUS® Screen, JCSG® Screen, PACT® Screen and PGA® Screen were bought from Molecular Dimensions. MRC 3 drop plates (96 wells), ClearVueTM Sheets, MORPHEUS® 1 M Buffer System 2 pH 7.5 (1 M Sodium 2-[4-(2-hydroxyethyl)piperazin-1-yl]ethanesulfonic acid (HEPES) and 1 M 3-(N-morpholino)propanesulfonic acid (MOPS)), MORPHEUS® Ethylene Glycols Mix (0.3 M di-ethylene glycol, 0.3 M tri-ethylene glycol, 0.3 M tetra-ethylene glycol, and 0.3 M penta-ethylene glycol), 24 Well Linbro Plates and Microbridges were also obtained from Molecular Dimensions. 22 mm circular coverslips were bought from Jena Bioscience©. PD10 3 mL Desalting column was bought from GE Healthcare Life Sciences. Ulp1 (5 mg/mL), Mg2+ATP (100 mM), Phosphoenolpyruvate (PEP) (200 mM), reduced Nicotinamide adenine dinucleotide (NADH) (70 mM), Pyruvate kinase (PK) (10 mg/mL) and Lactate dehydrogenase (LDH) (5 mg/mL) were all provided by Sigma-Aldrich®. Additional materials can be found in Attachments section 7.4.
2.1.2. Equipment
Materials and Methods
12 (Sinteck Instruments), Mosquito® LCP Robot (Labtech Ltd), Absorbance Microplate Reader (TECAN). Other equipment included: Agarose gel Tank and Power Supply, Sodium Dodecyl Sulfate (SDS)-Polyacrylamide Gel Electrophoresis (PAGE) Gel Electrode Chamber, Tank and Power Source, Sonicator (Model CL-18) and Variable Flow Mini-peristaltic Pump, microscope, protein crystals collection loops, loop holding packs and Synchrotron.
2.1.3. Software packages
The following software packages were utilized:
Hampton Make Tray Website (https://hamptonresearch.com/make_tray.aspx) ImageJ, which can be downloaded from https://imagej.nih.gov/ij/download.html
KaleidaGraph, which can be downloaded from http://www.synergy.com/wordpress_ 650164087/kaleidagraph/free/
BLAST® tool in National Center for Biotechnology Information (NCBI) Website (https://blast.ncbi.nlm.nih.gov/Blast.cgi?PROGRAM=blastp&PAGE_TYPE=BlastSearch&LINK_LOC=b lasthome)
2.1.4. List of buffers
The following buffers were used:
Tris(Hydroxy-Methyl)Amino-Methane (TRIS) – Acetate – Ethylene-Diamine-Tetra-Acetic acid (EDTA) (TAE) Buffer 1x: 40 mM TRIS (pH 7.6), 20 mM Acetic acid, 1 mM EDTA
TRIS-Glycine-SDS Buffer 1x: in 1 L there is: 3 g TRIS, 14.4 g Glycine and 1 g SDS
Small-scale purification buffers:
Lysis Buffer/Equilibrium Buffer: 50 mM TRIS, pH 8.0, 500 mM NaH2PO4, 300 mM NaCl, 10 mM Imidazole
Wash Buffer: 50 mM TRIS, pH 8.0, 500 mM NaH2PO4, 300 mM NaCl, 25 mM Imidazole Elution Buffer: 50 mM TRIS, pH 8.0, 500 mM NaH2PO4, 300 mM NaCl, 300 mM Imidazole
Large-scale purification buffers:
Lysis Buffer: 50 mM TRIS pH 7.5, 300 mM NaCl, 10 mM Imidazole, 10 % Glycerol Wash Buffer: 50 mM TRIS pH 7.5, 300 mM NaCl, 1 mM MgCl2, 30 mM Imidazole
Elution Buffer: 20 mM HEPES pH 7.5, 500 mM NaCl, 0.01% Tween-20, 250 mM Imidazole Dialysis Buffer: 50 mM TRIS pH 7.6, 150 mM NaCl, 1 mM MgCl2, 5% Glycerol
Gel Filtration Buffer: 20 mM HEPES pH 7.6, 500 mM NaCl, 0.01% Tween-20
Desalting Buffer: 20 mM HEPES, pH 7.6, 250 mM NaCl, 0.01% Tween-20
Materials and Methods
13
2.2. Methods
2.2.1. Transformation for obtaining plasmid DNA (pDNA) and protein expression
Respective E. coli competent cells were thawed on ice for 10 min. 1 μL of each pDNA was added separately to 100 μL of the respective competent cells (Table 2.1) and left for 30 min on ice (for details on vectors and E. coli strains used see Attachments sections 7.1 and 7.3). The cells were heat-shocked at 42ºC for 45 s and immediately transferred to ice to recover for 2 min. 200 μL of pre-warmed (37ºC) Luria-Bertani (LB) medium were added to each of the tubes. The cells were incubated for 1 h at 37ºC and 700 rotations per min (rpm). The cells were pipetted onto Kanamycin supplemented LB agar plates, spread using a sterile spreader and incubated overnight at 37ºC to obtain colonies.
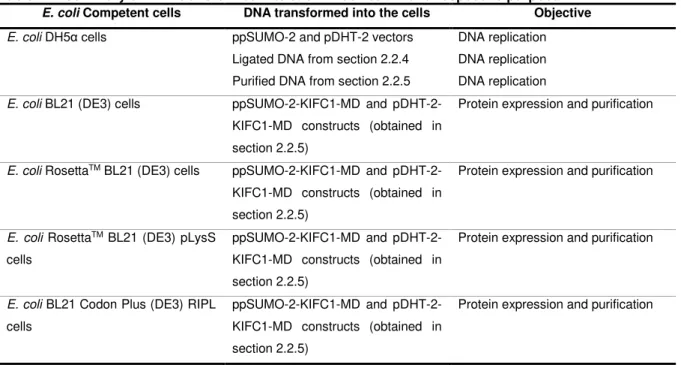
Table 2.1: Summary of DNA transformed into each E. coli strain and respective purpose.
E. coli Competent cells DNA transformed into the cells Objective
E. coli DH5α cells ppSUMO-2 and pDHT-2 vectors
Ligated DNA from section 2.2.4 Purified DNA from section 2.2.5
DNA replication DNA replication DNA replication
E. coli BL21 (DE3) cells ppSUMO-2-KIFC1-MD and
pDHT-2-KIFC1-MD constructs (obtained in section 2.2.5)
Protein expression and purification
E. coli RosettaTM BL21 (DE3) cells ppSUMO-2-KIFC1-MD and
pDHT-2-KIFC1-MD constructs (obtained in section 2.2.5)
Protein expression and purification
E. coli RosettaTM BL21 (DE3) pLysS
cells
ppSUMO-2-KIFC1-MD and pDHT-2-KIFC1-MD constructs (obtained in section 2.2.5)
Protein expression and purification
E. coli BL21 Codon Plus (DE3) RIPL
cells
ppSUMO-2-KIFC1-MD and pDHT-2-KIFC1-MD constructs (obtained in section 2.2.5)
Protein expression and purification
2.2.2. Midi-prep protocol for pDNA purification
Materials and Methods
14 with 3.5 mL of isopropanol. The pDNA was eluted with 5 mL of buffer QF into this falcon, mixed and incubated at RT for 5 min. The plunger from a 20 mL syringe was removed and the QIAprecipitator Midi Module attached onto the outlet nozzle. The eluate/isopropanol mixture was transferred into the 20 mL syringe and the plunger inserted to filter the eluate/isopropanol mixture using constant pressure. The QIAprecipitator was removed from the syringe and the plunger pulled out. The QIAprecipitator was re-attached and 2 mL of 70% ethanol were added to the syringe. The pDNA was washed by inserting the plunger and pressing the ethanol through using constant pressure. The QIAprecipitator was removed from the 20 mL syringe and the plunger pulled out. The QIAprecipitator was re-attached, the plunger inserted, and the membrane dried by pressing air through the QIAprecipitator quickly and forcefully, four times. The outlet nozzle of the QIAprecipitator was dried with absorbent paper to prevent ethanol carryover. The plunger was removed from a new 5 mL syringe and the QIAprecipitator attached onto the outlet nozzle. 1 mL of buffer TE was added to the 5 mL syringe, the plunger was inserted and the pDNA eluted into a microtube, using constant pressure. The eluate was transferred back into the 5 mL syringe and eluted for a second time into the same 1.5 mL microtube. The pDNA was stored at -20ºC.
2.2.3. Restriction and purification of the restricted DNA
45 L of each pDNA (vectors ppSUMO-2 and pDHT-2 and pDHT-KIFC1-MD plasmid), 5.5 L of CutSmart buffer and 2 L of each of the NcoI and XhoI restriction enzymes were mixed in microtubes and incubated for 2 h at 37C. 5 μL of 6x sample loading dye were added to each of the restriction reactions. Each sample/sample loading buffer mixture, as well as 15 µL of 1 kb DNA ladder, were pipetted into separate wells in a 1% agarose gel stained with SyBrSafe Dye and covered with TAE buffer 1x. The gel was run at 200 V and 125 mA. The gel was observed under Ultraviolet (UV) light using the U:GENIUS3 Gel imaging System to visualise DNA bands. Then, the desired bands were cut from the gel to extract the restricted DNA. The rest of the protocol was performed with the Gel Extraction Kit. 550 μL of QG buffer were added to each cut from the gel placed in microtubes and were incubated at 65ºC until the gel dissolved. The solutions were transferred to the purification columns and centrifuged at 10000 rpm for 2 min. 700 μL of PE buffer were added and the columns were centrifuged at 10000 rpm for 1 min. The columns were dried by spinning-down at 10000 rpm for 2 min. To elute the DNA, 50 μL of EB buffer were added and incubated for 1 min after which the columns were centrifuged at 10000 rpm for 1 min. The results from the agarose gel were analysed with the ImageJ software.
2.2.4. Ligation and transformation of restricted DNA
Materials and Methods
15
2.2.5. Purification of ligated pDNA using the Mini-Prep Kit
Only the ratios 1:10 and 1:20 for both vectors resulted in colony growth. As such, 4 colonies of each of these were used for this protocol. The colonies were grown in suspension in 5 mL of LB medium supplemented with 5 μL of Kanamycin at 37ºC at 200 rpm overnight. The cultures which grew after overnight incubation were then spun-down for 10 min at 4000 rpm at 4°C and the supernatant discarded. The Qiagen® MiniPrep Kit was used to purify the pDNA. The bacterial pellets were re-suspended in 250 µL of cold buffer P1 and transferred into microtubes. 250 µL of buffer P2 was then added and mixed by inversion. Thereafter, 350 µL of buffer N3 were added and the solution was mixed by inversion. The tubes were centrifuged for 10 min at 10000 rpm. The supernatants were applied to QIAprep spin columns that were centrifuged for 60 s at 10000 rpm. The QIAprep spin columns were washed by adding 500 µL of buffer PB and centrifuging for 60 s and then adding 750 µL of buffer PE and centrifuging for 60 s. The empty QIAprep spin columns were centrifuged at 10000 rpm for an additional 2 min to remove residual wash buffer. To elute the pDNA, 50 µL of buffer EB were added to each QIAprep spin column placed in clean microtubes which were incubated for 1 min and then centrifuged for 1 min.
2.2.6. Diagnostic restriction, transformation for protein expression and
purification and Midi-prep protocol for pDNA purification
To 15 L of each purified pDNA, 2 L of CutSmart buffer, 0.3 L of each of the NcoI and XhoI restriction enzymes and 7.4 µL of distilled water were added. The mixture was incubated for 1 h at 37C. The samples were then run on a 1% agarose gel as described in section 2.2.3. The gel image was taken as described in section 2.2.3 to find the positive colonies where the ligation had worked. It was also determined qualitatively which sample had yielded the larger amount of pDNA. The mini-prep samples with maximum amount of positive pDNA were selected for transformation: ppSUMO-2-KIFC1-MD 1:20 colony 3 and pDHT-2-KIFC1-MD 1:10 colony 2 (section 3.2). Thereafter, the purified pDNA was transformed into E. coli competent cells using the protocol described in the section 2.2.1. The Midi-Prep Protocol described in section 2.2.2. was used to purify the pDNA from the E. coli DH5α cells.
2.2.7. Small-scale protein expression and purification
Materials and Methods
16 Ni2+-NTA columns were equilibrated with 500 µL of small-scale Equilibrium buffer/Lysis buffer and centrifuged at 4500 rpm for 1 min. The samples were then transferred to the Ni2+-NTA columns, incubated on ice for 5 min and then centrifuged at 3000 rpm at 4ºC for 2 min. The Ni2+-NTA columns were washed three times with 500 µL of small-scale Wash buffer (see section 2.1.4.) by centrifuging at 3000 rpm at 4ºC for 2 min. The protein samples were eluted into new microtubes by adding 150 µL of small-scale Elution buffer (see section 2.1.4.), incubating on ice for 2 min and then centrifuging at 3000 rpm for 2 min at 4ºC. The protein elutes were transferred back to the same Ni2+ -NTA columns and incubated again on ice for 2 min, then centrifuged again. This step was repeated four times in total. 5 μL of 4x Loading Dyewere added to 25 μL of the protein samples obtained above and the mixture, along with 7 µL of Pre-Stained Protein Ladder (11-245 kDa), were loaded on a 12% SDS-PAGE gel covered in TRIS-Glycine-SDS buffer 1x. The gel was run at 180 V and 125 mA for 45 min to 1 h. The gel was stained with Instant BlueTM. To de-stain the gel, it was washed with distilled water a couple of times and then placed on the shaker overnight. The gel was analysed with the ImageJ software. The cells with maximum protein expression as observed on the gel (qualitatively) (E. coli BL21 (DE3) and E. coli BL21 Codon Plus (DE3) RIPL with ppSUMO-2-KIFC1-MD, section 3.3.1) were subjected to cleaving of the Poly-Histidine (His) and Small-Ubiquitin-Related Modifier (SUMO) tags. For this, to 40 μL of each of the protein solutions, 8 μL of Ulp1 protease(5 mg/mL) were added. The samples were incubated overnight at 4ºC. 5 μL of 4x Loading Dye were added to the uncleaved and cleaved protein samples and to 8 μL of Ulp1 sample and, along with 7 µL of Pre-Stained Protein ladder (11-245 kDa), were loaded on a 10% SDS-PAGE gel. The gel was run, stained, distained and analysed as described before in this section. The cells with maximum protein expression as observed qualitatively on the gels were selected for large scale expression (sections 3.3.1 and 3.3.2).
Table 2.2: Antibiotic supplements provided for each E. coli strain. For details on the E. coli strains used see
Attachments section 7.3.
E. coli cells Antibiotic Supplement
E. coli BL21 (DE3) cells Kanamycin (50 mg/mL)
E. coli RosettaTM BL21 andRosettaTM BL21 pLysS cells Kanamycin (50 mg/mL) and Chloramphenicol (34 mg/mL)
E. coli BL21 Codon Plus (DE3) RIPL cells Kanamycin (50 mg/mL), Streptomycin (50 mg/mL) and
Chloramphenicol (34 mg/ mL)
2.2.8. Large-scale protein expression and purification
2.2.8.1. Large-scale KIFC1-MD expression
Materials and Methods
17 were collected by re-suspending in 100 mL of large-scale Lysis buffer (see section 2.1.4.), snap-frozen in liquid nitrogen and stored at -80ºC for subsequent purification.
2.2.8.2. First purification step by nickel-affinity column
The frozen pellet was thawed in warm water and then placed on ice. 1 mM of Phenyl-Methane Sulfonyl Fluoride (PMSF) was added to the mixture of pellet and Lysis buffer, which was then sonicated with the Soniprep 150, for 10 rounds, with cycles of 30 s ON and 45 s OFF. The cells were centrifuged for 1 h 15 min at 4ºC at 20000 rpm in an Avanti® J-E Centrifuge with a 25.5 JA rotor. The supernatant from the centrifugation was loaded into the His-trapTM FF Crude 5 mL column pre-equilibrated with 50 mL of Lysis buffer (see section 2.1.4.) and the flow-through was collected. The column was thereafter washed with large-scale Wash buffer (see section 2.1.4.) for around 50 Column Volume (CV) and the flow-through collected into a bottle. The protein was eluted with large-scale Elution buffer (see section 2.1.4.) in 2 mL fractions. The protein elution was qualitatively checked with Bradford reagent by mixing 10 μL of eluted sample from each well with 100 μL Bradford. To check for the protein from this affinity purification, samples were run on a 12% SDS-PAGE gel as described in the section 2.2.7. Additionally, the percentage of purification of the target protein was determined with recourse of ImageJ software.
To perform the next step of cleavage of the fusion tag, the amount of protein obtained was measured using Braford reagent and the following formula:
𝑚𝑔 𝑚𝐿=
𝑂𝐷595
µ𝐿 𝑜𝑓 𝑝𝑟𝑜𝑡𝑒𝑖𝑛 𝑢𝑠𝑒𝑑𝑥16, where OD595 corresponds to the optical density measured at 595λ.
Ulp1 protease was used in the ratio of 1 mg for each 50 mg of protein. 3 mM Dithiothreitol (DTT) were also added to the cleavage solution. At the same time of protein cleavage, the protein was dialysed overnight against 1 L of Dialysis buffer (see section 2.1.4.) using a 10 kDa SnakeSkin® Dialysis membrane, at 4ºC, overnight, to remove excess imidazole for subsequent purification step.
2.2.8.3. Second purification step by nickel-affinity column
The dialysed protein was loaded into the pre-equilibrated His-trapTM FF Crude 5 mL column followed by 20 CV wash and subsequent elution as mentioned above in section 2.2.8.2. All of the different fractions were collected separately and the protein concentration determined using Bradford reagent. To verify for protein cleavage success and protein purity level, samples were run on a 12% SDS-PAGE gel. The gel was run, stained, distained and analysed as described in section 2.2.8.2.
2.2.8.4. Final purification step by gel filtration
Materials and Methods
18 gel to check for the quality of the protein. The protein fractions with >90% purity were concentrated to ~16 mg/mL and supplemented with 2 mM ADP and 20 mM MgCl2. The protein samples were then snap frozen in liquid nitrogen in 50 µL aliquots for future crystallisation trials.
The large-scale expression/purification protocol was repeated as requirement for new protein emerged. The following differences occurred: 1) due to equipment failure, in batches Nº 2-3, gel filtration was made in a column with lower resolution for separation (XK 16/100); 2) in batches Nº 2-3, the protein was not supplemented with ADP or MgCl2; 3) in batches Nº 2-5 the elution fractions volumes changed to 5 mL. The results of KIFC1-MD batches Nº 2-5 can be seen in Attachments sections 7.5-7.8 and the calibration curves for each gel filtration column used can be found in Attachments sections 7.9-7.10.
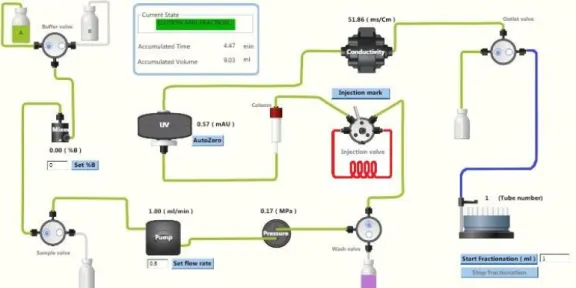
Figure 2.1: Scheme representing the process of gel filtration. The equilibration process is represented in green. The path for injection of the sample corresponds to the green and red marked tubing. During elution, the sample follows the green marked route, except for the outlet valve that switches to the collection tubes, as marked in blue. As the sample elutes from the column, a U.V. profile is traced by the ÄKTA start machine by measuring the absorbance at 280 nm.
2.2.9. Crystallisation trials using a nanodrop robot
Nanodrop crystallisation trails (100 nL:100 nL) were set up using the Mosquito® LC Robot for KIFC1-MD at 8 mg/mL and 16 mg/mL for 7 different screens (MORPHEUS®, JCSG®, PACT®, PGA®, PEG ION, ASNA and RdRP Screens) at two different temperatures (18ºC and 4ºC). The presence/absence of crystals was verified by observing the plates under the microscope frequently for about 2.5 months after the setup.
A second crystallisation screen was prepared similarly, after the failure to reproduce the crystals in optimization plates Nº 2-11 (section 2.2.12), with the following differences: 1) instead of drops with different protein concentrations, 100 nL:100nL and 200 nL:100 nL protein:well solution ratios were created, with protein at 16 mg/mL; 2) only one set of screens was prepared, to be incubated at 4ºC.
2.2.10. Determination of KIFC1-MD crystal type and quality
Materials and Methods
19 immediately placed into a loop holding pack in liquid nitrogen and sent to measure at the Synchrotron. Diffraction data for individual crystals was collected at beamlines at Diamond Light Source. Table 2.3 shows the cryoprotectant used for each crystal and where it was measured. Each diffraction pattern obtained allowed to determine if the crystals were protein or salt crystals and how well they diffracted. Data was processed using the CCP4 suite (Winn et al., 2011). An attempt to solve the structure of KIFC1-MD was made for the crystal with 3.2Å resolution (see table 3.1) by molecular replacement (PHASER MR in CCP4 suite) (Protein Data Bank (PDB) code 2REP as a search model). Electron density and difference density maps, all σA-weighted, were inspected, and the models were improved using Coot from CCP4 suite. The calculation of Rfree used 5% data.
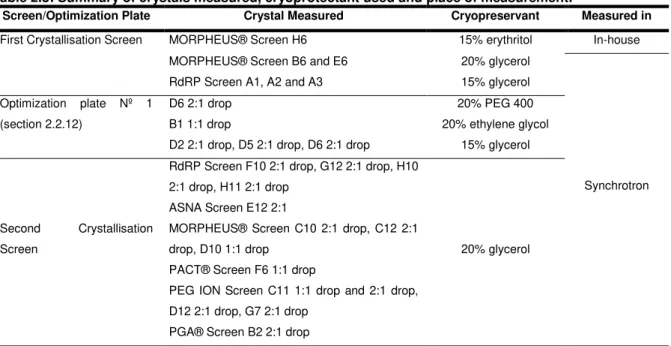
Table 2.3: Summary of crystals measured, cryoprotectant used and place of measurement.
Screen/Optimization Plate Crystal Measured Cryopreservant Measured in
First Crystallisation Screen MORPHEUS® Screen H6 15% erythritol In-house
MORPHEUS® Screen B6 and E6 20% glycerol
Synchrotron
RdRP Screen A1, A2 and A3 15% glycerol
Optimization plate Nº 1 (section 2.2.12)
D6 2:1 drop 20% PEG 400
B1 1:1 drop 20% ethylene glycol
D2 2:1 drop, D5 2:1 drop, D6 2:1 drop 15% glycerol
Second Crystallisation
Screen
RdRP Screen F10 2:1 drop, G12 2:1 drop, H10 2:1 drop, H11 2:1 drop
20% glycerol ASNA Screen E12 2:1
MORPHEUS® Screen C10 2:1 drop, C12 2:1 drop, D10 1:1 drop
PACT® Screen F6 1:1 drop
PEG ION Screen C11 1:1 drop and 2:1 drop, D12 2:1 drop, G7 2:1 drop
PGA® Screen B2 2:1 drop
2.2.11. Desalting of KIFC1-MD
The PD10 gravity flow desalting column was initially equilibrated using Desalting buffer (see section 2.1.4.). 1 mL of the protein (KIFC1-MD batch Nº 5) was loaded into the column. The protein was then eluted with 3 mL of the Desalting buffer. As the protein was diluted in the process it was concentrated back to ~1 mL and the protein concentration was remeasured to be ~11 mg/mL.
2.2.12. Optimization of the crystallisation conditions from nanodrops to
microdrops
Materials and Methods
20 Table 2.4: Summary of optimization plates setup. Protein batch used, type of drops created, temperature of incubation, aim of the setup and number of table where the respective conditions can be found are indicated.
Optimization Plate Number (Nº) Protein Batch Type of drops
Temperature Aim Notes Table with
condition set
1 1
Sitting drops; Hanging drops
1:1, 2:1 4ºC
Optimization of the
MORPHEUS® Screen (First Screen) conditions where crystals were found
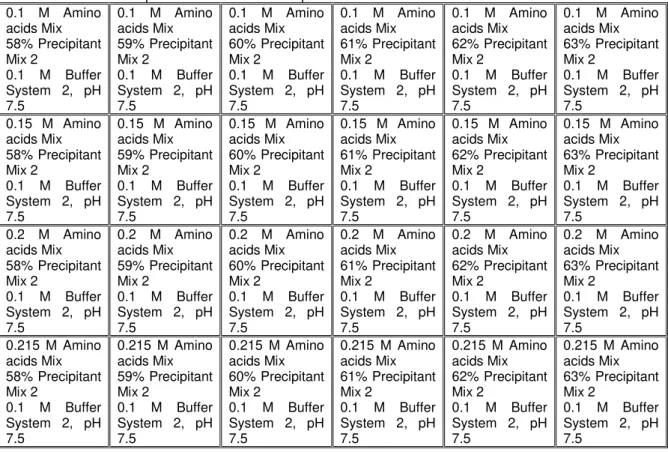
Amino acids Mix without alanine
2.5
2 1 Hanging
drops 1:1, 1.5:1, 2:1
Optimization of the D6 well condition of plate Nº 1
2.6
3 2 Smaller variations of the D6
condition due to lack of crystals in plate Nº 2
2.7
4 2 10ºC
5 2 Hanging
drops 1:1, 2:1
4ºC
Repeat plates Nº 1 and 3 to exclude experimental error as cause of lack of crystals
2.5
6 2 2.7
7 2
Sitting drops; Hanging drops 1:1, 2:1
Optimization of the RdRP Screen (first screen) where larger crystals were found (A1-A3)
--- 2.8
8 3
Hanging drops 1:1, 2:1
Assess the role of ADP and MgCl2
in crystallisation success
Amino acids Mix without alanine
2.9
9 3 2.10
10 4 Repeat plates Nº 1 and 2 to
assess the effect of higher purity in crystallisation success
Amino acids mix with alanine
2.5
11 4 2.6
12 4 and 5
Optimization of the RdRP Screen (second screen) conditions where crystals were found; Assess
batch variation effect in
crystallisation success
--- 2.11
13 4 and 5
Optimization of the PEG ION Screen (second screen) G7 condition where crystals were found
--- 2.12
14
5 desalted
Repeat plate Nº 1 to assess if lowering salt concentration of protein solution would allow to decrease solubility and reach supersaturated state required for crystal formation
Amino acids mix with alanine