M
ASTER OF
S
CIENCE IN
F
INANCE
M
ASTERS
F
INAL
W
ORK
P
ROJECT
E
QUITY
R
ESEARCH
-
EDP
R
ENOVÁVEIS
J
OSÉ
A
NTÓNIO
C
ORTE
-R
EAL
G
ARCIA
G
UERRA
M
ASTER OF
S
CIENCE IN
F
INANCE
M
ASTERS
F
INAL
W
ORK
P
ROJECT
E
QUITY
R
ESEARCH
-
EDP
R
ENOVÁVEIS
J
OSÉ
A
NTÓNIO
C
ORTE
-R
EAL
G
ARCIA
G
UERRA
S
UPERVISOR:
P
ROFESSORD
R.
C
ARLOSM
ANUELC
OSTAB
ASTARDOii Abstract
EDPR is a company that operates in the sector of the renewable energy and it is today one of the most important working in this area. Its main goal consists on being a reference in the industry for developing, building and operating the best wind farms and solar plants in the world. Unlike many other companies that are having some problems with the present economic framework, EDPR, by investing in a modern and most required sector, is successfully managing to overcome the difficulties and therefore it is building a significant and solid growth.
The elaboration of this study has the aim to achieve the intrinsic value of EDPR stocks, by making a research of the operational performance and its exogenous environment. The method adopted in order to determine this value consists on the Free Cash Flow to Firm, since, according with the literature review, this is the most suitable one to apply to EDPR.
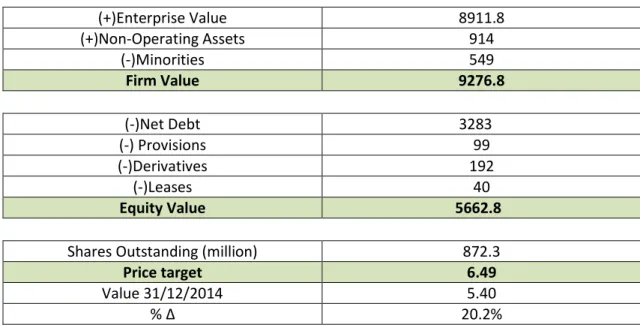
The valuation performed led to the conclusion that on 31/12/2014, EDPR shares had an intrinsic value of € 6.49, being thus undervalued, since its quotation was € 5.40 at the time referred to. Therefore, with a potential appreciation of 20.2%, it was able to give a buy recommendation to the interested investors.
Keywords: Equity Research; Renewable Energy Sector; EDPR; Free Cash Flow to Firm; Enterprise Value; Equity Value
iii Acknowledgments
I would like to thank my advisor, Professor Carlos Bastardo, for accepting to conduct my thesis, for his review and critical analysis of my work and for his availability whenever I needed.
I would also like to express my deep acknowledgment to my parents, which were always present to help me, to motivate me and to give me support during the elaboration of my thesis.
iv Index Abstract………...ii Acknowledgments………iii Index………..iv Figure index……….vii Formula Index………vii Chart Index………..vii Table Index……….viii List of abbreviations………ix 1. Introduction……….1 2. Literature Review……….2 2.1 Framework……….2 2.2. Valuation Methods……….2
2.2.1. Discounted Cash Flows – DCF……….2
2.2.1.1. Equity Valuation Models………3
2.2.1.2. Firm Valuation Models………4
2.2.1.3. Adjusted Present Value Model – APV………..8
2.2.2. Relative Valuation………8
2.2.3. Contingent Claim Valuation……….9
2.2.4. Asset Based Valuation……….9
3. Company Presentation………..10
3.1. Business Portfolio……….10
3.2. Strategy………10
3.3. Operational Performance………..……….11
3.4. Market Performance………..13
4. Macroeconomic Framework and Sector Framework………..15
4.1. Macroeconomic Framework……….15
4.2. Sector Framework………18
5. Strategic Analysis………..22
5.1. SWOT……….22
v 6. Evaluation………23 6.1. Methodology………23 6.2. Assumptions……….23 6.2.1. Revenues………23 6.2.2. EBITDA Margin………26
6.2.3. Investment in fixed assets and Depreciations………..27
6.2.4. Investment in Working Capital………28
6.2.5. Minorities………..29
6.2.6. Risk-Free Asset………29
6.2.7. Cost of Debt……….29
6.2.8. Beta………30
6.2.9. Market Risk Premium………30
6.2.10. Tax rate……….30
6.2.11. Weight of Equity and Debt……….30
6.2.12. WACC……….31
6.2.13. Growth Perpetuity Rate – g………...31
6.3. FCFF of the segments……….31 7. Results………..32 8. Sensitivity Analysis………33 9. Relative Valuation……….34 10. Conclusions……….35 References………36 Appendix………41
Appendix 1 – Organization Structure of EDPR………41
Appendix 2 – Operational Performance……….41
Appendix 3 – EDPR share performance………..41
Appendix 4 – Porter Five Forces Analysis………..42
Appendix 5 – Assumptions: Revenues Europe………44
Appendix 6 – Assumptions: Revenues USA………..46
Appendix 7 – Assumptions: Revenues Brazil………46
Appendix 8 – Assumptions: EBITDA Margin Europe………..47
vi
Appendix 10 – Assumptions: EBITDA Margin Brazil………47
Appendix 11 – Assumptions: Investment in Working Capital…..………47
Appendix 12 – Assumptions: Minorities……….48
Appendix 13 – Assumptions: Cost of Debt………48
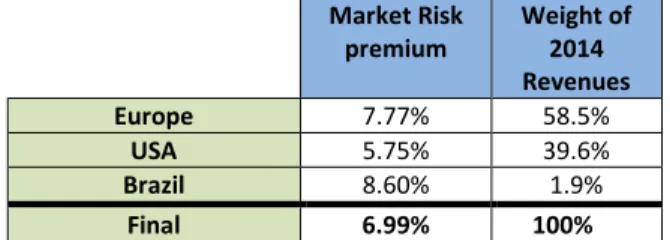
Appendix 14 – Assumptions: Market Risk Premium………..49
Appendix 15 – Assumptions: Weight of Equity and Financial Debt……….49
Appendix 16 – Non-operating Assets………50
vii Figure index
Figure 1 - Business Description……….10
Figure 2 - Business Plan 2014-17……….11
Figure 3 - Porter Five Forces Analysis………22
Formula Index Formula 1 – Equity Value: Gordon Model………..……….………3
Formula 2 – FCFE……….………..4
Formula 3 –Equity Value: FCFE………..………..4
Formula 4 – FCFF………5
Formula 5 – Entreprise Value: FCFF………..5
Formula 6 – FCFFn+1……….………….5
Formula 7 – WACC……….………5
Formula 8 – CAPM………...6
Formula 9 –Linear Regression Beta………..…………7
Formula 10 – EVA………..………8
Formula 11 – Entreprise Value: APV……….8
Formula 12 – Capex………..………28
Formula 13 –Cost of Debt……….29
Chart Index Chart 1- Installed Capacity 2013-2014……….12
Chart 2 - Net and Financial Debt 2012-2014 (€ million)………..13
Chart 3 - Share Price Performance 2014……….14
Chart 4 - EDPR Shareholders 2014………..14
Chart 5 - Renewables over total electricity generation………19
Chart 6 - Share of new power capacity installations in EU 2014………20
Chart 7 - Sources of U.S.A. electicity generation 2014……….20
viii Table Index
Table 1 - GDP change: Portugal……….15
Table 2 - GDP change: Spain………16
Table 3 - GDP change: France ………16
Table 4 - GDP change: Poland ………17
Table 5 - GDP change: Romania………17
Table 6 - GDP change: Brazil………17
Table 7 - GDP change: Mexico………18
Table 8 - GDP change: USA………..18
Table 9 - EDPR SWOT analysis………….………..22
Table 10 - Revenues Assumptions (€ million) ……….26
Table 11 - EBITDA Margin Assumptions (€ million)……….27
Table 12 - Assets Assumptions (€ million)……….28
Table 13 - Amortisations and Depreciations Assumptions (€ million)………28
Table 14 - Working Capital Investment Assumptions………29
Table 15 - Market Risk Premium Assumptions………..30
Table 16 - WACC rate………31
Table 17 - FCFF of the segments (€ million)……….31
Table 18 - EDPR Valuation (€ million) ………..32
Table 19 - Sensitivity Analysis: EBITDA Margin, WACC and g (€)………33
Table 20 - Sensitivity Analysis: EBITDA Margin and WACC (€)……….33
ix List of abbreviations
APV – Adjusted Present Value BC – Bankruptcy Costs
BR – Brazil
Capex – Capital Expenditures CAPM – Capital Asset Pricing Model CDS – Credit Default Swap
D – Debt
DCF – Discounted Cash Flow DDM – Dividend Discount Model E – Equity
EBIT – Earnings before Interest and Taxes
EBITDA – Earnings before Interests, Taxes, Depreciation and Amortization EDP – Energias de Portugal
EDPR – Energias de Portugal Renováveis EIA – U.S. Energy Information Administration ENEOP – Eólicas de Portugal
EPS – Earnings per Share EV- Enterprise Value
EVA – Economic Value Added EU – European Union
EWEA – European Wind Energy Association FCFE – Free Cash Flow to Equity
FCFF- Free Cash Flow to Firm G – Growth Perpetuity Rate GDP – Gross Domestic Product IEA – International Energy Agency
IRENA – International Renewable Energy Agency IMF – International Monetary Fund
Kd – Cost of Debt Ke – Cost of Equity
x MFS – Massachusetts Financial Services
NA – North America
NASDAQ – National Association of Securities Dealers Automated Quotations NYSE – New York Stock Exchange
PBV – Price to Book Value PEG – Price/Earnings to Growth PER – Price-to-earnings-ratio PP – Percentage Point
PPA – Power Purchase Agreements PSR – Price to Sales ratio
PTC – Production tax Credits PV – Present Value
REN21 – Renewable Energy Policy Network for the 21st Century RES – Renewable Energy Source
Rf – Risk free rate
SOTP – Sum-of-the-Parts
SWOT – Strengths, Weaknesses, Opportunities and Threats T – Tax rate
USA – United States of America UK – United Kingdom
VTS –Value of Tax Shields
1 1. Introduction
The goal of this work consists on performing an equity research of the company EDPR and to determine the intrinsic value of its stocks on the date of 31/12/2014. In order to accomplish this project, it is necessary to analyze all the internal and external variables that can influence its value. So, at an internal level, it will be necessary to study the financial data, the different areas of business and the strategy that the company is developing and, at an external level, it will have to be considered the macroeconomic scenario and the industry in which the company operates.
EDPR is a global company, which works on the sector of the renewable energy. Its activities consist on developing, building and operating wind farms and solar plants in the world. It assumes a green concept in what respects the environment and at the same time defends self-sustainability regarding its own founding. It has become a leader in a sector that shows high perspectives of growth, in the near future.
The structure of this work is organized in six parts:
i) In the first part a literature review is undertaken, where different valuation methods are presented and explained, according to essential publications covering the area;
ii) Then, a presentation of EDPR follows, where its strategy, its different areas of business, operational performance and share performance are approached in detail;
iii) Afterwards, the macroeconomic and industry framework of the countries in which EDPR is present is briefly analyzed;
iv) A SWOT analysis and an analysis at Porter five forces are performed; v) In this section, the financial data are studied, prior theoretical
assumptions explained and the valuation method chosen is applied; vi) Finally, results are achieved and a sensitivity analysis is performed as well
as a relative valuation, that may help to confirm the results, allowing for recommendations to be given to the future investors.
2 2. Literature Review
2.1 Framework
Valuation plays a very important role in the financial world, since it is responsible for a significant task that consists on assigning a value to a certain firm. Its utility has different purposes concerning the financial area to be dealt with, and the three areas where it can be applied are the Portfolio Management, Mergers and Acquisitions and Corporate Finance (Damodaran 2002).
In the case of Portfolio Management, valuation is important for the active investors, since it will help them to manage their portfolio. In the acquisition analysis, valuation will be essential for both the bidding firm and the target firm, since both have to achieve what they consider to be a fair value. Finally, valuation has an important role in corporate finance too, since it is necessary to determine the value of a firm before and after the implementation of a strategy, so that its results can be tested (Damodaran 2002 and 2006).
Although, several models were developed aiming to turn valuation into a tool as objective as possible, there is still always some variables that escape these models and need to be considered in order to improve the final result (Goedhart et al 2010).
2.2. Valuation Methods
There are several methods that can be used in order to proceed to the valuation. According to Damodaran (2002), the following ones that are to be approached are also the most important and correspond to the Discounted Cash Flows, the Relative Valuation, the Contingent Claim Valuation and the Asset Based Valuation.
2.2.1. Discounted Cash Flows – DCF
Discounted cash flow valuation describes the value of an asset by estimating the cash flows it will create in the future and then discounting them at a discount rate that correspond to the flows risk (Fernández 2002). The methods most commonly used for valuing firms by discounting cash flows will achieve similar values, since they analyze the same reality and they differ only in the cash flows taken as the starting point of the valuation. (Fernández 2009). Though Booth (2002), Cooper and
3 Nyborg (2006) warned about the possibility of some invalid results, due to the inconsistent application of its assumptions, Kaplan and Ruback (1995) state that the discounted cash flow valuation methods are the ones that provide the best and more reliable estimations. According to Damodaran (2002), the DCF models that need to be enhanced are: the Equity Valuation Models; the Firm Valuation Models; the Adjusted Present Value Model.
2.2.1.1. Equity Valuation Models
This kind of models is defined by applying the valuation to the equity stake of a firm. Thus, the value of the firm can be reached through discounting expected cash flows to equity at the rate required return for the firm (ke-cost of equity) (Fernández 2002).The Models that are included in this section are the Dividend Discounted Model (DDM) and the Free Cash Flow to Equity (FCFE).
Dividend Discounted Model – DDM
In the section of the equity valuation models, the simplest one that can be used corresponds to the DDM (Damodaran 2002). It states that valuing a stock consists on the present value of the expected dividends, discounted at a rate that corresponds to the cost of equity – ke (that represent the riskiness of the cash flows).
Regarding different assumptions about the future growth, several sub models were developed. According to Damodaran (2002), the Gordon Growth Model (1962), which borrowed deeply from the work presented by Williams (1938) and Durand (1957), is used to value a firm in a "steady state", with dividends growing at a rate (g) that can be held forever. The Gordon model is more adapted to a context where firms are growing at a rate comparable or lower than the nominal growth in the economy and with well-defined payout policies for the future. Nevertheless its simplicity results at the same time, in its major limitation, since it has a high sensibility to the inputs of the growth rate.
[1]
𝑉𝑎𝑙𝑢𝑒 𝑜𝑓 𝑆𝑡𝑜𝑐𝑘 =𝐸𝑥𝑝𝑒𝑐𝑡𝑒𝑑 𝐷𝑖𝑣𝑖𝑑𝑒𝑛𝑑𝑠 𝑜𝑓 𝑛𝑒𝑥𝑡 𝑝𝑒𝑟𝑖𝑜𝑑 𝑘𝑒− 𝑔
4 A more complex model called Two Stage Dividend Discount Model was developed, whose main feature is its two stages of growth, since there is an initial one where the growth rate is not stable and then a steady state where the growth rate is stable and is expected to remain so for the long term. This model suits firms having a high growth, and that anticipate keeping that growth for a certain time period, until the reasons of this high growth vanish. However, its main limitation relies on its assumptions, since it is not easy to measure the extension of the growth period. Like the Two stage Dividend Model, the H model, developed by Fuller and Hsia (1984) is a two-stage model for growth, but in this case the growth rate in the initial growth phase is not constant and it decreases linearly over time to achieve the stable growth rate in a steady stage. Since this model incorporates a gradual reduction of the growth rates over time, it is more applicable to firms that are growing quickly, but are expected to decrease slowly over time, with the increase of the firm and reduction of the differential advantage over the other firms/competitors.
Free Cash Flow to Equity – FCFE
This model, unlike Dividend Discount Models, considers a wider concept and idea of cash flows to equity, since the cash flows used have in consideration the financial obligations, (debt payments, after covering capital expenditure and working capital needs). In other words, the FCFE models use the discount potential dividends rather than the actual dividends (Damodaran 2002).
[2] [3] 𝐹𝐶𝐹𝐸 = 𝑁𝑒𝑡 𝐼𝑛𝑐𝑜𝑚𝑒 − (𝐶𝑎𝑝𝑖𝑡𝑎𝑙 𝐸𝑥𝑝𝑒𝑛𝑑𝑖𝑡𝑢𝑟𝑒𝑠 − 𝐷𝑒𝑝𝑟𝑒𝑐𝑖𝑎𝑡𝑖𝑜𝑛) −(𝐶ℎ𝑎𝑛𝑔𝑒 𝑖𝑛 𝑁𝑜𝑛 𝑐𝑎𝑠ℎ 𝑊𝑜𝑟𝑘𝑖𝑛𝑔 𝐶𝑎𝑝𝑖𝑡𝑎𝑙) +(𝑁𝑒𝑤 𝐷𝑒𝑏𝑡 𝐼𝑠𝑠𝑢𝑒𝑑 − 𝐷𝑒𝑏𝑡 𝑅𝑒𝑝𝑎𝑦𝑚𝑒𝑛𝑡𝑠) 𝐸𝑞𝑢𝑖𝑡𝑦 𝑉𝑎𝑙𝑢𝑒 = ∑ 𝐹𝐶𝐹𝐸𝑡 (1 + 𝑘𝑒)𝑡 𝑡=∞ 𝑡=1
2.2.1.2 Firm Valuation Models
The Firm Valuation Model is characterized by applying the discounted cash flow valuation to value the entire firm, which includes not only the equity, but also the other claimholders of the firm (Damodaran 2002). The most significant models are the Free Cash Flow to Firm (FCFF) and Economic Value Added (EVA).
5 Free Cash Flow to Firm – FCFF
The FCFF consists on the sum of the cash flows to all claimholders in the firm, including stockholders, bondholders and preferred stockholders (Damodaran 2002). Therefore, the FCFF are the operational cash flows that can be represented as:
[4] 𝐹𝐶𝐹𝐹 = 𝐸𝐵𝐼𝑇(1 − 𝑡𝑎𝑥 𝑟𝑎𝑡𝑒) + 𝐷𝑒𝑝𝑟𝑒𝑐𝑖𝑎𝑡𝑖𝑜𝑛 − 𝐶𝑎𝑝𝑖𝑡𝑎𝑙 𝐸𝑥𝑝𝑒𝑛𝑑𝑖𝑡𝑢𝑟𝑒 − ∆ 𝑊𝑜𝑟𝑘𝑖𝑛𝑔 𝐶𝑎𝑝𝑖𝑡𝑎𝑙
According to Fernández (2007), the stages that need to be followed in order to perform a valuation by this method are: undertake a historic and strategic analysis of the company and the industry, integrating two parts - the financial analysis and the strategic and competitive analysis; elaborate projections of future flows, in which the financial forecasts and the strategic and competitive forecasts are performed; determine the value of the WACC; estimate the net present value of future flows; finally make the interpretation of the results.
Enterprise Value
The enterprise value of a firm is based on one of the papers of Miller and Modigliani (1958), in which they state that the value of a firm can be obtained as the present value of its after-tax operating cash flows. Since then, a more complex model was developed and its calculation is divided in two periods, since it is considered that a firm will reach a steady state after n years and then it will start to grow at a stable growth rate (Damodaran 2006).
[5] [6] 𝐸𝑛𝑡𝑒𝑟𝑝𝑟𝑖𝑠𝑒 𝑉𝑎𝑙𝑢𝑒 = ∑ 𝐹𝐶𝐹𝐹𝑡 (1 + 𝑊𝐴𝐶𝐶)𝑡 𝑡=𝑛 𝑡=1 + 𝐹𝐶𝐹𝐹𝑛+1⁄(𝑊𝐴𝐶𝐶 − 𝑔) (1 + 𝑊𝐴𝐶𝐶)𝑛 𝐹𝐶𝐹𝐹𝑛+1= 𝐹𝐶𝐹𝐹𝑛× (1 + 𝑔) WACC
The Weighted Average Cost of Capital consists on the weighted average of equity, debt and preferred stocks, which are the sources where a firm can raise its money.
[7] 𝑊𝐴𝐶𝐶 = 𝐸
𝐸 + 𝐷× 𝑘𝑒+
𝐷
6 The mistakes in the calculation of WACC, and subsequent wrong valuation, are common, and in order to prevent them, it is required a right interpretation and use of its variables (Fernández 2011). The WACC approach is intuitive, easy to use and also efficient when the assumption that the capital structure will not change in the future, can be made (Bienfait 2005). Milles and Ezzell (1980) defend too that only when a fixed structure of capital exists, should this method be used.
WACC variables
Cost of Equity – ke
The cost of equity can be achieved by using a Risk and Return Model, and the main ones consist on the CAPM - Capital Asset Price Model, developed by Sharpe (1964), the APT - Arbitrage Price Model, developed by Ross (1976) and the Multi-Factor Models, in which the Fama-French (2004) three factor model highlights. They all need the same three inputs, which correspond to the Risk-free rate, the beta and the risk premium. According to Goedhart et al (2010), the CAPM is the most used model, for its reliability and efficiency.
[8] 𝐸(𝑅𝑖) = 𝑅𝑓+ 𝛽𝑖(𝐸(𝑅𝑚) − 𝑅𝑓)
Risk free rate – Rf
The risk free rate has to be a default-free government zero coupon rate matched up to when the cash flows that are being discounted occur. Moreover, it is important that the currency of the risk free rate should be the same as the cash flows currency (both need to be in real or nominal terms) (Damodaran 2008 and Fernández and Bilan 2007).
Beta
The most used method to estimate the beta consists on making a regression on the returns of any asset against the returns of an index representing the market portfolio, over a reasonable time period (Damodaran 1999).
7
[9] 𝐸(𝑅𝑖) = 𝛼 + 𝛽𝑖× 𝐸(𝑅𝑚)
The choice of a market index, time period and return interval will constitute one of the limitations of regressing the betas, since they are going to vary, very much due to how the regression is defined (Fernández 2008). There are three alternatives to the regression betas: the modified regression betas, that reflect the firm current operating and financial features; the use of a measure of relative risk, without the use of historical prices on the stock and index; and finally the estimation of the bottom-up betas, that represent the business a firm is operating in and its current financial leverage (Damodaran 1999).
Risk Premium
Risk premiums are quite important since they reflect the assumptions that are made about the level of risk seen in a market and what value should be attributed to that risk. The main categories are historical and implied equity premiums. The historical premium, which corresponds to the difference between the actual returns earned on stocks over a long time period and the actual returns earned on a default-free asset, is easy to use and constitutes the preferred one. The difficulties in getting reliable information in the markets create some limitations to this approach. However, Damodaran (2015) provides a solution that consists on determining the historical premium of a developed country and add the risk premium of the country in question. The Implied Equity Premium does not use historical data and assumes that the market is correctly priced. Therefore, it has the advantage of not using the historical context and reflects the current market perceptions.
Cost of Debt – kd
The Cost of debt, which measures the current cost to the firm of borrowing finance projects, can be determined through the risk free rate, the default risk of a firm and the tax advantage associated with debt (Damodaran 2002). The cost of debt for firms will increase whenever the risk free rate and the default risk of a firm increase. However, the simplest way for estimating the cost of debt occurs when a firm has long term bonds outstanding that are widely traded (Damodaran 2006). The market
8 price of the bond, in conjunction with its coupon and maturity can serve to compute a yield that is used as cost of debt.
Economic Value Added – EVA
According to Damodaran (2002), the EVA is a measure of surplus value created on an investment, and it is calculated as the product of the “excess return” made on an investment and the capital invested in that investment.
[10] 𝐸𝑉𝐴 = (𝑅𝑒𝑡𝑢𝑟𝑛 𝑜𝑛 𝐶𝑎𝑝𝑖𝑡𝑎𝑙 𝐼𝑛𝑣𝑒𝑠𝑡𝑒𝑑 − 𝐶𝑜𝑠𝑡 𝑜𝑓 𝐶𝑎𝑝𝑖𝑡𝑎𝑙) × (𝐶𝑎𝑝𝑖𝑡𝑎𝑙 𝐼𝑛𝑣𝑒𝑠𝑡𝑒𝑑) = 𝐴𝑓𝑡𝑒𝑟 𝑡𝑎𝑥 𝑜𝑝𝑒𝑟𝑎𝑡𝑖𝑛𝑔 𝑖𝑛𝑐𝑜𝑚𝑒 − (𝐶𝑜𝑠𝑡 𝑜𝑓 𝐶𝑎𝑝𝑖𝑡𝑎𝑙) × (𝐶𝑎𝑝𝑖𝑡𝑎𝑙 𝐼𝑛𝑣𝑒𝑠𝑡𝑒𝑑)
Nowadays, this is a widely used method that can lead to conclusions consistent with DCF valuation. However, its simplicity can bring some problems, since managers can take advantage of its limitations, like the ability to trade off less growth in the future for higher economic value added today and shift to riskier investments.
2.2.1.3. Adjusted Present Value Model – APV
The Adjusted Present Value Model (APV), presented initially by Myers (1974), values the firm in separate parts, starting with its operations and then summing the effects of debt and other non-equity claims. In other words, the first task to do is to value the firm, with the assumption that it was only financed with equity, and then adding the value of debt, by considering the present value of the tax benefits that flow from debt and the expected bankruptcy costs (Damodaran 2006).
[11] 𝐸𝑛𝑡𝑒𝑟𝑝𝑟𝑖𝑠𝑒 𝑉𝑎𝑙𝑢𝑒 = ∑ 𝐹𝐶𝐹𝐹𝑡 (1 + 𝑘𝑢)𝑡+ 𝐹𝐶𝐹𝐹𝑛+1× (𝑘𝑢− 𝑔) (1 + 𝑘𝑢)𝑛 + 𝑃𝑉(𝑉𝑇𝑆) − 𝑃𝑉(𝐵𝐶) 𝑖=𝑛 𝑡=1
According to Luehrman (1997), despite its difficulty of being executed, the APV is the most reliable, realistic and better method to use. That happens due to its value additivity assumption that allows the managers to look at the firm in different perspectives and give them more objective information about its operation.
2.2.2. Relative Valuation
To achieve the value of a firm, relative valuation establishes a parallel between a firm and other possible comparable firms. Therefore, with the underlying
9 assumption of market efficiency, the value of a firm is obtained by first selecting a group of comparable firms. Then, it is observed how similar they are priced and thereafter the prices are standardized, by converting them into multiples (Damodaran 2002). Moreover, using different multiples leads to different valuation numbers, and according to each firm sector there is a suitable and more appropriate one to use (Jindal 2011). Fernández (2015) states that despite multiples broad dispersion might be a problem, it constitutes an useful tool in a second stage of the valuation, after performing it with the discounted cash flow method. That happens since the comparison of the multiples of similar firms allows standardizing the valuation performed and it points out differences among the firm values of the comparable firms. The main multiples used in relative valuation are: PER – Price-to-Earnings Ratio; PBV Price-to-Book Ratio; PSR – Price-to-Sales Ratio; EV/EBITDA - Enterprise Value to EBITDA; PEG – Price/Earnings to Growth Ratio.
2.2.3. Contingent Claim Valuation
This type of valuation states that the value of a firm may not be greater than the present value of the expected cash flows, if the cash flows are contingent on the occurrence or non-occurrence of an event (Damodaran 2006). The method followed consists on having an asset with the features of an option that is valued using an option pricing model, like the Black Scholes. According to Luerhman (1997), despite being a better method to follow, this type of valuation is less intuitive and it is hard to perform its application to corporate problems.
2.2.4. Asset Based Valuation
The valuation based on the Asset Based Valuation Model uses the assets owned by a firm to estimate its value. The main models used in this type of valuation are the liquidation value and the replacement cost. The first can be achieved by aggregating the estimated sale proceeds of the assets owned by a firm and the second evaluates what would be the cost to substitute all the assets of a firm. Damodaran (2002) did not considered this method to be an alternative to the discounted cash flow, relative or option pricing models because both liquidation and replacement value can only be achieved by using one of the models previously referred to.
10 3. Company Presentation
EDP Renováveis (EDPR) is a company within the universe of the EDP group that deals with the area of renewable energy. Since 1996 EDP, the major shareholder of EDPR, develops wind farms, but only in 2008 was EDPR founded and listed publicly.
Nowadays, EDPR is a global company, with two main parts: EDPR Europe & Brazil headquartered in Madrid, which deals with the European and Brazilian assets and the EDPR North America, headquartered in Houston, which manages the assets of United States, Canada and Mexico. However, it concentrates its activities mainly in Portugal, Spain, France, Poland, Romania, United States and Brazil (Appendix 1).
3.1. Business Portfolio
The main activities of EDPR consist on managing the development, the construction and the operation of its wind farms and solar plants. In the development phase, EDPR team of qualified workers tries to find a place with a renewable resource (solar or wind) and close electricity transmission lines, that can ensure the possibility of high construction quality. At the construction level, the engineering and construction teams proceed to the selection and building of the best wind turbines and solar panel systems applied to each project. In the Operation phase, EDPR manages the operations stablished aiming to achieve the success of the projects, and thereby benefit its shareholders and stakeholders.
Figure 1 - Business Description
3.2. Strategy
The value creation strategy followed by EDPR from 2014 and expected to proceed until 2017 is based on three pillars: Focused Growth, Superior Profitability and Self-funding Model. Regarding the Focused Growth, EDPR defined as a goal to achieve a
Development Phase
•Site identification •Renewable resource
analysis
•Project evaluation and funding
Construction Phase
•Layout Design and equipment choice •Construction
Operation Phase
•Wind and solar plant operation
•Ongoing maintenance service
•Generate and deliver clean energy
11 long-term profitable growth by consolidating its position in the current markets, entering in new markets with high growth potential and searching growth opportunities in different renewable energy technologies. Concerning the Superior Profitability, EDPR pursues the improvement of its operational processes, the encouragement of growth and the capacity of being profitable, aiming to become the best in the sector. Towards the Self-funding Model, EDPR has been committed to increase its growth through a program of asset rotation designed to stimulate value creation. This plan excludes any rise of corporate debt and depends on the blend of cash-flow from operating assets, external funds from tax equity and other structured project finances, as well as proceeds from asset rotation transactions to finance the profitable growth of the business.
The link between EDP and EDPR is very close since the management of the second is highly influenced by the strategy defined by the first. Moreover, the acquisition of 21.35% of EDP, made by China Three Gorgeous was a relevant factor for EDPR, since the Chinese company has the financial and liquidity capacity that will help to develop the Self-funding pillar that is part of EDPR strategy.
Figure 2 - Business Plan 2014-17
3.3. Operational Performance
The consequences of the economic crisis in the energy demand added to a few regulatory obstacles created some difficulties and cuts in EDPR revenues. However, the company still maintains a growth perspective, mainly due to the success of its overseas operations (Appendix 2).
Selective Growth
Solid value creation, investing in quality projects with predictable prices by long term contracts
•Investment in quality projects •Growth in projects with
long-term contracts already awarded •Development of the offshore
project in France
Increased Profitability
Profitability growth supported by disctintive core competences and
unique know-how
•Maintaining high availability levels
•Leveraging quality growth on distinctive wind assessment •Increase of the efficiency
Self-Funding Model
Enhanced growth by an asset rotation program designed to accelerate value creation
•Strong Operating Cash-Flow generation
•Asset Rotation to enhance value growth
•Net Investment supported by Asset Rotation Program
12 -Revenues
In 2014, EDPR revenues suffered a decrease compared to 2013, mainly due to the lower selling price, although partly compensated by the 3% output increase. In Europe, the lower average selling price caused the decrease of 6% on EDPR’s average selling price, but it was balanced by the higher average selling price in North America and Brazil. Moreover, the revenues evolution in Europe was very much impacted by the operations in Spain, with the change in the assets remuneration framework, plus the unfavorable pool prices. This obstacle was only minimized by EDP´s younger assets and load factor.
-EBITDA
The EBITDA suffer a 2% decrease in 2014 comparing with the value of 2013. This happened mainly due to the regulatory changes in Spain and to the exceptional low pool prices in the first months of the year.
-Electricity Generated and Installed Capacity The EDPR’s activities in North America had an important role in the electricity production growth in 2014,
representing 52% of the total output. In Europe, the EDPR operations represented 47% of the total output. Regarding the installed capacity, there was a small decrease in North America, Spain and in the rest of Europe, and an increase in Portugal.
-Investments
EDPR defined a self-funding model from 2014 to 2017, wherein the company limits the financing of its investment plan only by the internal free cash flow from operating assets and the sale of minority stakes in its projects. Therefore, the investment plan has the target to raise € 700 million from the asset rotation proceeds that complement the amount of € 1.8 billion of operating cash flow. In the end, it will reach the final value of € 2.5 billion for the investment plan.
0% 10% 20% 30% 40% 50% Installed
Capacity 2013 Capacity 2014Installed
Portugal Spain
Rest of Europe North America Brazil
Chart 1- Installed Capacity 2013-2014
13 -Financial Debt
In 2014, the EDPR’s total Financial Debt increased by 234 million euros to 3.8 billion euros, mainly due to the US Dollar appreciation, to investments done in the period and the
proceeds from the execution of the asset rotation transactions. The main shareholder of EDPR’s - EDP group- accounted for 76% of the debt, and the loans with financial institutions represented 24%.
EDPR’s debt has a long-term profile, since 85% of the financial debt has a 2018 and beyond maturity. Furthermore, EDPR maintains a long term fixed rate funding strategy, combining the Operating Cash-Flow profile with its financial costs and thus alleviating the interest rate risk.
-Financial Structure
In 2014, the EDPR presented a debt-to equity ratio of 126%, an increase from the value of 114% in 2013. Moreover, it achieved an equity ratio of 44%, which represented a decrease comparing with the value of 47% in 2013. The Business Plan chosen by EDPR, with a self-funding model, gives it more financial autonomy and does not lead to high changes in the financial structure.
3.4. Market Performance
EDPR is a constituent of the following stock market indexes: PSI 20, PSI All-Shares (Gross Return), Euronext 100, NYSE Euronext Iberia, Bloomberg World Energy Alternative Source and NASDAQ QMX Clean Edge Global Wind Energy.
In the last 5 years, EDPR suffered some fluctuations in its share price. After a growing period registered in 2010 and 2011, the 2012 deceleration of the energy demand in the EDPR core markets, due to the broader economic crisis and to the idea of renewable energy as a costly energy source, led to a decrease in the share performance. Then, in 2013 the regulatory changes in Spain also had a substantial
2.800 3.000 3.200 3.400 3.600 3.800 4.000 2012 2013 2014 Net Debt Financial Debt
Chart 2 - Net and Financial Debt 2012-2014 (€ million)
14 impact in the financial results of
the company. Finally, in 2014 the overcome of the main difficulties and the good future perspectives led to a good performance above the market. This fact was reflected in an
increase of 40% in the share price, eventually having a better performance of the NYSE Euronext Lisbon PSI 20 and Dow Jones Eurostoxx Utilities SX6E.
In the shareholder structure of EDPR, the main shareholder is the EDP Group, with 77.5% of share capital and voting right. Apart from EDPR, the MFS Investment Management, an American global investment company, constitutes the other qualified shareholder, with 3.1% in EDP share
capital and voting right. Without the EDP group and the MFS Investment Management, the EDPR shareholders include about 81,000 institutional and private investors disperse around more than 23 countries, with more prominence in United States, United Kingdom Portugal, Australia, Norway and France.
The number of EDPR shares listed is 872.3 million, traded in NYSE Euronext Lisbon. On December 31st 2014 EDPR had a market capitalization of 4.7 billion euro, +40% above from the 3.4 billion euro at the end of 2013, and equivalent to € 5.40 per share. The EDPR’s General Shareholders Meeting approved a dividend policy to 2013-2015, which propose dividends distribution each year and will represent 25% to 35% of EDPR´s distributable profit. Thus, in 2014 it was endorsed a dividend of € 34,892,326.48, that corresponded to €0.04 per share, matching a total shareholder return of 41% (Appendix 3).
77.5% 3.1%
19.4%
EDP MFS Other
Chart 3 - Share Price Performance 2014
Chart 4 - EDPR Shareholders 2014 Source: EDPR
15 4. Macroeconomic Framework and Sector Framework
4.1. Macroeconomic Framework
A macroeconomic framework applied to the year 2014 was elaborated for the main countries where EDPR operates, by using the financial and statistical information from the International Monetary Fund (IMF).
Portugal
The recent years in Portugal were deeply affected by the consequences of the financial crisis of 2008, which led to high levels of public deficit and excessive debt. This economic situation culminated in a financial bailout, established in April 2011, and as a result a program was defined with the IMF, the European Commission and the European Central Bank. The goals appointed by this plan were the achievement of budgetary consolidation and the implementation of structural reforms, which would restore the Portuguese economy and allow future growth prospects.
The program which was finished in May 2014 brought some confidence to the Portuguese economy and allowed the reduction of the public deficit. Furthermore, with the help of the European Central Bank program, there was a substantial decrease of the Portuguese debt interests. However, at the same time the increase of taxes and the consequent decrease of the investment and consumption led to an increase of the unemployment rate to about 17% in 2012 and to a cumulated decrease of the GDP of 7.4% between 2009 and 2013.
The economic recovery of Portugal is expected to be more consistent in 2015, mainly due to a favorable external environment and a gain of confidence, both reflected in the growth of 0.9% of the GDP and in the decrease of the unemployment rate of 2%, in 2014.
Table 1 - GDP change: Portugal
Description Units 2010 2011 2012 2013 2014 2015F 2016F 2017F
Real GDP ∆% 1.90% -1.83% -4.03% -1.61% 0.90% 1.60% 1.54% 1.40%
16 Spain
Despite having suffered deeply with the financial crisis, Spain had success in the implementation of its reforms and the results are reflected on its economic recovery. In fact, after a continuous decrease of the GDP since 2010, there was a GDP growth of 1.4% and a decrease of 1.2 % in the unemployment rate in 2014, both situations being helped by stronger Euro Zone financial market conditions. Nevertheless, the level of unemployment, mainly among the youth, still presents very high levels and some specific issues in the Spanish economy, like the high public and private debts remain a problem. Thus, in the future additional fiscal measures and structural reforms are needed, in order to consolidate the economic recovery.
Table 2 - GDP change: Spain
Description Units 2010 2011 2012 2013 2014 2015F 2016F 2017F
Real GDP ∆% 0.02% -0.62% -2.09% -1.23% 1.40% 2.46% 2.05% 1.77%
France
Unlike other European states, France had a slightly better performance through this troubled period, mainly due to the resilience of private consumption, the absence of financial fragmentation and also the reduced levels of corporate debt. However, unemployment rate became high, achieving 10.3% in 2014, and at the same time a loss of competitiveness was registered in the French economy. Afterwards, a slow short-term recovery took place in France, since there was a growth in GDP of 0.29%, in 2013, and 0.36%, in 2014. Important measures like reducing the tax wedge on labor and advancing supply-side reforms are expected to help this recovery to become more consistent in the future.
Table 3 - GDP change: France
Description Units 2010 2011 2012 2013 2014 2015F 2016F 2017F
Real GDP ∆% 1.97% 2.08% 0.33% 0.29% 0.36% 1.16% 1.49% 1.70%
Poland
Having passed through an economic slowdown in the period of 2012-2013, the economy of Poland performed a progressive recovery in 2014 based on solid economic policies and continued global integration. Therefore, despite its low inflation and high unemployment, a GDP growth of 3.3% was registered and it is expected to grow 3.48% in 2015. The geopolitical situation of that region is a Source: IMF, World Economic Outlook Database Source: IMF, World Economic Outlook Database
17 problem that can cause some instability in the polish economy in the near future and therefore its probable effects should be taken into account.
Table 4 - GDP change: Poland
Description Units 2010 2011 2012 2013 2014 2015F 2016F 2017F
Real GDP ∆% 3.70% 4.76% 1.76% 1.67% 3.30% 3.48% 3.48% 3.55%
Romania
The macroeconomic policies implemented helped the Romanian economy to correct some internal and external imbalances, caused by the global crisis. The results were reflected in the GDP growth registered in 2013 and 2014, which was respectively 3.39% and 2.9%. However, weak public infrastructure and the vulnerability to external shocks are some problems that need to be considered.
Table 5 - GDP change: Romania
Description Units 2010 2011 2012 2013 2014 2015F 2016F 2017F
Real GDP ∆% -0.80% 1.06% 0.64% 3.39% 2.90% 2.70% 2.90% 3.38%
Brazil
The growth of the Brazilian economy has lost strength recently, since in 2013 the GDP had grown 2.74% and in 2014, grew 0.15%. Therefore, the previous successful measures of expanding labor income and the propitious external conditions, that had increased consumption, stimulated the economy and led to a poverty reduction, all gradually lost intensity. Furthermore, the decrease of investment, a worst business environment installed and the reduction of commodity prices were all converging factors to this deceleration. For the future, the government is planning to apply some measures in order to strengthen macroeconomic policies and restore Brazil credibility and growth.
Table 6 - GDP change: Brazil
Description Units 2010 2011 2012 2013 2014 2015F 2016F 2017F
Real GDP ∆% 7.57% 3.92% 1.76% 2.74% 0.15% -1.03% 0.98% 2.25%
Mexico
After having slow down its growth in 2013, the Mexican economy had a growth of 2.13%, in 2014. This increase was mainly explained by the recovery of the U.S. economy, that stimulated Mexico’s manufacturing production, exports and public Source: IMF, World Economic Outlook Database Source: IMF, World Economic Outlook Database
18 investment on infrastructures. Henceforth, the good prospect maintains and therefore it is expected that the Mexican GDP growth continues.
Table 7 - GDP change: Mexico
Description Units 2010 2011 2012 2013 2014 2015F 2016F 2017F
Real GDP ∆% 5.11% 4.05% 4.01% 1.39% 2.13% 3.00% 3.32% 3.52%
USA
The U.S. economy had a good performance in 2014, since it grew at a rate of 2.39%. This growth was based on an accommodative monetary policy, on a considerable reduction in the fiscal drag, and on the improvement of labor and housing conditions. On the other hand, some risks still persist, like the pace of interests’ rate increases, the market expectations and the competition caused by the growth prospects in other advanced and emerging market economies. The persistence of expansive economic policies makes believe that the U.S. economy growth will be consistent and maintained.
Table 8 - GDP change: USA
Description Units 2010 2011 2012 2013 2014 2015F 2016F 2017F
Real GDP ∆% 2.53% 1.60% 2.32% 2.22% 2.39% 3.14% 3.06% 2.66%
4.2. Sector Framework
In the recent period, wherein the 2008 financial crisis affected almost every sector of the worldwide economy, the market of the renewable energy exceeded the main expectations. This success, reflected on the substantial increase of the installed capacity of renewable technologies, is mostly founded on three reasons: a global commitment in achieving environmental targets; a policy of incentives to the sector; a significant reduction of the costs for the majority of the renewable technologies.
In order to understand more specifically the importance of the sector, it is useful to resort to the Global Status Report 2014 from the Renewable Energy Policy Network for the 21st Century (REN21). According to this report, in 2013 the renewable energy was responsible for more than 56% of net additions to global power capacity and supplied around 19% of global consumption. The recent expansion of renewable energies, not only occurred in the most developed countries, but also in the developing countries, since it was fully realized by the governments the overall Source: IMF, World Economic Outlook Database
19 importance that this type of energy can have. Moreover, the International Renewable Energy Agency (IRENA) predicted that the importance of the global renewable energy can overtake 30% in 2030, and that 40% of the total renewable energy potential in 2030 will be concentrated in power generation. On the other hand, the International Energy Agency (IEA) 2014 Energy Outlook expects that the percentage of renewables in total power generation will grow from 21% in 2012 to 33% in 2040, and will provide half of the growth in global electricity generation.
Among the renewable technologies, the wind onshore constitutes the lower cost option and according to the Global Renewable Energy Market Outlook 2013, from Bloomberg New Energy Finance it is expected to be responsible for the largest share of the 30% new renewables sum to the global power grid in 2030.
Chart 5 - Renewables over total electricity generation
Europe
Europe is a continent with low energetic resources, and thereby it suffers from a high dependence from the exterior. More specifically, the European Commission calculated that in 2012, € 545 billion were spent on importing fossil-fuels. Thus, having the purpose to reach a more energetic independence, the role of renewables achieved a major importance, and by 2010, according to the European Commission, renewables allowed the saving of €30 billion in imported fuel costs. In this process, the European Wind Energy Association (EWEA) enhanced the role played by wind energy, since in 2012, it avoided costs of €9.6 billion on fossil fuel. Still regarding EWEA reports, in 2014 wind accounted for 44% of new installations, totaling a cumulative installed capacity of 120 GW. Therefore, mainly due to remuneration schemes and incentives that had as a goal to answer to environmental and security of supply concerns, around 7% of power produced in Europe is now derived from wind energy. The European plan "20-20-20" was defined for each state and it
13% 25% 11% 17% 2% 17%
69%
23% 45% 26% 28% 13% 36%
71%
USA EU OECD Asia
Oceania China Middle East Africa Latin America
2011 2035
20 estimates that, by the end of 2020, it will be possible to achieve the following targets: a 20% reduction in greenhouse gas emissions from 1990 levels; a 20% share of renewables in total energy mix; a 20 % improvement in energy efficiency.
Chart 6 - Share of new power capacity installations in EU 2014
North America
According to IEA, recently the market of North America has had a substantial and consistent growth in the renewable energy sector. Particularly, in USA, the growth in this sector has mainly been due to the need to achieve environmental targets and to the wind energy competitiveness. Moreover, the incentives as tax credits for production and the agreements of power purchase were also important to this development. Henceforth, there are too reasonable expectations of a higher growth in the North American market, which are founded on the planned coal capacity retirements (planning to be substituted by wind energy), on the increase of the wind energy competitiveness and on the requirement to the power suppliers to provide a minimum share of electricity from renewable sources.
Chart 7 - Sources of U.S.A. electricity generation 2014
Latin America
Until 2014, Latin America developed some renewables technologies, like hydropower, that had an important role in the increase of the power supply.
Wind 44% Gas 9% Coal 12% Ocean 0% Geothermal 0% Waste 0% Hydro 1% Biomass 4% Solar PV 30% Coal 40% Natural Gas 28% Nuclear 19% Hydro 48% Wind 34% Biomass Wood 8% Biomass Waste 4% Geothermal 3% Solar 3% Renewables 13%
Source: European Wind Energy Association
21 Regarding wind energy, this region had not the expansion as other regions did, but a scenario change is predicted, with an expected growth of almost 600% until 2020. According to IRENA, this expected growth will be mainly based on the large power generation capacity need. The quick growth on electricity consumption and great concern over the limited hydropower potential, added to excellent wind resource, low current implementation and limited access to cheap gas, are some of the factors that benefit the wind energy. Not to mention its relative competiveness towards other sources of energy and its growing regulatory support. Furthermore, this region is being influenced by the intensive renewable growth occurring in the U.S., and it is foreseen that the main development will happen in Brazil and Mexico.
Future Prospects
The sector of the renewable energy already reached an important position in the worldwide economy. The disadvantages of the fossil fuels, a more political concern and the increase of the incentives to the sector make believe that a consistent growth in the renewable energy will be created.
Thus, the IEA World Energy Outlook 2014 predicts that the sector of renewable energy will be responsible for about 40% of worldwide capacity addition of 1.618 GW in the period of 2012-2020. The wind energy onshore will play a very important role, since it will account nearly for 50% of this increase, totaling 316 GW. Geographically, the expansion of the renewable sector will mainly take place in Europe, North America and Latin America.
Chart 8 - 2012-2020 Worldwide additions
Coal and Oil 14% Gas 26% Hydro 16% Nuclear 3% Wind 49% Solar PV 39% CSP 2% Other 10% Renewables 41%
22 5. Strategic Analysis
5.1. SWOT
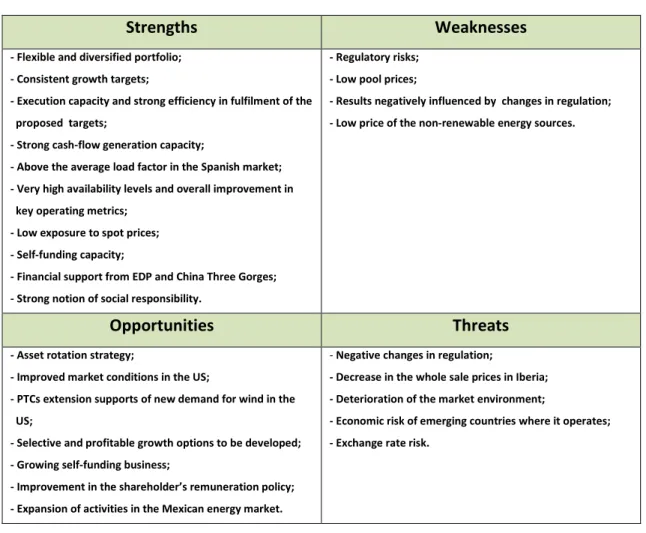
Table 9 - EDPR SWOT analysis
Strengths Weaknesses
- Flexible and diversified portfolio; - Consistent growth targets;
- Execution capacity and strong efficiency in fulfilment of the proposed targets;
- Strong cash-flow generation capacity;
- Above the average load factor in the Spanish market; - Very high availability levels and overall improvement in key operating metrics;
- Low exposure to spot prices; - Self-funding capacity;
- Financial support from EDP and China Three Gorges; - Strong notion of social responsibility.
- Regulatory risks; - Low pool prices;
- Results negatively influenced by changes in regulation; - Low price of the non-renewable energy sources.
Opportunities Threats
- Asset rotation strategy;
- Improved market conditions in the US;
- PTCs extension supports of new demand for wind in the US;
- Selective and profitable growth options to be developed; - Growing self-funding business;
- Improvement in the shareholder’s remuneration policy; - Expansion of activities in the Mexican energy market.
- Negative changes in regulation;
- Decrease in the whole sale prices in Iberia; - Deterioration of the market environment;
- Economic risk of emerging countries where it operates; - Exchange rate risk.
5.2. Porter Five Forces Analysis
Figure 3 - Porter Five Forces Analysis
Competitive Rivalry within an Industry
Bargaining
Power of
Suppliers
Bargaining
Power of
Customers
Threat of
New
Entrants
Threat of
Substitutes
See Appendix 423 6. Evaluation
6.1. Methodology
In order to proceed to the valuation of the EDPR, the method Sum-of-the-Parts (SOTP) will be used. Therefore, the value of the company will be estimated, through the sum of its different geographic sections.
The valuation of each geographical section will be performed by using the FCFF method. This process seems to be the advisable one to follow, since it is the most used by the investors and financial analysts in the world and because it suits well to companies with a practically fixed capital structure, like the case of EDPR. Thus, the FCFF method will be applied to a time horizon of five years and it will be used a constant rate of WACC to discount the FCFF, that will be constant for the referred time horizon and for perpetuity.
6.2. Assumptions
Henceforward, to achieve the value of each geographical section, some assumptions will be introduced, concerning the application of the FCFF method and the discount rate - WACC.
6.2.1. Revenues
The revenues were calculated for the next five years (2015-2019), in the main markets where EDPR operates - Europe, USA and Brazil. Estimations were made according to the historical data of the specific market revenues, to the business plan defined by the company for 2014-2017 and to the expectations of the evolution of the renewable sector and the nominal GDP of each area.
Europe
In 2013, there was an increase of 5.4% in the European revenues, due to the growth of the production that overcame the decreasing effect of the average selling price. The good performance was registered in all the European countries in which EDPR operates. However, in 2014, despite the production increase, there was a decrease of 9% in the revenues, which was caused by a lower average selling price. The main
24 reasons for this decline were the Spanish changes in the remuneration framework for renewable assets and the lower realized price in Romania, with green certificates being sold at the floor of the regulated collar.
For the period 2014-2017, EDPR predicts a growth of 20% in the electricity generation, since some European markets give good growth prospects based on its low risk regulatory frameworks. The main growth will occur in France, where EDPR has new projects being developed that will in turn generate new possible additions for 2015-2017; in Poland, where it is developing competitive projects and in Portugal, where the total capacity given to the ENEOP consortium in 2006, will be completed. Nevertheless, comparing with other regions where EDPR operates, the growth registered in Europe, will be consistent, but at a slower pace.
Each EU state developed national action plans, in which they commit themselves to achieve the 2020 targets defined by the Renewable Energy Directive made by the European Commission, and so gradually increase the percentage of the RES (Renewable Energy Source) in the energy sector. Thus, renewable energy will play an important role in the future of the European energy and it is a goal of EDPR to go along with this development. Furthermore, the expected recovery of the economic situation in Europe from 2014 until 2019 is a presumptive factor that will offer EDPR a better operative ground for developing its activities.
Therefore, with the predicted improvement of the European performance and the development of new projects, it was considered that in 2015, EDPR will recover from the 2014 decrease and will experience a growth of 7.5% in the revenues. Then, in 2016 and 2017, the growth will be at a slower pace and will correspond to 3.5% and 3%. Finally, since there are no information for 2018 and 2019, it was considered that the growth of the revenues will be related to the economic growth of the two most important markets, and so it was used the average of the predictions of the nominal GDP of Spain and Portugal in 2018 and 2019, that correspond to 2.8% for both years (Appendix 5).
25 USA
In 2013 and 2014, there was a revenue increase of respectively 1.3% and 7%, supported by an increase in the average selling price and production. This revenues increase is expected to continue since the 2014-2017 Business Plan of the company defined the American market as the most important one, in which the electricity generation growth will represent 60% until 2017. The main reasons are based on the different EDPR’s portfolio of projects in this market, in the maintenance of the PTC tax benefits (production tax credits) and substantial demand for long term PPAs (power purchase agreements) from wind energy projects.
The US Government defined as a goal for 2020 that all US government agencies need to achieve the target of 20% renewable energy generation. Like in the case of Europe this change is planned to be phased gradually. Moreover, the good evolution of the US economy is also a significant factor that will help the development of the renewable sector, and consequently the activity of EDPR.
So, since USA will be a priority market and the one having a substantial investment, it was considered that, EDPR will have a revenue growth of 25% in 2015, 10% in 2016 and 7.5% in 2017. Finally, since there are no information for 2018 and 2019, it was considered that the growth of the revenues would be linked to the nominal GDP growth of the US economy in 2018 and 2019. Therefore, a growth of 4.6% and 4.1% was respectively assumed (Appendix 6).
Brazil
In 2013 and 2014, Brazil achieved a context of revenues increase of 12% for both years, mainly due to the increase of the average selling price. This growing path is expected to continue since the 2014-2017 Business Plan projected a growth of 20% in the emerging markets, in which Brazil will play the main role. Thus, in 2015-2017 EDPR plans to install the projects with PPA awarded in 2011 and 2013 and through this operation it expects to increase 181% the capacity from the current portfolio.
With the purpose of also investing and developing the market of the renewable energy, the Brazilian government predicted a consistent growth of the different
26 renewable resources, which represents a strong percentage in the Brazilian renewable sector. Although, Brazil is now passing through a slowdown in its economic performance, the predictions made by the IMF expect a good economic recovery in the future that will help the development of the renewable sector.
So, it is expected that, though Brazil is experiencing some economic problems, EDPR will have conditions to develop important projects in this country. Thus, it was assumed a revenue growth of 2.5% in 2015, 5% in 2016 and 7.5% in 2017. Finally, since there are no information for 2018 and 2019, it was considered that the growth of the revenues would be linked to the nominal GDP growth of the Brazilian economy in 2018 and 2019. Therefore, a growth of 5.1% was presumed for both years (Appendix 7).
Table 10 - Revenues Assumptions (€ million)
2013 2014 2015 2016 2017 2018 2019 Europe Revenues 820 747 803.0 831.1 856.0 880 904.6 Growing rate - -9% 7.5% 3.5% 3% 2.8% 2.8% USA Revenues 472.9 505.8 632.3 695.5 747.7 782.1 814.2 Growing rate - 7% 25% 10% 7.5% 4.6% 4.1% Brazil Revenues 22.6 25 25.6 26.9 28.9 30.4 32.0 Growing rate - 12% 2.5% 5% 7.5% 5.1% 5.1% Total Revenues 1316 1277 1460.9 1553.5 1632.6 1692.5 1750.8 Growing rate - -3.0% 14.4% 6.3% 5.1% 3.7% 3.4% 6.2.2. EBITDA Margin
Like the case of the revenues, the EBITDA margin was estimated for each region, taking into account the historical data and the strategic plan of the company.
Europe
In spite of the adversities that EDPR faced in the 2013, with a reduction of 9 pp on the EBITDA margin, in 2014, there was an increase of 1 pp in this item. In 2015, it was presumed that new projects will increase the operating costs, leading to a decrease of the EBITDA margin of 1 pp. In 2016 and 2017, with the improvement of the operating performance there will be an increase of the EBITDA margin of 0.5 pp. For 2018 and 2019, this improvement will be more consolidated and the increase will be of 1 pp in both years (Appendix 8).
27 USA
In 2013 and 2014, there was an increase of the EBITDA margin of respectively 3 pp and 1 pp. In spite of the good performance, there was a slowdown mainly due to the reduction of other operating income that was offset by the decrease in operating costs. So, taking into account the great investment in new projects that are going to raise the operating costs, it was considered a decrease of the EBITDA margin of 5 pp in 2015, a decrease of 1 pp in 2016 and an increase of 2 pp in 2017. For 2018 and 2019, the improvements of the operational performance will finally lead to an increase of respectively 2 pp and 1 pp (Appendix 9).
Brazil
In 2013, there was a reduction of the EBITDA margin of 8 pp and an increase of 2 pp in 2014 explained not only by the increase of the operating costs but also the good performance of the revenues. Taking into account the investment that is going to be made in this emerging market which in turn will lead to a growth in the operating costs, it was presumed a decrease of the EBITDA margin of 4 pp in 2015 and a decrease of 2 pp in 2016. In 2017, it was also considered that the operating performance will improve and a growth of 1 pp will be registered in this case. Finally, for 2018 and 2019, this path is expected to be maintained and the increase will be 2 pp for both years (Appendix 10).
Table 11 - EBITDA Margin Assumptions (€ million)
2013 2014 2015 2016 2017 2018 2019 Europe EBITDA 590 544 578.2 602.5 624.9 651.2 678.5 EBITDA margin 72% 73% 72% 72.5% 73% 74% 75% USA EBITDA 329.8 358.9 417.3 452.1 501 539.6 569.9 EBITDA margin 70% 71% 66% 65% 67% 69% 70% Brazil EBITDA 13.1 15.4 14.6 14.8 16.2 17.6 19.2 EBITDA margin 59% 61% 57% 55% 56% 58% 60% Total EBITDA 932.9 918.3 1010.1 1069.4 1142.1 1208.4 1267.6 EBITDA margin 70.8% 71.9% 69% 69% 70% 71.4% 72.4%
6.2.3. Investment in Fixed Assets and Depreciations
Since EDPR does not perform predictions regarding the next points, the following items were estimated using historical data.
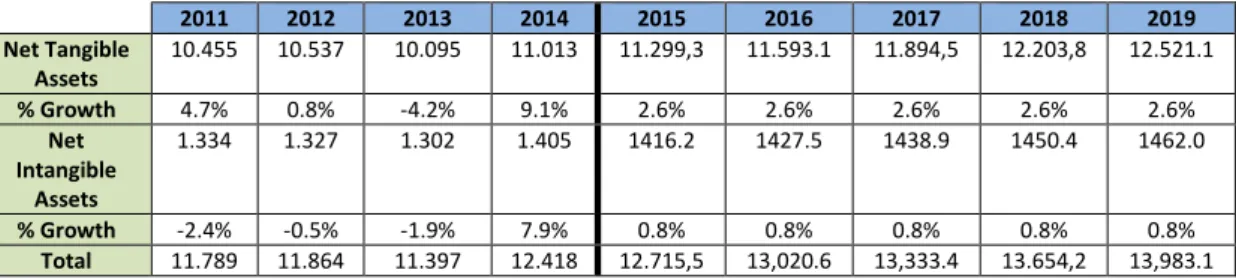
28 The Capex was calculated following three steps: first the values of the Net Tangible Assets and the Net Intangible assets (including goodwill) were estimated using the average change percentage of the last four years. It was obtained the ratio of 2.6% for the first and 0.8% for the second. Then, a strategy of progressive growth was adopted using the referred averages growths.
Table 12 - Assets Assumptions (€ million)
2011 2012 2013 2014 2015 2016 2017 2018 2019 Net Tangible Assets 10.455 10.537 10.095 11.013 11.299,3 11.593.1 11.894,5 12.203,8 12.521.1 % Growth 4.7% 0.8% -4.2% 9.1% 2.6% 2.6% 2.6% 2.6% 2.6% Net Intangible Assets 1.334 1.327 1.302 1.405 1416.2 1427.5 1438.9 1450.4 1462.0 % Growth -2.4% -0.5% -1.9% 7.9% 0.8% 0.8% 0.8% 0.8% 0.8% Total 11.789 11.864 11.397 12.418 12.715,5 13,020.6 13,333.4 13.654,2 13,983.1
Afterwards, the values of the amortizations and depreciations were calculated, using the average percentage of the last three years, in function of the values of the net asset of the last period. It was obtained the ratio of 5% for the depreciations and 1% for the amortizations. Then, it was also chosen a strategy of progressive growth using the referred averages growths.
Table 13 - Amortisations and Depreciations Assumptions (€ million)
2012 2013 2014 2015 2016 2017 2018 2019 Depreciations 503 465 500 550.7 565.0 579.7 594.7 610.2
% Net Tangible Assets t-1 5% 4% 5% 5% 5% 5% 5% 5%
Amortizations 15.2 18.5 19 14.1 14.2 14.3 14.4 14.5
% Net Intagible Assets t-1 1% 1% 1% 1% 1% 1% 1% 1%
Total 518.2 483.5 519 564.8 579.2 594 609.1 624.7
Finally, to achieve the Capex it was applied the following formula.
[12] 𝐶𝑎𝑝𝑒𝑥 = (𝑁𝑒𝑡 𝐹𝑖𝑥𝑒𝑑 𝐴𝑠𝑠𝑒𝑡𝑠𝓉− 𝑁𝑒𝑡 𝐹𝑖𝑥𝑒𝑑 𝐴𝑠𝑠𝑒𝑡𝑠𝓉−1) + (𝐴𝑚𝑜𝑟𝑡𝑖𝑠𝑎𝑡𝑖𝑜𝑛𝑠𝓉+ 𝐷𝑒𝑝𝑟𝑒𝑐𝑖𝑎𝑡𝑖𝑜𝑛𝑠𝓉)
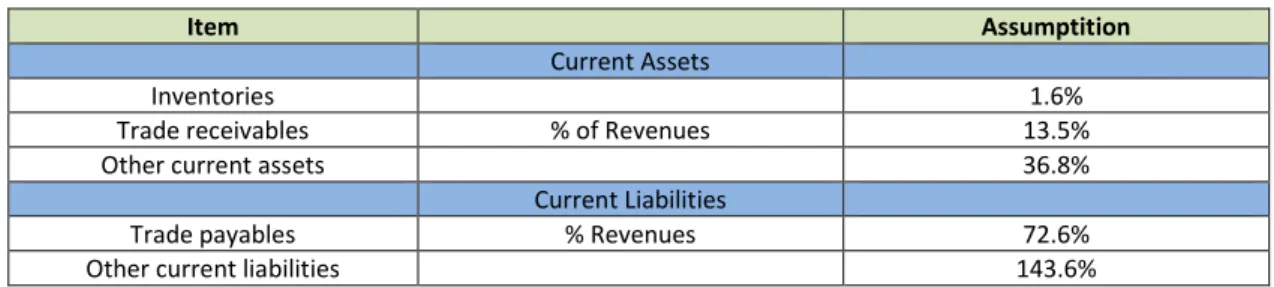
6.2.4. Investment in Working Capital
The following items were estimated using the average percentage of the last four years, in function of the revenues (Appendix 11).