Quantifiable Analysis of Energy Efficient
Clustering Heuristic
Anita Sethi
11
Uttrakhand Technical University, Dehradun, India
J. P. Saini
22
M.M.M. Engineering College Gorakhpur, India
Manoj Bisht
33
WWIL Ltd. Delhi, India
Abstract— One of the important aspects of MANET is the restraint of quantity of available energy in the network nodes that is the most critical factor in the operation of these networks. The tremendous amount of energy using the mobile nodes in wireless communication medium makes Energy Efficiency a fundamental requirement for mobile ad hoc networks. The cluster-based routing protocols are investigated in several research studies which encourage more well-organized usage of resources in controlling large dynamic networks. Clustering can be done for different purposes, such as, routing efficiency, transmission management, backbone management etc. Less flooding, distributed operation, locally repairing of broken routes and shorter sub-optimal routes are the main features of the Clustering protocol. In this paper, we present quantifiable analysis of energy efficient cluster-based routing protocol for uninterrupted stream queries.
Keywords- Cluster; ClusterHead; Gateway; Associated nodes; Energy Efficiency.
I. INTRODUCTION
A variety of static clustering heuristics permits us to expertly identify group structures. Dynamic nature of MANET signifies the change of a network in the course of discrete time. Clustering technique exhibits a clustered structure based on intra-cluster density versus inter-cluster sparsity of edges and Random location of mobile nodes is generated according to a probabilistic model. Formalizations of this notion lead to measures that quantify the quality of a clustering and to algorithms that actually find clustering. Since, most generally, corresponding optimization problems are hard, heuristic clustering algorithms are used in practice, or other approaches which are not based on an objective function.
A clustering
C(ζ)
of a graph G = (V, E) is a partition ofV, into disjoint, non-empty subsets{C
1, C
2, …….. ,
C
k}
.
Each subset is a clusterC
i,
∈
ζ.
The number of
clusters in a clustering with
k = |ζ|.
It is convenient to denote the cluster to which u currently belongs byζ (u)
The set of intra-cluster edges of a cluster
C
is defined asE(C) = {{u, v}
∈
E: u
∈
C
⋀
v
∈
C}
The set of inter-cluster edges between clusters Ci and Cj is defined as
E (Ci, Cj) = {{u, v} ∈ E: u ∈Ci ⋀v ∈Cj} wherei ≠ j
For a graph G = (V, E),an optional weight functionωand a coverage clustering
ζ
of G,
coverage is defined asFor a graph
G = (V, E),
and a clusteringC(ζ)
performance is defined asSignificance Performance for a graph
G = (V, E),
and a clusteringC(ζ)
is defined asFor a graph
G = (V, E),
a
cut θ = (U,V
\U)
is a partition of the node set into two subsets. For a weighted graphG =
(V,E, ω)
,
the weightω(θ)
of the cut is defined asThe conductance weight of one side of the cut is
For a graph
G = (V, E, ω),
and a clusteringζ
the conductance for thecut θ = (C, V
\C)
is defined asDynamic Clustering Heuristic is a technique which, given the previous state of a dynamic graph Gt-1,a sequence of graph events Δ(Gt-1,Gt)and a clustering ζ(Gt-1) of the previous state, returns a clustering ζ(Gt)of the current state.
II. OBJECTIVES OF CLUSTERING
Aim of the Clustering algorithm is to discover a realistic interconnected set of Clusters covering the entire node population. If the goal is to create an indiscernible global infrastructure where mobile devices can communicate with each other effectively, reliably and wirelessly without utilizing huge amount of energy and no loss of connectivity and data then clustering algorithms is the only way. An efficient Clustering algorithm should be steady to the radio motion, i.e. it should not change the Cluster Configuration too drastically when a few nodes are moving and the topology is slowly changing.
Fig. 1 Clustering Objectives
Otherwise, the Centroids will not control their Clusters efficiently and thus lose their role as local coordinator.
III. CLUSTERING OPERATION
Clustering process involves three phases,
1) Initialization
2) Setup Phase
3) Transmission Phase
The objective of Cluster Formation is to enforce some kind of structure or hierarchy in the completely disorganized ad hoc network. Originally all nodes wake up in the Ambiguous state in the network initialization phase and use the information obtained from the HELLO messages for Cluster Formation. During Setup phase ClusterHead will be elected according to heuristic which have comprehensive knowledge about group membership and link state information in the Cluster within a bounded time once the topology within a cluster stabilizes. A node regards itself as an associated node for a particular
ClusterHead in the Setup phase. An associated node may hear from several ClusterHeads and therefore have several host Clusters; its host ClusterHeads are implicitly listed in the HELLO messages it broadcasts.
Fig. 2 Clustering Operation
Any node a ClusterHead may use to communicate with an adjacent Cluster is called a Gateway node. As clusters are identified by their respective ClusterHeads, we would like to have the ClusterHeads change as infrequently as possible.
As the nodes unceasingly move in different directions with different speeds, the existing links between the nodes also get changed and hence, the initially formed Cluster cannot be retained for a longer period.
Fig. 3 Clustering Architecture
IV. CALCULATION OF ENERGY REQUIRED FOR
TRANSMISSION AND RECEPTION OF ASINGLE PACKET
A. Calculation of Energy Spent
For the simulation, transmission power used is 1.3ℳ
W,
and reception power is 0.9ℳWand various energy cost
components are:ℰ
T pck=
1.3 * 1.536 * 10-3 =1.9968ℳW
Fig. 4 ClusterHead Election
ℰ
Rpck=
0.9 * 1.536 * 10-3= 1.3824ℳW
ℰ
T ack=
1.3 * 0.304 * 10-3 = 0.3952ℳW
ℰ
Rack=
0.9 * 0.304 * 10-3 = 0.2736ℳW
V. OBSERVATIONS
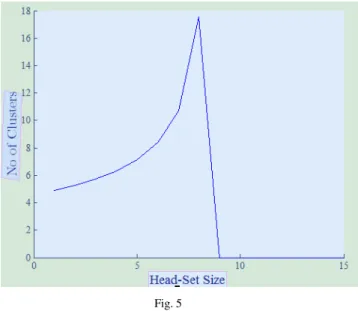
A. Obtaining Ideal number of Clusters
We can obtain ideal no of clusters from the equation
Fig. 5
A simulation environment is created where n = 1200 and d = 160m, n are the nodes and d is the distance between source and destination nodes. The graph drawn with this simulation shows the variation in ideal no of clusters w.r.t the Cluster size. A variation of Cluster size between one and eight is done.
The graph shows that the Cluster size cannot be more than 8 and further we may also derive the maximum no of clusters from the graphical analysis.
In figure 6 a graph is plotted to explain energy consumption wrt number of clusters. We see as the number of clusters is increased the consumption of energy gets considerably reduced. The rate of energy consumption is lowest when more cluster members are there in a cluster. It is clearly visible that when cluster size is 4 the energy cosumption is lowest as compared when cluster size is 1, 2, 3 or4.
B. Consumption of Energy
This portion compares the energy consumed for varying head sizes along with definite number of frames. An illustration of variation in energy consumed per node w.r.t. the number of clusters and network diameter is done in figure 7. Numbers of clusters are represented on X-axis while Y-axis represents the energy consumed in a single round. The below mentioned equation is used to derive energy consumed for a single node:
The number of frames transmitted in a single round is 20. The graph clearly depicts that when clusters are increased, energy consumption is reduced. When a simulated network of 1200 nodes is created, graph shows the ideal range clusters lies between 20 and 60. The energy consumption increases when the number of clusters is increased. If the number of clusters is below the ideal range, for e.g. 10, the data collecting sensor nodes have to communicate to the far ClusterHeads and resultantly use more energy in transmission. Similarly if the number of Clusters is more than the ideal value there will be more transmission to the destination. From the graph it is clearly visible that the energy consumption is lower for higher Cluster-size. We can observe that the energy consumed is almost 3 times less when Cluster-size is 1.
Fig. 7
We can dedicate the main reason to reduction in energy consumption mainly to excess nodes in the Cluster. During the transmission of each frame there are nk-m Non-ClusterHead transmission and one ClusterHead transmission. Further m-1 nodes are in sleeps and do not transmit.
As compared to LEACH there are lesser elections and re-affiliations in the routing model; the number of elections reduced from n/k to n/km. An illustration of per round energy consumed w.r.t cluster size and network diameter is done in figure 8. Network diameter, Head set size and the energy
consumed in one round are respectively shown by x, y and z-axis. Energy consumed per round by
Fig. 8
In one iteration the number of data frames are Nf=10,000
and the number of clusters K=50. The graph clearly depicts that energy consumption is reduced when the head set size is increased. It is very much clear that using a cluster of associated nodes is more beneficial as compared to using single ClusterHead. There is more pragmatic approach in reducing energy consumption when we use this protocol. As we add more nodes to LEACH, they all are treated in differentially and all these nodes will be used for collecting the sensor data. The number of sensor nodes for data collection remains unaltered and the number of control and management nodes can be tuned.
C. Data Frames and Elapsed time in iteration
An estimation of average time for one iteration in each round is done such that every node becomes a member of ClusterHead. Further frames transmitted in each iteration are also evaluated. The variation in time to complete one iteration w.r.t the cluster diameter and ClusterHead size completion time of one iteration are being represented by X, Y, Z axis respectively. The initial energy ℰstart is fixed for all the cases.
Fig. 10
VI. CONCLUSION
Clustering Heuristic is a powerful and scalable heuristic for ad hoc network. The results of our quantifiable analysis of the energy efficient clustering heuristic indicates that the energy depletion can be analytically decreased by including more nodes in a head-set. For the same number of data collecting, the number of control and management nodes can be adjusted according to the network environment.
In future work, the variation in the head-set size for different network conditions will be investigated.
This work will be prolonged to integrate non-uniform cluster distributions. We are developing the simulation model to authenticate and confirm our quantifiable analysis.
REFERENCES
[1] S. Bandyopadhyay and E. J. Coyle. An energy efficient hierarchical clustering algorithm for wireless sensor networks. In Proceedings of the
IEEE Conference on Computer Communications (INFOCOM), 2003.
[2] Cerpa and D. Estrin. ASCENT: Adaptive self-configuring sensor networks topologies. IEEE Transactions on Mobile Computing (TMC)
Special Issue on Mission-Oriented Sensor Networks, 3(3),
July-September 2004.
[3] M. Jiang, J. Li, and Y. C. Tay, "Cluster Based Routing Protocol(CBRP) (INTERNET-DRAFT draft-ietf-manet-cbrp-spec-01.txt)," in National
University of Singapore, I. E. T. F. (IETF), Ed., 1999, pp. 1-27.
[4] S. A. Hosseini-Seno, B. Pahlevanzadeh, T. C. Wan, R. Budiarto, and S. Ramadass, "Routing Layer Service Advertisement Approach for MANETs," in International Conference on Future Networks (ICFN
2009) Bangkok- Thiland: IEEE, 2009, pp. 249-254.
[5] Christian Staudt “Experimental Evaluation of Dynaic Graph Clustering
Algorithms”
[6] W. R. Heinzelman, A. Chandrakasan, and H. Balakrishnan. Energy efficient communication protocol for wireless microsensor networks. In
Proceedings of the Hawaii International Conference on System