“main” — 2013/7/31 — 18:28 — page 459 — #1
Revista Brasileira de Geof´ısica (2012) 30(4): 459-471 © 2012 Sociedade Brasileira de Geof´ısica ISSN 0102-261X
www.scielo.br/rbg
PROSPECTING PHOSPHORITES USING AIRBORNE GEOPHYSICS
IN NORTHEASTERN GOI ´AS STATE – BRAZIL
Chris Busnello Fianco, Roberta Mary Vidotti,
Augusto C´esar Bittencourt Pires and Adriana Chatack Carmelo
Recebido em 3 fevereiro, 2011 / Aceito em 1 agosto, 2012Received on February 3, 2011 / Accepted on August 1, 2012
ABSTRACT.The project area is located in the central part of Brazil, on the northeast region of Goi´as State. The phosphatic rocks occur in the Bambu´ı Group, on the eastern portion of the Faixa de Dobramentos Bras´ılia – Bras´ılia Fold Belt (FDB), on the western border of the S˜ao Francisco Craton. In the area under investigation, the mineralized rocks are associated with limestone and apatite. In order to discover new prospective targets of phosphatic sedimentary bodies, a faster and more objective airborne geophysics data processing method was carried out together with statistical correlation of geochemical data. The integration of these data identified potential mineralized targets to be checked with geologic mapping and ground geophysics (gamma-ray spectrometry) to produce a parameter of calibration and comparison with the airborne geophysical information. Integration of geologic information and estimate maps of eU and P shows that igneous rocks and lateritic crusts present the highest grades of eU and eTh, as expected. However, short wavelength anomalies were identified in sediments of the Serra de Santa Helena and Sete Lagoas formations (Bambu´ı Group), where known phosphatic bodies occur in the studied area. The next step of this work will be field work to check these anomalies, with geological mapping and ground gamma-ray profiles.
Keywords: applied geophysics, multiple regressions, phosphorites, uranium, Bambu´ı Group.
RESUMO.A ´area do projeto est´a localizada na parte central do Brasil, na regi˜ao nordeste do Estado de Goi´as. As rochas fosf´aticas ocorrem no Grupo Bambu´ı, na parte leste da Faixa de Dobramentos Bras´ılia (FDB), na borda oeste do Cr´aton do S˜ao Francisco. As rochas mineralizadas na ´area de estudo est˜ao associadas a calc´arios com apatita. Buscando maior eficiˆencia e rapidez na descoberta de novos alvos prospectivos de rochas sedimentares fosf´aticas, foi realizado o processamento dos dados aerogeof´ısicos juntamente com a correlac¸˜ao estat´ıstica dos dados geoqu´ımicos. A integrac¸˜ao destes dados proporcionou alvos potenciais que ser˜ao investigados com mapeamento geol´ogico e geof´ısica terrestre (gamaespectrometria) para produzir parˆametros de calibrac¸˜ao e comparac¸˜ao com as informac¸˜oes de geof´ısica a´erea. A integrac¸˜ao de informac¸˜oes geol´ogicas e mapas de estimativa de eU e P mostraram que rochas ´ıgneas e crostas later´ıticas apresentam os teores mais altos de eU e eTh, conforme esperado. Entretando foram identificadas anomalias com pequeno comprimento de onda nos sedimentos das formac¸˜oes Serra de Santa Helena e Sete Lagoas do Grupo Bambu´ı, onde s˜ao conhecidas ocorrˆencias de corpos fosf´aticos na ´area. O pr´oximo passo deste trabalho ser´a a investigac¸˜ao em campo destas anomalias encontradas, por meio de perfis geol´ogicos e gamaespectrometria terrestre.
Palavras-chave: Geof´ısica aplicada, regress˜oes m´ultiplas, fosforitos, urˆanio, Grupo Bambu´ı.
Universidade de Bras´ılia/Instituto de Geociˆencias, Laborat´orio de Geof´ısica Aplicada, Campus Universit´ario Darcy Ribeiro, ICC Centro, 70910-900 Bras´ılia, DF, Brazil. E-mails: chrisfianco@hotmail.com; roberta@unb.br; acbpires@unb.br; chatack@unb.br
INTRODUCTION
In Brazil, unlike what is seen in most of the world (Cook & Shergold, 1986), about 80% of the known phosphate deposits have an igneous origin, where carbonate rocks and micaceous minerals with low grade of P2O5(Souza & Cardoso, 2008) are
strongly present.
Brazil’s second largest reserves of phosphate rock are in the State of Goi´as, corresponding to 13.8%, only behind the State of Minas Gerais that has 67.9% of the domestic reserves (Souza & Fonseca, 2009). As a function of phosphorus’ agricultural impor-tance, whose only sources are the phosphate rocks, the search for new phosphate deposits and feasibility of small orebodies has been moving forward significantly in Brazil.
In the studied area, the Bambu´ı Group is located between the Eastern portion of the Bras´ılia Fold Belt (BFB) and the S˜ao Francisco Craton (SFC). The Bambu´ı Group was defined by Dar-denne (1978), and it is divided into six formations, from base to top: Jequita´ı Formation made up of diamictites and, subordi-nately, massive mudstones; Sete Lagoas Formation characterized by mudstones and marls at the base and limestones and dolomites on top; Serra de Santa Helena Formation, made up of claystones and siltstones with dark gray limestone lenses and marl levels; Lagoa do Jacar´e Formation, made up of marl levels and clay-rich siltstones intercalated with benches or lenses of black oolitic limestone; Serra da Saudade Formation made up of greenish clay-rich siltstones and marls, with gray limestone at the base and greenish arkoses on top; and the Trˆes Marias Formation, made up of massive benches of greenish arkoses intercalated with greenish arkosic siltitstones.
Bambu´ı Group’s sedimentation, in the Bras´ılia Fold Belt, be-gan with the glacial diamictites. When the ice layers melted it allowed the installation of an epicontinental marine environment, propitiating the deposition of marls overlaying the S˜ao Francisco Craton. Climatic conditions during deglaciation also favored the phosphatic sediments deposition (Dardenne, 1978).
The occurrences of phosphate rocks and phosphorites present from base to top, the following lithostratigraphic units: Granite-Gneissic Complex, Ticunzal Formation, Aurumina Suite, Nova Roma Quartz-diorite, Pedra Branca Suite, Ava´ı Group, Parano´a Group, Jequita´ı Formation, Bambu´ı Group and Areado and Urucuia groups (Monteiro, 2009).
The geologic information used in this work (Fig. 1) is a com-pilation from the Series of geological map sheets in 1:100,000 scale, including the sheets Monte Alegre de Goi´as, Nova Roma and Cavalcante, surveyed as part of the Geological Program
(PGB/PGL) of the Brazilian Geological Survey (CPRM) in 2006 (Moreira et al., 2008). An outstanding characteristic observed in outcrops is the differentiation of igneous rocks (basement) in the western portion, from sedimentary rocks in the eastern portion of the area.
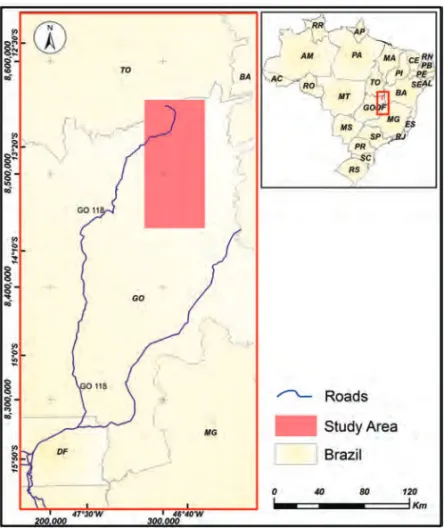
With a N-S elongated form, the area is located in the north-eastern portion of the State of Goi´as and southnorth-eastern portion of the State of Tocantins, distant about 300 km from Bras´ılia (Fig. 2). With an area of approximately 7,000 km2, it includes the
munic-ipal districts of Campos Belos, Monte Alegre de Goi´as and Nova Roma, in Goi´as, and Arraias in Tocantins.
Vegetation cover is not dense, which facilitates the access through the area. The semiarid climate is responsible for a thin and discontinuous weathering profile, resulting in rocky outcrops. Ferreira et al. (1992) mentioned that the calcareous rocks, hosting the phosphate mineralization, usually present low grades for radioactive elements. This would allow a contrast with the mineralized rocks, since apatite [Ca5(PO4)3(F,OH,Cl)], usually
has high grades of eU and eTh.
Thorium is considered a good guide for lithologic charac-terization due to its low mobility in the superficial environment (Pires, 1995). Uranium has an intermediate mobility, however some lithotypes present high contents of this element. This is equally observed in some granites, lateritic crusts and phosphate rocks, due to the presence of apatite. Potassium, although with higher mobility than uranium, has an expressive presence in the crust as an important rocking forming mineral major element and, in this way, has a varied distribution in differente surface lithotypes (IAEA, 2003).
Based on this information, the airborne geophysical data processing was carried out, with stronger emphasis in gamma-ray spectrometry, since the phosphate rocks are not magnetized and, locally, they are at shallow depths or cropping-out in the area. Statistical methods were applied and integrated with geochem-istry data, resulting in final products such as images presenting eU and P estimates for the project area.
METHODS
The State of Goi´as Division for Geology and Mining Affairs pro-vided the airborne geophysical database. The 50,440 km2area
(Fig. 2) of the aerogeophysical survey, designated Area V or Paleo-Late Proterozoic in the northeastern portion of Goi´as State, is located in the central-western region of Brazil. The airborne survey was accomplished between May 1 and September 1, 2006, with total coverage of 115,471 km of linear high-resolution
“main” — 2013/7/31 — 18:28 — page 461 — #3
FIANCO CB, VIDOTTI RM, PIRES ACB & CARMELO AC
461
Figure 1 – Geologic map of the study area (modified after Moreira et al., 2008).
magnetic and gamma-ray spectrometry profiles. The survey presents N-S lines spaced every 500 meters, and E-W control lines with 5,000 meters spacing. The nominal flight height was 100 meters (LASA, 2006).
The database was homogenized and the geographic position-ing adopted UTM planar coordinates, zone 23 South and South America Datum 1969 (SAD 69).
To minimize the effects caused by the size of the area and presence of several lithotypes, data selection was limited to a polygon inside the study area, which is equivalent to the geolog-ical map sheets Monte Alegre de Goi´as and Nova Roma (Fig. 2). As for quality control, we verified the magnetometric data’s quality and spatial representativeness inspecting the flight maps, along-line profiles, re-projected profiles, besides the noise envelope. With these procedures the satisfactory quality of data used in this study was proven.
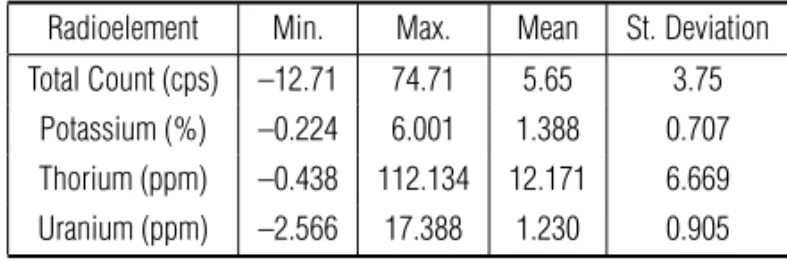
The same quality control analysis and representativeness was accomplished to the radiometric data; however, the statistical analysis verified the existence of negative values in the four chan-nels (Table 1). In order to reduce the occurrence of negative val-ues, a constant value for each channel was added, raising the ob-served values for each one of the radioelements towards the crust’s average value. This was achieved adding 0.23 to K; 0.44 to Th; and 0.73 to U (Table 2). Since there were still some negative values remaining in the U channel, they were carefully transformed into dummies, in order to prevent void areas in the grid.
Table 1 – Statistics database for the radioelements K, Th, U and radioactive total count.
Radioelement Min. Max. Mean St. Deviation Total Count (cps) –12.71 74.71 5.65 3.75
Potassium (%) –0.224 6.001 1.388 0.707 Thorium (ppm) –0.438 112.134 12.171 6.669 Uranium (ppm) –2.566 17.388 1.230 0.905
Table 2 – Statistical data following the process of adding constant values to the radioelements in order to reduce the negative values.
Radioelement Min. Max. Mean St. Deviation Total Count (cps) –12.71 74.71 5.65 3.75
Potassium (%) 0.123 6.959 1.893 0.734 Thorium (ppm) 0.007 143.099 13.373 9.193 Uranium (ppm) 0.000 18.218 2.017 0.974
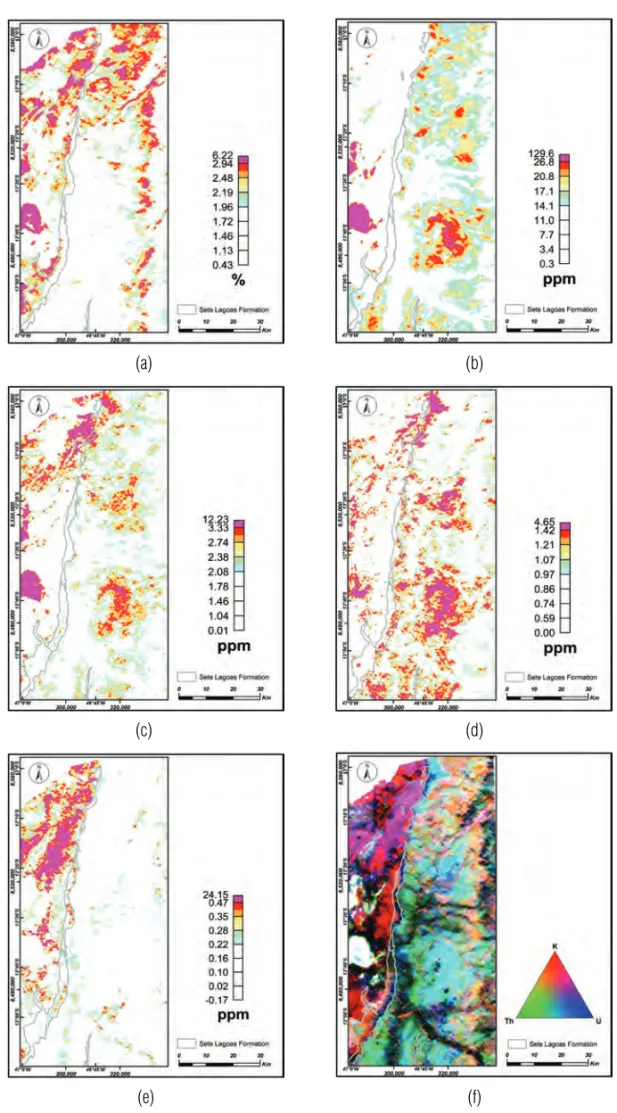
During this stage were generated maps of the K, eTh and eU channels, eU/K and eU/eTh ratios and RGB/KeTheU ternary im-age represented in Figures 3a, 3b, 3c, 3d, 3e and 3f respectively.
Due to the characteristic high frequency of the gamma-ray spec-trometry data, and to smooth the anomalies, several filters were tested to improve the spatial distribution of data. A Hanning 3X3 filter was chosen for being the one that caused less variation in the statistical data; nevertheless, a small difference between the maxi-mum and minimaxi-mum values of the K, Th and U elements of Table 2, and the grid values (Figs. 3a, 3b and 3c) was noticed. The gener-ated maps did not present the expected results, since the presence lateritic crusts, for instance, caused elevated thorium anomalies, masking the anomaly values related to phosphate rocks. However, from data qualitative analysis and their correlation with geologic information, it was possible to suggest target areas.
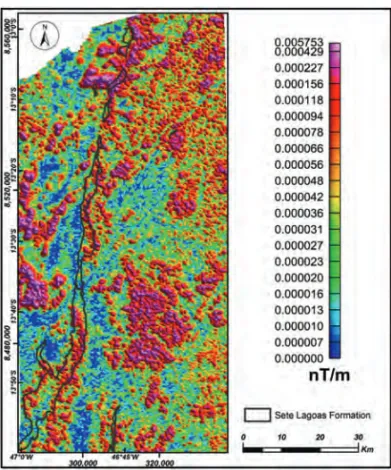
When dealing with metasedimentary rocks in the mineralized area, the magnetometric data were not fundamental for the in-terpretation. However, they were used as an additional informa-tion for the applicainforma-tion of multiple regressions techniques, since some geologic boundaries are well marked, especially in the an-alytic signal amplitude map (Fig. 4) as observed, for instance, in the boundary between Serra de Santa Helena Formation and Sete Lagoas Formation. A high-pass filter was used for the mag-netometric products aiming to enhance spatial high frequencies, evidencing the shallower magnetic features, and permitting a bet-ter correlation with the gamma-ray spectrometry and geochem-istry data.
The multiple linear regression technique, among the radioele-ment estimate concentrations, may be used to remove the effects of geologic processes in different lithotypes. The method is used to enhance values that differ from the average content distribution within an interpreted unit (e.g. Pires, 1995; Wellman, 1998; Pires et al., 2010). With the purpose of studying the relationship among data from different sources and to emphasize the uranium anoma-lous concentrations, the multiple regression statistical technique was applied, with special care to normalize data by the average, keeping the same unit for all elements (Davis, 1973).
QUALITATIVE INTERPRETATION
The potassium image (Fig. 3a) displays its enrichment in the northern, eastern and western portions of the area, while the cen-tral and southern portions show values below the average. In the eastern portion, high K (%) concentrations are found close to the contact between the Serra de Santa Helena Formation silt-stones and Lagoa do Jacar´e Formation calcarenites (Fig. 1). In the western portion there are higher concentrations of this radioele-ment, however two K highs are seen, with an approximately cir-cular shape, (Fig. 3a) that correspond to the biotite-granite of the Pedra Branca Suite (Fig. 1).
“main” — 2013/7/31 — 18:28 — page 463 — #5
FIANCO CB, VIDOTTI RM, PIRES ACB & CARMELO AC
463
(a) (b)
(c) (d)
(e) (f)
Figure 3 – Images displaying: (a) K; (b) eTh; (c) eU; (d) eU/K; (e) eU/eTh. Color table showing mean to higher values of each element; (f) Ternary RGB (KeTheU) image.
Figure 4 – Image of the analytic signal (ASA) with high-pass filter. The thorium map (Fig. 3b) helps to observe an enrichment in the eastern portion, corresponding to the sedimentary rocks of the Serra de Santa Helena Formation (Fig. 1). However, the areas where the highest grades of eTh (ppm) are found (magenta color, Fig. 3b), were mapped as lateritic crusts, justifiying the eTh high concentration. In the western portion, two eTh anomalies may be identified, with concentrations above 25 ppm, corresponding to the biotite-granite (Fig. 1).
The uranium map (Fig. 3c) presents high eU concentrations (ppm) that correspond to the biotite-granite (Pedra Branca Suite – Fig. 1) in the western portion of the area, but there are also high eU grades correlated with the detrital-lateritic crusts located in the eastern portion. To the north, there are areas with high eU con-centrations, above 3 ppm, approximately with 10 km × 10 km, corresponding to the mica-schist of Ticunzal Formation (Fig. 1).
Based on the eU/K ratio image (Fig. 3d), it is possible to con-firm that the uranium enrichment regarding the potassium occurs mainly in the areas where lateritic crusts and biotite-granite are found (Fig. 1).
The eU/eTh ratio map (Fig. 3e) shows an eU enrichment, rela-tive to the eTh, in the NW portion of the area, where igneous rocks belonging to the Aurumina Formation occur, and in the Ticunzal Formation rocks (Fig. 1). Using this map, it is also possible to identify the contact between the metasedimentary rocks and the regional basement.
The image with the ternary composition RGB/KeTheU (Fig. 3f), clearly shows three domains, that represent the outcrop of the basement rocks (west portion, in hot colors – prevalence of K), calcareous rocks with low radioelement grades oriented as a dark thin strip, and the sedimentary sequence (eastern portion of the area, with colder colors).
The image of the analytic signal (ASA), after a high-pass fil-tering (Fig. 4), shows the positioning of the shallower magnetic sources in the study area. The magnetic relief is quite high, in-dicating areas with higher content of magnetic minerals over the biotite-granite, and related to Serra de Santa Helena Formation rocks, to the northeast and in the center. Locally, they are also related to Lagoa do Jacar´e Formation rocks.
MULTIPLE REGRESSION
The multivariate analysis technique considers several variables simultaneously in association (Davis, 1973). In the multiple re-gression technique any variable can be considered as a function of any other variable. In this study, the simple linear relationship of the uranium equivalent content variable with the other variables produced by the airborne survey was investigated. Also observed was the multiple regression between the uranium equivalent con-tent variable and all other gamma-ray spectrometry variables and the analytic signal. One purpose was an attempt at modeling and eliminating the effects of geological processes from the different lithotypes or, moreover, to enhance the radioelement anomalous concentrations. In each one of the cases, the regression model was subtracted from the original data and the residues were spa-tially observed (Pires, 1995; Wellman, 1998).
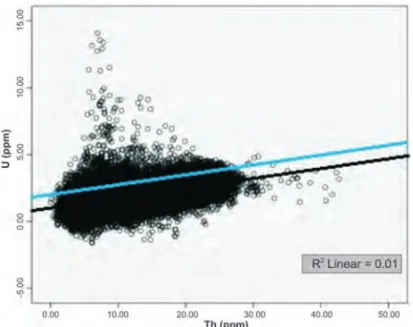
Products were generated as dispersion graphs for eTh, K and ASA in function of the eU (Figs. 5, 6 and 7, respectively), helping to analyze the direct or inverse correlation among such pairs of elements. This is how the regression lines, represented by equa-tions 1, 2 and 3, were calculated. These lines are represented in black in Figures 5, 6 and 7, respectively. Based on the analysis of the dispersion graphs and their respective regression lines, it was verified that the regression lines, although registering a re-lationship of statistical dependence of the uranium with the other parameters, had as intersection value a low uranium content. We opted to use a parallel of the regression line keeping the ura-nium value at the intersection always to a minimum content of 2 ppm, corresponding to the average of the Earth’s crust (IAEA, 2003). The regression lines obtained, defined by equations 4, 5 and 6, are represented in blue in Figures 5, 6 and 7, respectively.
“main” — 2013/7/31 — 18:28 — page 465 — #7
FIANCO CB, VIDOTTI RM, PIRES ACB & CARMELO AC
465
Figure 5 – Graph of Thorium dispersion as a function of uranium and the regression lines: black – the original line, and blue – line displaced up to 2 ppm.
Figure 6 – Graph of Potassium dispersion as a function of uranium and the regression lines: black – the original line, and blue – line displaced up to 2 ppm.
Figure 7 – Graph of analytic signal amplitude (ASA) values dispersion as a function of uranium and the regression lines: black – the original line, and blue – line displaced up to 2 ppm.
These results were fundamental for the methodology to establish and define uranium anomalous concentrations in the area, inde-pendent of the lithotype.
U = 0.915 + 0.074 ∗ eT h (1) U = 1.739 + 0.093 ∗ K (2) U = 2.004 − 35.223 ∗ ASA (3) Un = 2 + 0.074 ∗ eT h (4) Un = 2 + 0.093 ∗ K (5) Un = 2 − 35.223 ∗ ASA (6) The new generated equations (4, 5 and 6) were applied to the data and maps were produced with estimated uranium values (ppm) normalized in relation to K, eTh and ASA, for a bet-ter visualization of this element’s anomalies. The differences on these maps compared with the original uranium map present new target areas with values considered anomalous for uranium.
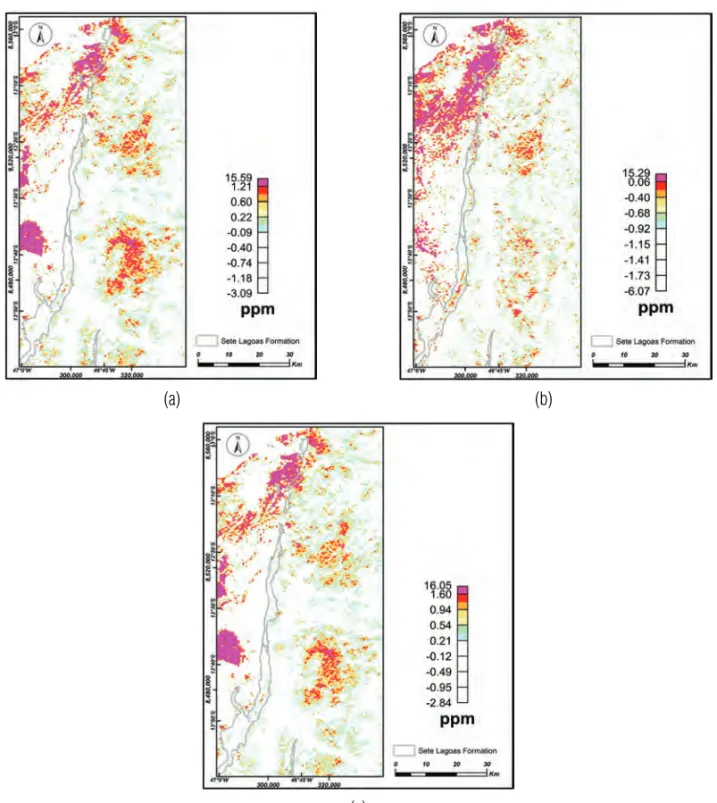
It may be seen on maps with uranium estimates (Figs. 8a, 8b and 8c), that values above the average are in color. Values cor-responding to the average value plus two standard-deviations are represented in magenta, on top of the legend.
After analyzing each one of the anomalous uranium images, it can be seen that the estimated uranium (eU) map in relation to the K (Fig. 8a) presents an enrichment mainly in the biotite-granite area, Pedra Branca Suite, and areas where the lateritic crusts are found. The map with estimated uranium normalized by eTh (Fig. 8b) shows that the main areas, where the enrichment hap-pens, are located in the northwestern portion, in an area domi-nated by basement rocks, such as those of the Ticunzal Formation. Normalization seen from the ASA image (Fig. 8c) make evident the uranium enrichment in areas corresponding to the biotite-granite, the lateritic crusts, and an area where the Ticunzal For-mation is situated, with metamorphic rocks.
Mattoso & Formoso (2007) showed that the geochemical sig-nature for sedimentary chemical deposits of phosphates in mud-stones, carbonates and sandstones comprise the elements P, N, F, C and U, and other elements may be incorporated due to external factors of the geotectonic environment and local conditions of the deposit formation.
The geochemical data handled in this work, are available in the GIS (Geographic Information System) of the State of Goi´as, and they integrate stream sediment geochemical database (Mo-reira et al., 2008). It should be stressed that there is no control over such data, since no information on sampling dates, location and acquisition methodology is available.
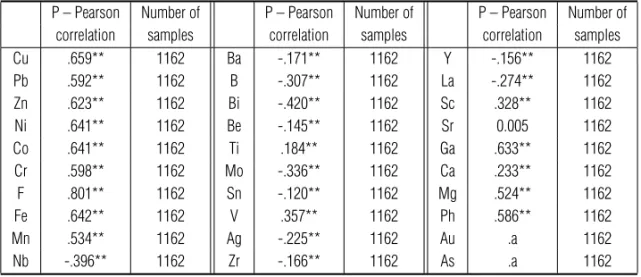
A correlation of several elements in relation to phosphorus was carried out with the geochemical data (Table 3). A strong correlation between phosphorus and the metallic elements was noticed, such as between P and F, on the order of 80%, as was expected, once apatite has both elements in its composition.
The geochemical database and the airborne geophysics prod-ucts were processed using an integration methodology that ana-lyzes mainly the P and F elements. In this analysis the values were normalized so that the differences among measurement units for the analyzed elements do not influence the result.
The statistics of phosphorus geochemical data gave an aver-age value of 196 ppm and 208 ppm for standard deviation. The background was defined as being the average grade, the average grade plus two standard deviations were defined as the thresh-old, and higher grades were considered anomalous. For this case, phosphorus grades above 600 ppm were considered anomalous (Fig. 9).
Based on this information, small areas containing the anoma-lous geochemical values for phosphorus were outlined, and the multiple regression techniques were applied to them, comparing the uranium and phosphorus patterns with the geophysical data (K, eTh, eU, eU/K, eU/eTh, eTh/K, ASA) and fluorine. Data used herein were normalized by the average in order that they could be compared amongst themselves bearing one same unit.
Uppm = 2.08 + 0.00241 ∗ ASAn + 0.0269 ∗ Kn + 0.524 ∗ T hn − 0.227 ∗ T hK n + 0.0304 ∗ U K n + 0.450 ∗ U T hn + 0.0196 ∗ Pn (7) Pppm = 545 − 17.7 ∗ ASAn − 27.4 ∗ Kn − 36, 6 ∗ T hn − 11.3 ∗ T hK n + 35.9 ∗ Un + 2.02 ∗ U K n − 64.2 ∗ U T hn (8) Uppm = 2.08 + 0.00312 ∗ ASAn + 0.0343 ∗ Kn + 0.536 ∗ T hn − 0.233 ∗ T hK n + 0.03108 ∗ U K n + 0.448 ∗ U T hn + 0.0271 ∗ Pn − 0.0306 ∗ Fn (9)
Analysis of the equations generated from the regressions dis-play that the uranium estimate is strongly controlled by the eTh and the eU/eTh ratio, as can be observed in equations 7 and 9. The phosphorus estimate is inversely related to the eTh and K, being controlled by U (Eq. 8).
The new map with uranium estimate in PPM (Fig. 10) was generated after applying the new function (7), that presents a 81% correlation, all over the study area, where are observed regions with the same geochemical and geophysical signature
“main” — 2013/7/31 — 18:28 — page 467 — #9
FIANCO CB, VIDOTTI RM, PIRES ACB & CARMELO AC
467
(a) (b)
(c)
Figure 8 – (a) Map of eU – Uranium estimates (ppm), calculated from linear regression with respect to K; (b) Map of eU – Uranium estimates (ppm), calculated from linear regression with respect to Th; (c) Map of eU Uranium estimates (ppm), calculated from linear regression with respect to ASA. as the areas with high P grades (based on collection points for
stream sediment geochemistry).
The same color palette of the maps previously presented was used with the purpose to show only values above the average. The color magenta represents the average value plus two standard-deviations, what is considered an anomalous value in the present work. In Figure 10, areas indicating anomalous uranium cor-respond to the biotite-granite and, in the northeastern area, the basement metamorphic rocks are represented with values above 2.46 ppm in red and magenta (Fig. 10).
Considering the strong correlation of phosphorus with fluo-rine, found both in data from the study area and in the literature, a regression analysis was applied corresponding to the used ele-ments (K, eTh, eU/K, eU/eTh, eTh/K, ASA, P and F). Figure 11a shows the phosphorus estimate in ppm, when applied the regres-sion equation (8), with only 4% of correlation of P related to eU, K, eTh, eU/K, eU/eTh, eTh/K and ASA. Map 11b shows the ura-nium estimate in ppm, when applied the regression equation (9), with 82% of correlation among the elements, of U related to K, eTh, eU, eU/K, eU/eTh, eTh/K, ASA, P and F.
Table 3 – Tables with correlations between phosphorus and other chemical elements.
P – Pearson Number of P – Pearson Number of P – Pearson Number of correlation samples correlation samples correlation samples Cu .659** 1162 Ba -.171** 1162 Y -.156** 1162 Pb .592** 1162 B -.307** 1162 La -.274** 1162 Zn .623** 1162 Bi -.420** 1162 Sc .328** 1162 Ni .641** 1162 Be -.145** 1162 Sr 0.005 1162 Co .641** 1162 Ti .184** 1162 Ga .633** 1162 Cr .598** 1162 Mo -.336** 1162 Ca .233** 1162 F .801** 1162 Sn -.120** 1162 Mg .524** 1162 Fe .642** 1162 V .357** 1162 Ph .586** 1162 Mn .534** 1162 Ag -.225** 1162 Au .a 1162 Nb -.396** 1162 Zr -.166** 1162 As .a 1162
*In 95% of the cases, correlation is significant. **In 99% of the cases, correlation is significant.
Figure 9 – Location map with stream sediments sampling stations (geochem-ical data), displaying only those with P – Phosphorus contents above 600 ppm (equivalent to average values plus two standard deviations).
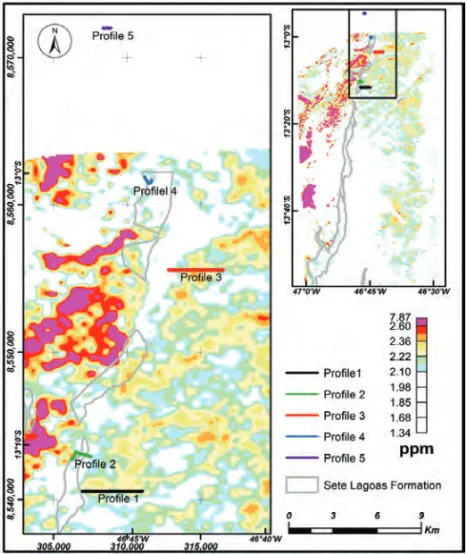
Based on the results, four profiles were selected (Fig. 12) for subsequent ground gamma-ray spectrometry investigation, tak-ing into consideration the processtak-ing results, images with eU and P estimates, and the known geology for the area.
DISCUSSIONS AND CONCLUSIONS
It is possible to observe a vast similarity among the maps of U estimate in ppm taking into account the elements K, eTh, eU, eU/K, eU/eTh, eTh/K, ASA, P (Fig. 10) and, taking into
consider-ation the same elements and including fluorine during the regres-sion calculation (Fig. 11a). When analyzing the statistics between both maps the difference is on the order of decimal values.
Figure 10 – Map of Uranium estimates in ppm, results from linear regression equation between eU and eTh, K, eU/K, eU/eTh, eTh/K and ASA.
As it can be observed in the images generated with the regres-sion results, areas with lateritic crust and igneous rocks are well mapped by the high values of eU and eTh radioelements.
Small P and U anomalies were identified in rocks of the Serra de Santa Helena and Sete Lagoas formations, from the Bambu´ı Group, with known bodies of phosphatic rocks in the study area.
“main” — 2013/7/31 — 18:28 — page 469 — #11
FIANCO CB, VIDOTTI RM, PIRES ACB & CARMELO AC
469
(a) (b)
Figure 11 – (a) Map of Phosphorus estimates in ppm, results from linear regression equation between P and eU, K, eTh, eU/K, eU/eTh, eTh/K and ASA. (b) Map of Uranium estimates in ppm, results from linear regression equation between eU and K, eTh, eU, eU/K, eU/eTh, eTh/K, ASA, P and F.
Figure 12 – Detailed eU (ppm) map (Fig. 10) and location of four profiles selected for ground gamma-ray spectrometry future surveys.
After analyzing images generated during this work, mainly with uranium and phosphorus estimates, it may be concluded that:
1. Excluding the interference of areas with high values of eU and eTh, such as basement and lateritic crusts, it is possi-ble to map U and P-enriched areas, what can indicate new prospective phosphorite areas; and
2. Four profiles were selected (Fig. 12) for future gamma-ray spectrometry ground investigation.
ACKNOWLEDGMENTS
The authors gratefully acknowledge the Instituto de Geociˆencias of the Universdade de Bras´ılia (IG/UnB) for the whole infrastruc-ture provided and equipment provided, Itaf´os Minerac¸˜ao Ltda. for support in the field work, information made available and permis-sion for data publication, and the Superintendˆencia de Geologia e Minerac¸˜ao do Governo do Estado de Goi´as for the assignment of airborne geophysical data of Area V. Thanks, too, to ESRI for mak-ing available the software package ArcGis 10 by means of contract number 2011 MLK 8733, and to IMAGE, for software permits be-tween IG-UnB and ESRI and for technical support. Acknowledge-ments to contributions given by three anonymous reviewers and revision and suggestions made by Prof. Francisco Jos´e Fonseca Ferreira (UFPR).
REFERENCES
COOK PJ & SHERGOLD JH (Eds.). 1986. Phosphate deposits of the world. Volume 1: Proterozoic and Cambrian phosphorites. London, Cambridge University Press, 386 p.
DARDENNE MA. 1978. S´ıntese sobre a estratigrafia do Grupo Bambu´ıno Brasil Central. In: SBG, Congresso Brasileiro de Geologia, 30, Recife, Proceedings, 2: 597–610.
DAVIS JC. 1973. Statistics and data analysis in geology. Copyright. Kansas Geological Survey. 550 p.
FERREIRA CJ, MOREIRA-NORDEMANN LM & NORDEMANN DJR.
1992. A radioatividade natural da regi˜ao de Irecˆe, BA. Revista Brasileira de Geociˆencias, 22(2): 167–174.
IAEA – International Atomic Energy Agency, 2003. Guideline for radio-element mapping using gamma ray spectrometry data. Vienna, Austria. 152 p.
LASA ENGENHARIA E PROSPECC¸˜OES, 2006. Levantamento Aero-geof´ısico do Estado de Goi´as – 3a. Etapa. Relat´orio final do levantamento e processamento dos dados magnetom´etricos e gamaespectrom´etricos. Texto t´ecnico. 138 p.
MATTOSO SQ & FORMOSO MLL. 2007. Princ´ıpios B´asicos para Prospecc¸˜ao Geoqu´ımica. In: LICHT OAB, DE MELLO CSB & DA SILVA CR (Eds.). Prospecc¸˜ao Geoqu´ımica – Dep´ositos minerais met´alicos, n˜ao-met´alicos, ´oleo e g´as. SBGq/CPRM, Rio de Janeiro, p. 97–152. MONTEIRO C. 2009. Fosforitos do grupo Bambu´ı na Regi˜ao de Campos belos (GO)/ Arraias (TO) na borda oeste do Cr´aton S˜ao Francisco. Master dissertation of Geology, Universidade de Bras´ılia. 114 p.
MOREIRA MLO, MORETON LC, ARA´UJO VA, LACERDA JV & COSTA HF. 2008. Geologia do Estado de Goi´as e Distrito Federal. Escala 1:500.000. Goiˆania: CPRM/SIC – FUNMINERAL. 141 p.
PIRES ACB. 1995. Identificac¸˜ao Geof´ısica de ´Areas de Alterac¸˜ao Hidroter-mal, Crix´as-Guarinos, Goi´as. Revista Brasileira de Geociˆencias, 25(1): 61–68.
PIRES ACB, VIDOTTI RM & CARMELO AC. 2010. Realce de anoma-lias de urˆanio por regress˜oes m´ultiplas em levantamento aerogeof´ısico no sudeste de Goi´as. In: IV SimBGf, Simp´osio Brasileiro de Geof´ısica, Bras´ılia, Proceedings. CD-ROM.
SOUZA AE & CARDOSO VRS. 2008. Sum´ario Mineral – DNPM, Fosfato. Available on: <http://www.dnpm.gov.br/assets/galeriaDocumento/Sumario-Mineral2008/fosfato.pdf>. Access on: Nov. 16, 2009.
SOUZA AE & FONSECA DS. 2009. Economia Mineral do Brasil – 2009, fosfato. DNPM. Available on:
<https://sistemas.dnpm.gov.br/publicacao/mostra imagem.asp?IDBancoArqui-voArquivo=4003>. Access on: Nov. 17, 2010.
WELLMAN P. 1998. Mapping of a granite batholiths using geological and remotely sensed data: the Mount Edgar Batholith, Pilbara Craton. Exploration Geophysics, 29: 643–648.
“main” — 2013/7/31 — 18:28 — page 471 — #13
FIANCO CB, VIDOTTI RM, PIRES ACB & CARMELO AC
471
NOTES ABOUT THE AUTHORS
Chris Busnello Fianco. M.Sc. in Applied Geosciences (Universidade de Bras´ılia), B.Sc. in Geology (Universidade Federal do Paran´a – UFPR). Four-year professional experience with airborne geophysical data acquisition and processing. Currently works as geologist for the mining industry. Areas of interest: Applied Geophysics to mineral exploration.
Roberta Mary Vidotti. Associate Professor at the Instituto de Geociˆencias of Universidade de Bras´ılia. Graduated in Geology at Universidade Federal Rural do Rio de Janeiro (1987), specialized in Geology and Marine Geophysics at Universidade Federal Fluminense (1987). M.Sc. in Geophysics from Observat ´orio Nacional (1992) and Ph.D. in Geophysics at the University of Leeds (1997). Has experience in Applied Geophysics, with emphasis on gravity, magnetic and gamma-ray spectrometry methods applied to regional geology, geotectonic, sedimentary basins and mineral prospecting.
Augusto C´esar Bittencourt Pires. Ph.D. in Geophysics (Colorado School of Mines, 1975), B.Sc. in Geology (Universidade Federal do Rio de Janeiro, 1968). Former president of the SBGf (Brazilian Geophysical Society). Responsible for the Geophysics Department at ENCAL Consultores Associados; Head of the Geophysics Department at the Observat´orio Nacional; Head of the Applied Geophysics Center of the National Department of Mineral Production (DNPM). At the National Research Council (CNPq) had the following positions: Geosciences Supervisor, Coordinator of Exact and Earth Sciences, Superintendent of Exact and Earth Sciences and Director of Programs. Director of Programs for the Coordination of Superior Education (CAPES) and Coordinator of Policies and Plans of the Ministry of Science and Technology. Legislative Consultant for the Senate for issues referring to Mines and Energy. Specialist in the application of geophysical methods as supporting tool for geologic mapping, mineral exploration and environmental analysis. Currently works as Professor at the Instituto de Geociˆencias of the University of Bras´ılia (UnB).
Adriana Chatack Carmelo. Ph.D. in Data Processing in Geology and Environmental Analysis and M.Sc. in Regional Geology, B.Sc. in Geology (Universidade de Bras´ılia – UnB). Experience with Applied Geophysics and Data Integration for mineral exploration, geologic mapping and groundwater (fractured aquifers). Currently works as Adjunct Professor (IG/UnB), teaching Gamma-ray Spectrometry Prospection, Rock’s Physical Properties and General Geology.