buildings
ArticlePredicting the Air Quality, Thermal Comfort and
Draught Risk for a Virtual Classroom with Desk-Type
Personalized Ventilation Systems
Eusébio Z. E. Conceição1,*ID, Cristina I. M. Santiago1, Mª. Manuela J. R. Lúcio1
and Hazim B. Awbi2
1 Faculty of Science and Technology, University of Algarve, Campus de Gambelas, 8005-139 Faro, Portugal; cristina.im.santiago@gmail.com (C.I.M.S.); maria.manuela.lucio@gmail.com (Mª.M.J.R.L.)
2 School of Built Environment, University of Reading, Reading RG6 6AW, UK; h.b.awbi@reading.ac.uk
* Correspondence: econcei@ualg.pt; Tel.: +003-51-289800900
Received: 29 December 2017; Accepted: 13 February 2018; Published: 22 February 2018
Abstract: This paper concerns the prediction of indoor air quality (IAQ), thermal comfort (TC) and draught risk (DR) for a virtual classroom with desk-type personalized ventilation system (PVS). This numerical study considers a coupling of the computational fluid dynamics (CFD), human thermal comfort (HTC) and building thermal behavior (BTB) numerical models. The following indexes are used: the predicted percentage of dissatisfied people (PPD) index is used for the evaluation of the TC level; the carbon dioxide (CO2) concentration in the breathing zone is used for the calculation of IAQ; and the DR level around the occupants is used for the evaluation of the discomfort due to draught. The air distribution index (ADI), based in the TC level, the IAQ level, the effectiveness for heat removal and the effectiveness for contaminant removal, is used for evaluating the performance of the personalized air distribution system. The numerical simulation is made for a virtual classroom with six desks. Each desk is equipped with one PVS with two air terminal devices located overhead and two air terminal devices located below the desktop. In one numerical simulation six occupants are used, while in another simulation twelve occupants are considered. For each numerical simulation an air supply temperature of 20◦C and 24◦C is applied. The results obtained show that the ADI value is higher for twelve persons than for six persons in the classroom and it is higher for an inlet air temperature of 20◦C than for an inlet air temperature of 24◦C. In future works, more combinations of upper and lower air terminal devices located around the body area and more combinations of occupants located in the desks will be analyzed.
Keywords:thermal comfort; indoor air quality; draught risk; air distribution index
1. Introduction
In recent years the concept of PVS has been introduced. This system is based on positioning one air terminal device in the upper body area. In general, with only one air terminal device, with incidence in the upper body area, the IAQ will be improved.
When using more than one air terminal device with incidence in the upper and lower body areas, the IAQ as well as the TC and the DR can be improved. These topics, namely the IAQ, the TC and the DR, will be analyzed in detail in the present work.
The conventional PVS is characterized by introducing clean, cold (or warm) dry air from an outdoor supply, with low air velocity and low air turbulence intensity to the occupants’ breathing area [1]. This conventional PVS can provide individual control of inlet air temperature, airflow rate and direction.
Buildings 2018, 8, 35 2 of 22
Different types of PVS with one air terminal device have been studied, e.g., [2–9]. In Cermark et al. the measurements at the breathing zone with PVS were made [2], and in Melikov et al. the evaluation of different types of PVS air terminal devices were analyzed [3]. The environment around human body with PVS was studied using CFD [4], the human thermal response to PVS and mixing ventilation system was applied in [5], the modeling the performance of PVS in several conditions in a room was analyzed in [6] and the conjunction of PVS with mixing ventilation system and displacement ventilation system was studied in [7]. In Niu et al. the study using experimental techniques on a chair-based PVS was developed [8], and in Sun et al. the personalized dynamic ventilation was analyzed [9].
More recent studies have introduced PVS with more than one air terminal device. In Melikov et al. five air terminal devices for a PVS were developed, tested and compared [3]. It was possible to conclude that, in general, this ventilation system helps improve occupants’ satisfaction with the IAQ level. In Melikov et al. the performance of personalized ventilation using seat headrest-mounted air terminal devices was analyzed [10]. The TC level and the IAQ level were studied. Pan et al. compared the PVS with a central air-conditioning system [11]. They concluded that for the same TC the PVS consumed less energy than the central air-conditioning system. In Muhic and Butala, using measurements and simulations, it was possible to verify that the PVS is very efficient [12]. Conceição et al. studied two configurations of the PVS implemented in classroom desks [13]: the first with only one air terminal device (localized above the desk area) and the second with two air terminal devices (one placed above and another placed below the desk area). The configurations with two air terminal devices produced a more uniform air velocity distribution around the occupant. An evaluation of seated occupant’s TC in desks equipped with PVS with two air terminal devices was carried out in [14]. With the implementation of the PVS, the TC was implemented and the IAQ level in the breathing area was acceptable.
In this work, the predicted mean vote (PMV) and the PPD indexes, developed by Fanger [15], and presented in ANSI/ASHRAE Standard 55 and ISO 7730, [16,17], were used to predict the TC level. The PMV and the PPD indexes are functions of the mean air temperature, mean air velocity, mean relative humidity, mean radiant temperature (MRT), clothing level and activity level. In the evaluation of the local thermal discomfort level the DR, described in ISO 7730 and developed by Fanger et al. was used [17,18]. The DR is dependent on the mean air temperature, mean air velocity and mean turbulence intensity. Finally, the CO2concentration level, presented in ANSI/ASHRAE Standard 62.1. and Portuguese standards presented in DL 79/2006, was used for evaluating the IAQ, [19,20]. The ADI, that was developed by Awbi [21], for uniform thermal environment, and includes the TC, the IAQ and the ventilation effectiveness, namely the effectiveness for heat removal and the effectiveness for contaminant removal.
The ADI is used, as example, to evaluate the ventilation system performance and for comparing the performances of different ventilation systems. This index was used in Cho et al. for comparing the performance of four ventilation systems [22], in Cho et al. for evaluating the performance of a mixing ventilation system under different conditions in the environment [23], in Cho et al. for evaluating a confluent jets ventilation system [24], and in Karimipanah et al. for studying the environment in classrooms with two different floor air supply systems [25].
Originally, the ADI concept, developed by Awbi [21], was to be used for uniform environments. However, in Conceição et al. it was adapted to be used for non-uniform environments of multi-occupation, in order to study spaces equipped with mixing ventilation and with cold radiant floor and occupied by two virtual manikins [26]. Also, Conceição et al. evaluated several ceiling-mounted air distribution systems in a virtual classroom environment with six and twelve virtual manikins using the ADI concept for non-uniform environment [27].
Other studies have also used the ADI concept. In a study of the ventilation energy efficiency in buildings, Awbi reviewed and discussed several ventilation systems namely, natural ventilation, mechanical ventilation and hybrid ventilation systems [28]. In this work a new ADI model was
Buildings 2018, 8, 35 3 of 22
introduced for non-uniform thermal environments. Almesri et al. presented a study for assessing the TC and the IAQ levels in uniform and non-uniform thermal environments [29]. In this work the overall TC level was based on a weighted average of the local TC level evaluated for the different human body segments and an evaluation of the overall human thermal response using the original 2-node Pierce model. The application was made in a test chamber equipped with mixing and displacement ventilation with one manikin. Awbi studied the performance of different ventilation systems on the basis of IAQ and energy efficiency [30]. In this work an overview of several types of mechanical ventilation and air distribution systems used is buildings was presented. The ADI models used in uniform and non-uniform environments were also presented.
Different models for the CFD numerical simulation of thermal virtual manikins have been developed in the last few years. Some models used simplified virtual manikins, using joint blocks (see [31–33]). An application of CFD models with occupants was analyzed in [31]. In this study the virtual manikin was divided in one, three and four boxes. The CFD model also applied in occupants divided in four boxes was analyzed in [32]. In this study of indoor environment in classrooms, contaminant dispersion, heat transfer and airflow around the virtual manikin were analyzed. The analysis of the effects of geometry approximation and grid simplification in the study of the airflow around a virtual manikin is described in [33]. In this study, the virtual manikin was divided in one, three and six blocks.
Conceição and Lúcio in a work about the TC level in spaces equipped with forced ventilation and warm radiant floor, applied this numerical simulation of thermal virtual manikins applied in the present work [34]. In this study a chamber, a desk, two seats, two hygro-thermal manikins, a warm radiant floor, a solar radiation simulator and a water solar collector were used numerically and experimentally. In this study, using a virtual manikin divided in 25 boxes, the obtained results with k-epsilon turbulence model and the Re-Normalization Group (RNG) turbulence model were compared with the experimental results. In the numerical validation local experimental values and local numerical values, of the chamber surface temperature, the air velocity, the air temperature, the air turbulent intensity and the DR were used in the validation of the numerical model. A good agreement between numerical and experimental results are used. The agreement of the RNG turbulence model, is better than when the k-epsilon turbulence model.
The main objectives of the paper, present in this work, is the evaluation of IAQ, TC, DR and ADI for a virtual classroom with desk-type PVS. The classroom is equipped with six desks and each desk is equipped with one PVS with two air terminal devices located overhead and two air terminal devices located below the desktop. In one numerical simulation six occupants are used, while in another simulation twelve occupants are considered. For each numerical simulation, an air supply temperature of 20◦C and 24◦C is applied.
The application of this solution in real buildings, in accordance with the philosophy analyzed and developed in this work, will be made in classroom spaces, or other in or spaces with uniform and high occupation density. The implementation will be made with one inlet ventilation duct system, located in the floor level, and with one or more exit ducts system, located in the ceiling level. The inlet ventilation ducts system is connected with the PVS installed in the desks. The inlet ventilation ducts system in news buildings can be implemented above the floor level, while in old buildings can be implemented in low corners located between the floor and the lateral walls. The exit duct system can be distributed along all ceiling, in order to guarantee, in all space, a uniform polluted air exit.
2. Methodologies
This work is a continuation of the previous work developed in [26,27], where the ADI was used for non-uniform environment. In Conceição et al. this numerical model was used to evaluate the environment in spaces equipped with mixing ventilation and cold radiant floor [26]; in Conceição et al. the focus was on evaluating the influence of the descendent jets on the room occupants [27]; while in this work these numerical models are used to evaluate the influence of PVS on the occupants.
Buildings 2018, 8, 35 4 of 22
2.1. CFD, HTC and BTB Numerical Models
In this work, a CFD model, a HTC model and a BTB model are used. The first and the second ones are coupled for the purpose of simulation.
The CFD numerical model considers the three-dimensional turbulent airflows under steady-state and non-isothermal conditions. The numerical model solves the partial differential equations (using the finite volume method), namely, the mass continuity equation, moment equations (three-dimensional air velocity), energy equation, turbulence kinetic energy equation and turbulence energy dissipation rate equation (using the RNG turbulence model) and the CO2concentration equation. This numerical model is used to evaluate the airflow around the occupants (three-dimensional components of air velocity; omnidirectional air velocity, air temperature, air pressure, turbulent kinetic energy, turbulent energy dissipation rate, and CO2concentration), the IAQ (using CO2concentration level) and the DR levels (using the air temperature, air velocity and air turbulence intensity). In the CFD numerical model each virtual manikin is based on 25 boxes elements. For the purpose of this study, such manikins require less intensive solutions than more complicated human shape manikins. However, this simplification was found to have little impact on the results [29].
The HTC numerical model considers the clothed human body thermal response. In the human body thermal response, considerations are given to the energy balance integral equations for the body tissue and the blood and mass balance integral equations for the blood and transpired water; while in the clothing thermal response, considerations are given to the energy balance integral equations for the clothing and the mass balance integral equations for the transpired water. The resolution of this system of equations is made using the Runge–Kutta–Fehlberg method with error control. This numerical model is used to calculate the human parameters (body tissue temperature, blood arterial and venous temperature and skin water vapor), the clothing parameters (layers’ temperature and layers’ water vapor) and the human TC level. The TC level that each occupant is subjected to, is calculated using a human thermal response approach based on the Fanger model under steady-state conditions by considering the different heat exchanges between the body and the environment. The HTC numerical model is based on 25×12 nodes elements (see more details about the HTC in [35] and the thermoregulatory system on [36]). The model considers the human body divided into 25 cylindrical and spherical elements with each one divided in to 12 concentric layers, which can be protected by several clothing concentric layers.
Each one of the CFD model boxes is represented as one HTC cylindrical and spherical elements. The boxes, cylindrical and spherical elements are associated with the following: head, neck, chest, upper abdomen, lower abdomen, right upper shoulder, right lower shoulder, right upper arm, right lower arm, right hand, left upper shoulder, left lower shoulder, left upper arm, left lower arm, left hand, right upper thigh, right lower thigh, right upper leg, right lower leg, right foot, left upper thigh, left lower thigh, left upper leg, left lower leg and left foot.
The BTB numerical model considers the energy balance integral equations for the indoor spaces, opaque bodies, transparent bodies (windows) and interior bodies. The resolution of this equation system is also made using the Runge–Kutta–Fehlberg method with error control. This numerical model (using internal ventilation and occupant heat load), is used to calculate the indoor, opaque bodies (ceiling, floor and walls), transparent bodies (windows) and interior bodies’ (desk) temperatures. The opaque bodies are divided into several layers, while for the other bodies one layer is considered. In numerical simulation, the surrounding and interior surfaces temperatures are evaluated using the BTB and the environmental parameters; and the comfort levels are calculated by an iterative method using the HTC and CFD, as follows:
• The BTB numerical model calculates the surrounding and interior surfaces temperature. The external and internal environment conditions, the renovation airflow and occupant numbers are used for this purpose.
Buildings 2018, 8, 35 5 of 22
• The HTC numerical model calculates the body and clothing temperatures and the TC level. The chamber surrounding temperatures which is used evaluate the MRT, is calculated using the BTB, and the occupant surrounding environments variables is calculated by the CFD numerical model.
• The CFD numerical model calculates the environmental parameters around the occupants, the DR and the IAQ. The skin and clothing temperatures are calculated using the HTC, and chamber temperatures are calculated using the BTB.
• An iterative solution coupling the HTC and the CFD is applied.
2.2. ADI Method
The ADI, which is a function of the thermal comfort number and the air quality number, see [21], is evaluated using:
ADI=q2 NTC×NAQ (1)
where:
NTC—Thermal comfort number; NAQ—Air quality number.
The thermal comfort number is the quotient of the effectiveness for heat removal and the PPD, while the air quality number is calculated as the quotient between the effectiveness for contaminant removal and the percentage of dissatisfied (PD) with the IAQ (see [21,26]).
For the effectiveness for heat removal, the mean air temperature around each occupant is calculated using a weighted average of the local air temperature that each body segment is subjected to; while in the effectiveness for contaminant removal the CO2concentration in the respiration area (in the breathing zone area) is used.
This method is used to obtain simultaneously the influence of TC, IAQ, effectiveness for heat removal and effectiveness for contaminant removal. The ADI was presented in detail in [21] for uniform environments and is analyzed in [26] for non-uniform environments.
2.3. Numerical Methodology
The evaluations are carried out for a virtual classroom with six desks equipped with six personalized ventilation air supplies. Each desk is equipped with two air terminal devices located overhead and two air terminal devices located above the desktop. In one test, six occupants and six desks are used, while in another test twelve occupants and six desks are considered.
The supply airflow is provided by different air terminal devices, located in the desk, while the extract air is through two openings in the central ceiling area of the classroom.
The HTC model consideration covered 144 surrounding surfaces compartment (see Figure1). Each surface is divided in 10× 10 infinitesimal grids. The HTC also considers the human body surfaces as 25 cylindrical and spherical elements (see Figure1). The grid of each element is built with 8×8 infinitesimal elements. Figure1also presents the number of occupants considered in the two numerical simulations.
The grids which are applied to the surrounding surfaces and the occupants’ elements, are used to evaluate the heat exchange by radiation inside the room.
For the CFD numerical simulation, the calculated values were performed with a main computational grid of 90×51×50 and 0.05 m elements in the X, Y and Z directions (see Figure2). Gid refinement is carried out at the inlet and outlet and near the surfaces of the occupants and surrounding room surfaces (wall, ceiling, floor and desk). Thus, in the simulation, a non-uniform grid of 248×146×97 is used when 6 occupants are considered and a non-uniform grid of 248×176×97 is used when 12 occupants are considered.
In the numerical simulation with six and twelve occupants, the inlet air temperature is 20◦C and 24◦C, respectively. In summer conditions the occupants were clothed with typical summer clothing
Buildings 2018, 8, 35 6 of 22
(0.5 Clo) and in winter conditions the occupants were clothed with typical winter clothing (1 Clo). In both conditions a typical activity level (1.2 Met) is used. For the numerical simulation the indoor relative humidity was kept at 50%.
Figure3shows the scheme of the desk-equipped PVS with two upper and two lower air terminal devices, position and flow direction. The air terminal devices are represented with grey color, with an area of 10×10 cm2, and the flow direction is represented by an arrow.
The input conditions, used in the CFD numerical model, can be seen in Table1. This table presents the inlet CO2concentration, inlet air turbulence intensity, inlet air temperature, inlet air velocity and number of occupants.
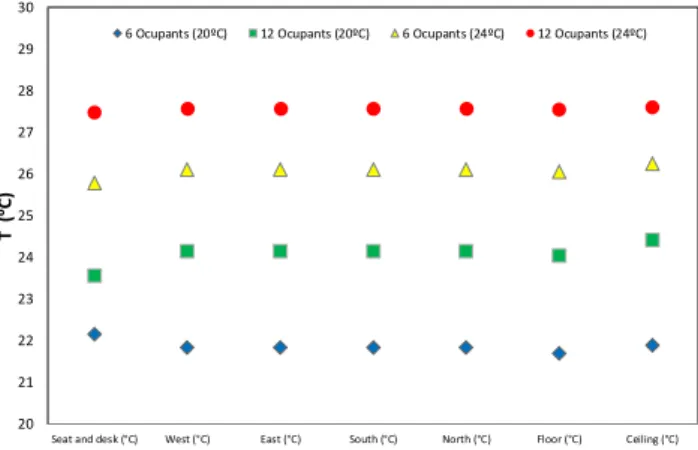
The surrounding surfaces temperatures, which are used in both the CFD numerical model and calculated by the BTB numerical model, are presented in Figure4. This figure presents the surfaces surrounding temperatures used in the CFD simulation and calculated by the BTB.
Buildings 2018, 8, x FOR PEER REVIEW 6 of 22
Figure 3 shows the scheme of the desk-equipped PVS with two upper and two lower air terminal devices, position and flow direction. The air terminal devices are represented with grey color, with an area of 10 × 10 cm2, and the flow direction is represented by an arrow.
The input conditions, used in the CFD numerical model, can be seen in Table 1. This table presents the inlet CO2 concentration, inlet air turbulence intensity, inlet air temperature, inlet air
velocity and number of occupants.
The surrounding surfaces temperatures, which are used in both the CFD numerical model and calculated by the BTB numerical model, are presented in Figure 4. This figure presents the surfaces surrounding temperatures used in the CFD simulation and calculated by the BTB.
(a) (b)
Figure 1. Grid used in the integral human thermal comfort (HTC) model simulation for (a) 6 occupants
and (b) 12 occupants. (a) (b)
1
2
3
4
5
6
1 2 4 5 3 6 7 8 10 9 11 12Figure 1.Grid used in the integral human thermal comfort (HTC) model simulation for (a) 6 occupants
and (b) 12 occupants.
Buildings 2018, 8, x FOR PEER REVIEW 6 of 22
Figure 3 shows the scheme of the desk-equipped PVS with two upper and two lower air terminal devices, position and flow direction. The air terminal devices are represented with grey color, with
an area of 10 × 10 cm2, and the flow direction is represented by an arrow.
The input conditions, used in the CFD numerical model, can be seen in Table 1. This table
presents the inlet CO2 concentration, inlet air turbulence intensity, inlet air temperature, inlet air
velocity and number of occupants.
The surrounding surfaces temperatures, which are used in both the CFD numerical model and calculated by the BTB numerical model, are presented in Figure 4. This figure presents the surfaces surrounding temperatures used in the CFD simulation and calculated by the BTB.
(a) (b)
Figure 1. Grid used in the integral human thermal comfort (HTC) model simulation for (a) 6 occupants
and (b) 12 occupants. (a) (b)
1
2
3
4
5
6
1 2 4 5 3 6 7 8 9 10 11 12 Figure 2. Cont.Buildings 2018, 8, 35 7 of 22
Buildings 2018, 8, x FOR PEER REVIEW 7 of 22
(c)
(d)
Figure 2. Scheme used in the integral computational fluid dynamics (CFD) virtual classroom model
simulation for (a) 6 and (b) 12 occupants and grid generation in a desk, personalized ventilation system (PVS), occupant and desk details for (c) 6 and (d) 12 occupants.
Figure 3. Scheme of the desk equipped PVS with two upper and two lower air terminal devices (grey),
position and flow direction.
Table 1. Input conditions used in the CFD simulation.
Variables Values
Inlet CO2 concentration (mg/m3) 500 500 500 500
Inlet air turbulence intensity (%) 10 10 10 10
Inlet air temperature (°C) 20 20 24 24
Inlet air velocity (m/s) 3 3 3 3
Number of occupants 6 12 6 12
Figure 2.Scheme used in the integral computational fluid dynamics (CFD) virtual classroom model
simulation for (a) 6 and (b) 12 occupants and grid generation in a desk, personalized ventilation system (PVS), occupant and desk details for (c) 6 and (d) 12 occupants.
Buildings 2018, 8, x FOR PEER REVIEW 7 of 22
(c)
(d)
Figure 2. Scheme used in the integral computational fluid dynamics (CFD) virtual classroom model
simulation for (a) 6 and (b) 12 occupants and grid generation in a desk, personalized ventilation
system (PVS), occupant and desk details for (c) 6 and (d) 12 occupants.
Figure 3. Scheme of the desk equipped PVS with two upper and two lower air terminal devices (grey),
position and flow direction.
Table 1. Input conditions used in the CFD simulation.
Variables
Values
Inlet CO
2concentration (mg/m
3) 500 500 500 500
Inlet air turbulence intensity (%)
10
10
10
10
Inlet air temperature (°C)
20
20
24
24
Inlet air velocity (m/s)
3
3
3
3
Number of occupants
6
12
6
12
Figure 3.Scheme of the desk equipped PVS with two upper and two lower air terminal devices (grey),
Buildings 2018, 8, 35 8 of 22
Table 1.Input conditions used in the CFD simulation.
Variables Values
Inlet CO2concentration (mg/m3) 500 500 500 500
Inlet air turbulence intensity (%) 10 10 10 10
Inlet air temperature (◦C) 20 20 24 24
Inlet air velocity (m/s) 3 3 3 3
Number of occupants 6 12 6 12
In Table1, for the CO2concentration at the inlet, typical values for outdoor environments are selected. For the inlet air turbulence intensity, typical values measured at the air terminal devices were specified and typical winter and summer temperature values were also used. The inlet air velocity, used for each air terminal device, was calculated from previous numerical simulation, in order to guarantee an airflow around the seated occupant at a desk and avoids promoting any airflow at the back of the seated occupants.
Buildings 2018, 8, x FOR PEER REVIEW 8 of 22
In Table 1, for the CO2 concentration at the inlet, typical values for outdoor environments are
selected. For the inlet air turbulence intensity, typical values measured at the air terminal devices were specified and typical winter and summer temperature values were also used. The inlet air velocity, used for each air terminal device, was calculated from previous numerical simulation, in order to guarantee an airflow around the seated occupant at a desk and avoids promoting any airflow at the back of the seated occupants.
Figure 4. Surrounding surfaces temperatures used in the CFD simulation and calculated by the
building thermal behavior (BTB).
For six occupants, each one is subjected to one upper and one lower air terminal devices located to the left side of the body area and one upper and one lower air terminal devices located on the right side of the body (see Figure 2a,c). For twelve occupants, each one is subjected to one upper and one lower air terminal devices located at the front body area (see Figure 2b,d).
The results of air velocity, temperature and CO2 concentration fields are presented in transversal,
Y coordinate, and longitudinal, X coordinate (see Figure 5):
• Planes locations with 6 occupants for X = 1.791 m and Y = 0.63099 m;
• Plans locations with 12 occupants for X = 1.791 m and Y = 0.4423 m.
(a) 20 21 22 23 24 25 26 27 28 29 30
Seat and desk (°C) West (°C) East (°C) South (°C) North (°C) Floor (°C) Ceiling (°C)
T (
ᵒC)
6 Ocupants (20ºC) 12 Ocupants (20ºC) 6 Ocupants (24ºC) 12 Ocupants (24ºC)
Figure 4.Surrounding surfaces temperatures used in the CFD simulation and calculated by the building
thermal behavior (BTB).
For six occupants, each one is subjected to one upper and one lower air terminal devices located to the left side of the body area and one upper and one lower air terminal devices located on the right side of the body (see Figure2a,c). For twelve occupants, each one is subjected to one upper and one lower air terminal devices located at the front body area (see Figure2b,d).
The results of air velocity, temperature and CO2concentration fields are presented in transversal, Y coordinate, and longitudinal, X coordinate (see Figure5):
• Planes locations with 6 occupants for X = 1.791 m and Y = 0.63099 m;
• Plans locations with 12 occupants for X = 1.791 m and Y = 0.4423 m.
Buildings 2018, 8, x FOR PEER REVIEW 8 of 22
In Table 1, for the CO2 concentration at the inlet, typical values for outdoor environments are
selected. For the inlet air turbulence intensity, typical values measured at the air terminal devices were specified and typical winter and summer temperature values were also used. The inlet air velocity, used for each air terminal device, was calculated from previous numerical simulation, in order to guarantee an airflow around the seated occupant at a desk and avoids promoting any airflow at the back of the seated occupants.
Figure 4. Surrounding surfaces temperatures used in the CFD simulation and calculated by the
building thermal behavior (BTB).
For six occupants, each one is subjected to one upper and one lower air terminal devices located to the left side of the body area and one upper and one lower air terminal devices located on the right side of the body (see Figure 2a,c). For twelve occupants, each one is subjected to one upper and one lower air terminal devices located at the front body area (see Figure 2b,d).
The results of air velocity, temperature and CO2 concentration fields are presented in transversal,
Y coordinate, and longitudinal, X coordinate (see Figure 5):
• Planes locations with 6 occupants for X = 1.791 m and Y = 0.63099 m; • Plans locations with 12 occupants for X = 1.791 m and Y = 0.4423 m.
(a) 20 21 22 23 24 25 26 27 28 29 30
Seat and desk (°C) West (°C) East (°C) South (°C) North (°C) Floor (°C) Ceiling (°C)
T (
ᵒC)
6 Ocupants (20ºC) 12 Ocupants (20ºC) 6 Ocupants (24ºC) 12 Ocupants (24ºC)
Buildings 2018, 8, 35 9 of 22
Buildings 2018, 8, x FOR PEER REVIEW 9 of 22
(b)
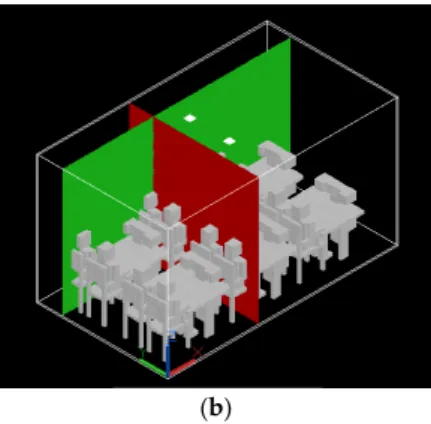
Figure 5. Three-dimensional arrangement for 6 occupants (a), X = 1.791 m (red plan) and Y = 0.63099
m (green plan) and 12 occupants (b), X = 1.791 m and Y = 0.4423 m.
3. Results and Discussion
In this section the results of airflow, the CO2 concentration field, the airflow around the
occupants, the DR level and the ADI, are presented. 3.1. Airflow Field
Figures 6 and 7 show the air velocity field in the virtual classroom for an inlet air temperature of 20 °C, with 6 and 12 occupants, respectively. The air velocity field in the virtual classroom, with an inlet air temperature of 24 °C, for 6 and 12 occupants respectively, is similar to that for 20 °C.
In accordance with the results obtained, it is possible to conclude that:
• With 6 occupants, the airflow promoted by the air terminal devices is responsible for the
ascending airflow around the occupants’ back and front areas;
• With 12 occupants, the airflow promoted with the lower air terminal devices is responsible for
the ascending airflow around the occupants’ back areas, while the upper air terminal device is responsible for the ascending airflow around the occupants’ front areas;
• The air velocity is highest at the front of the air terminal device and at the exit area near the
ceiling;
• The air velocity in the occupants’ left and right side is higher with 6 occupants than with 12
occupants, because the air terminal device for 6 occupants is located at the left and right side to the occupants;
• The air velocity in front of the occupants is higher with 12 occupants than with 6 occupants,
because the air terminal device for 12 occupants is located at the front of the occupants;
• No significant differences in the air velocity fields are verified when the inlet air temperature
changes from 20 to 24 °C. (a) 0 0.5 1 1.5 2 2.5 Y (m) 0 0.5 1 1.5 2 2.5 Z (m) 0 0.2 0.4 0.6 0.8 1 1.2 1.4 1.6 1.8 2 2.2 2.4 2.6 2.8 3
Figure 5.Three-dimensional arrangement for 6 occupants (a), X = 1.791 m (red plan) and Y = 0.63099 m
(green plan) and 12 occupants (b), X = 1.791 m and Y = 0.4423 m.
3. Results and Discussion
In this section the results of airflow, the CO2concentration field, the airflow around the occupants, the DR level and the ADI, are presented.
3.1. Airflow Field
Figures6and7show the air velocity field in the virtual classroom for an inlet air temperature of 20◦C, with 6 and 12 occupants, respectively. The air velocity field in the virtual classroom, with an inlet air temperature of 24◦C, for 6 and 12 occupants respectively, is similar to that for 20◦C.
In accordance with the results obtained, it is possible to conclude that:
• With 6 occupants, the airflow promoted by the air terminal devices is responsible for the ascending airflow around the occupants’ back and front areas;
• With 12 occupants, the airflow promoted with the lower air terminal devices is responsible for the ascending airflow around the occupants’ back areas, while the upper air terminal device is responsible for the ascending airflow around the occupants’ front areas;
• The air velocity is highest at the front of the air terminal device and at the exit area near the ceiling;
• The air velocity in the occupants’ left and right side is higher with 6 occupants than with 12 occupants, because the air terminal device for 6 occupants is located at the left and right side to the occupants;
• The air velocity in front of the occupants is higher with 12 occupants than with 6 occupants, because the air terminal device for 12 occupants is located at the front of the occupants;
• No significant differences in the air velocity fields are verified when the inlet air temperature changes from 20 to 24◦C.
Buildings 2018, 8, x FOR PEER REVIEW 9 of 22
(b)
Figure 5. Three-dimensional arrangement for 6 occupants (a), X = 1.791 m (red plan) and Y = 0.63099
m (green plan) and 12 occupants (b), X = 1.791 m and Y = 0.4423 m.
3. Results and Discussion
In this section the results of airflow, the CO2 concentration field, the airflow around the
occupants, the DR level and the ADI, are presented. 3.1. Airflow Field
Figures 6 and 7 show the air velocity field in the virtual classroom for an inlet air temperature of 20 °C, with 6 and 12 occupants, respectively. The air velocity field in the virtual classroom, with an inlet air temperature of 24 °C, for 6 and 12 occupants respectively, is similar to that for 20 °C.
In accordance with the results obtained, it is possible to conclude that:
• With 6 occupants, the airflow promoted by the air terminal devices is responsible for the
ascending airflow around the occupants’ back and front areas;
• With 12 occupants, the airflow promoted with the lower air terminal devices is responsible for
the ascending airflow around the occupants’ back areas, while the upper air terminal device is responsible for the ascending airflow around the occupants’ front areas;
• The air velocity is highest at the front of the air terminal device and at the exit area near the
ceiling;
• The air velocity in the occupants’ left and right side is higher with 6 occupants than with 12
occupants, because the air terminal device for 6 occupants is located at the left and right side to the occupants;
• The air velocity in front of the occupants is higher with 12 occupants than with 6 occupants,
because the air terminal device for 12 occupants is located at the front of the occupants;
• No significant differences in the air velocity fields are verified when the inlet air temperature
changes from 20 to 24 °C. (a) 0 0.5 1 1.5 2 2.5 Y (m) 0 0.5 1 1.5 2 2.5 Z (m) 0 0.2 0.4 0.6 0.8 1 1.2 1.4 1.6 1.8 2 2.2 2.4 2.6 2.8 3 Figure 6. Cont.
Buildings 2018, 8, 35 10 of 22
Buildings 2018, 8, x FOR PEER REVIEW 10 of 22
(b)
Figure 6. Air velocity field in the virtual classroom with 6 occupants in the plans (a) X = 1.791 m and
(b) Y = 0.63099 m, with an inlet air temperature of 20 °C.
(a)
(b)
Figure 7. Air velocity field in the virtual classroom with 12 occupants at the plans (a) X = 1.791 m and
(b) Y = 0.4423 m, with an inlet air temperature of 20 °C.
Figures 8–11 show the air temperature fields in the virtual classroom with 6 and 12 occupants for inlet air temperatures of 20 °C and 24 °C. In Figures 8 and 9, 6 occupants are considered, with an inlet air temperature of 20 °C and 24 °C, respectively, and in Figures 10–12 occupants are considered, with an inlet air temperature of 20 °C and 24 °C, respectively.
From the results obtained it is possible to conclude that:
• In general, the air temperature field is highest with 12 occupants and when the inlet air temperature is 24 °C (summer condition), because for 12 occupants the thermal load is highest and for summer conditions the inlet air temperature and the compartment surrounding surfaces temperatures are highest;
• The air temperature around the occupants is higher in the upper body section areas than at the lower parts, because of the convection heat from the lower body section to the upper body section. 0 0.5 1 1.5 2 2.5 3 3.5 4 4.5 X (m) 0 0.5 1 1.5 2 2.5 Z (m ) 0 0.2 0.4 0.6 0.8 1 1.2 1.4 1.6 1.8 2 2.2 2.4 2.6 2.8 3 0 0.5 1 1.5 2 2.5 Y (m) 0 0.5 1 1.5 2 2.5 Z (m ) 0 0.2 0.4 0.6 0.8 1 1.2 1.4 1.6 1.8 2 2.2 2.4 2.6 2.8 3 0 0.5 1 1.5 2 2.5 3 3.5 4 4.5 X (m) 0 0.5 1 1.5 2 2.5 Z (m) 0 0.2 0.4 0.6 0.8 1 1.2 1.4 1.6 1.8 2 2.2 2.4 2.6 2.8 3
Figure 6.Air velocity field in the virtual classroom with 6 occupants in the plans (a) X = 1.791 m and
(b) Y = 0.63099 m, with an inlet air temperature of 20◦C.
Buildings 2018, 8, x FOR PEER REVIEW 10 of 22
(b)
Figure 6. Air velocity field in the virtual classroom with 6 occupants in the plans (a) X = 1.791 m and
(b) Y = 0.63099 m, with an inlet air temperature of 20 °C.
(a)
(b)
Figure 7. Air velocity field in the virtual classroom with 12 occupants at the plans (a) X = 1.791 m and
(b) Y = 0.4423 m, with an inlet air temperature of 20 °C.
Figures 8–11 show the air temperature fields in the virtual classroom with 6 and 12 occupants for inlet air temperatures of 20 °C and 24 °C. In Figures 8 and 9, 6 occupants are considered, with an inlet air temperature of 20 °C and 24 °C, respectively, and in Figures 10–12 occupants are considered, with an inlet air temperature of 20 °C and 24 °C, respectively.
From the results obtained it is possible to conclude that:
• In general, the air temperature field is highest with 12 occupants and when the inlet air
temperature is 24 °C (summer condition), because for 12 occupants the thermal load is highest and for summer conditions the inlet air temperature and the compartment surrounding surfaces temperatures are highest;
• The air temperature around the occupants is higher in the upper body section areas than at the
lower parts, because of the convection heat from the lower body section to the upper body section. 0 0.5 1 1.5 2 2.5 3 3.5 4 4.5 X (m) 0 0.5 1 1.5 2 2.5 Z (m ) 0 0.2 0.4 0.6 0.8 1 1.2 1.4 1.6 1.8 2 2.2 2.4 2.6 2.8 3 0 0.5 1 1.5 2 2.5 Y (m) 0 0.5 1 1.5 2 2.5 Z (m ) 0 0.2 0.4 0.6 0.8 1 1.2 1.4 1.6 1.8 2 2.2 2.4 2.6 2.8 3 0 0.5 1 1.5 2 2.5 3 3.5 4 4.5 X (m) 0 0.5 1 1.5 2 2.5 Z (m) 0 0.2 0.4 0.6 0.8 1 1.2 1.4 1.6 1.8 2 2.2 2.4 2.6 2.8 3
Figure 7.Air velocity field in the virtual classroom with 12 occupants at the plans (a) X = 1.791 m and
(b) Y = 0.4423 m, with an inlet air temperature of 20◦C.
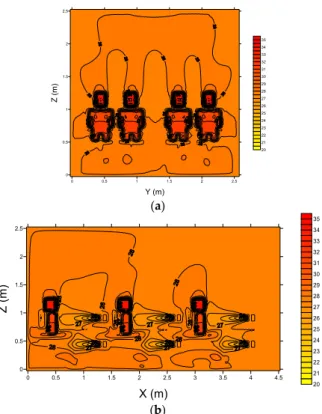
Figures8–11show the air temperature fields in the virtual classroom with 6 and 12 occupants for inlet air temperatures of 20◦C and 24◦C. In Figures8and9, 6 occupants are considered, with an inlet air temperature of 20◦C and 24◦C, respectively, and in Figures10–12occupants are considered, with an inlet air temperature of 20◦C and 24◦C, respectively.
From the results obtained it is possible to conclude that:
• In general, the air temperature field is highest with 12 occupants and when the inlet air temperature is 24◦C (summer condition), because for 12 occupants the thermal load is highest and for summer conditions the inlet air temperature and the compartment surrounding surfaces temperatures are highest;
Buildings 2018, 8, 35 11 of 22
• The air temperature around the occupants is higher in the upper body section areas than at the lower parts, because of the convection heat from the lower body section to the upper body section.
Buildings 2018, 8, x FOR PEER REVIEW 11 of 22
(a)
(b)
Figure 8. Air temperature field in the virtual classroom with 6 occupants in the plans (a) X = 1.791 m
and (b) Y = 0.63099 m, with an inlet air temperature of 20 °C.
(a)
(b)
Figure 9. Air temperature field in the virtual classroom with 6 occupants in the plans (a) X = 1.791 m
and (b) Y = 0.63099 m, with an inlet air temperature of 24 °C. 0 0.5 1 1.5 2 2.5 Y (m) 0 0.5 1 1.5 2 2.5 Z (m) 20 21 22 23 24 25 26 27 28 29 30 31 32 33 34 35 0 0.5 1 1.5 2 2.5 3 3.5 4 4.5 X (m) 0 0.5 1 1.5 2 2.5 Z (m) 20 21 22 23 24 25 26 27 28 29 30 31 32 33 34 35 0 0.5 1 1.5 2 2.5 Y (m) 0 0.5 1 1.5 2 2.5 Z (m) 20 21 22 23 24 25 26 27 28 29 30 31 32 33 34 35 0 0.5 1 1.5 2 2.5 3 3.5 4 4.5 X (m) 0 0.5 1 1.5 2 2.5 Z (m ) 20 21 22 23 24 25 26 27 28 29 30 31 32 33 34 35
Figure 8.Air temperature field in the virtual classroom with 6 occupants in the plans (a) X = 1.791 m
and (b) Y = 0.63099 m, with an inlet air temperature of 20◦C.
Buildings 2018, 8, x FOR PEER REVIEW 11 of 22
(a)
(b)
Figure 8. Air temperature field in the virtual classroom with 6 occupants in the plans (a) X = 1.791 m
and (b) Y = 0.63099 m, with an inlet air temperature of 20 °C.
(a)
(b)
Figure 9. Air temperature field in the virtual classroom with 6 occupants in the plans (a) X = 1.791 m
and (b) Y = 0.63099 m, with an inlet air temperature of 24 °C. 0 0.5 1 1.5 2 2.5 Y (m) 0 0.5 1 1.5 2 2.5 Z (m) 20 21 22 23 24 25 26 27 28 29 30 31 32 33 34 35 0 0.5 1 1.5 2 2.5 3 3.5 4 4.5 X (m) 0 0.5 1 1.5 2 2.5 Z (m) 20 21 22 23 24 25 26 27 28 29 30 31 32 33 34 35 0 0.5 1 1.5 2 2.5 Y (m) 0 0.5 1 1.5 2 2.5 Z (m) 20 21 22 23 24 25 26 27 28 29 30 31 32 33 34 35 0 0.5 1 1.5 2 2.5 3 3.5 4 4.5 X (m) 0 0.5 1 1.5 2 2.5 Z (m ) 20 21 22 23 24 25 26 27 28 29 30 31 32 33 34 35
Figure 9.Air temperature field in the virtual classroom with 6 occupants in the plans (a) X = 1.791 m
Buildings 2018, 8, 35 12 of 22
Buildings 2018, 8, x FOR PEER REVIEW 12 of 22
(a)
(b)
Figure 10. Air temperature field in the virtual classroom with 12 occupants in the plans (a) X = 1.791
m and (b) Y = 0.4423 m, with an inlet air temperature of 20 °C.
(a)
(b)
Figure 11. Air temperature field in the virtual classroom with 12 occupants in the plans (a) X = 1.791
m and (b) Y = 0.4423 m, with an inlet air temperature of 24 °C.
0 0.5 1 1.5 2 2.5 Y (m) 0 0.5 1 1.5 2 2.5 Z (m) 20 21 22 23 24 25 26 27 28 29 30 31 32 33 34 35 0 0.5 1 1.5 2 2.5 3 3.5 4 4.5 X (m) 0 0.5 1 1.5 2 2.5 Z (m) 20 21 22 23 24 25 26 27 28 29 30 31 32 33 34 35 0 0.5 1 1.5 2 2.5 Y (m) 0 0.5 1 1.5 2 2.5 Z (m) 20 21 22 23 24 25 26 27 28 29 30 31 32 33 34 35 0 0.5 1 1.5 2 2.5 3 3.5 4 4.5 X (m) 0 0.5 1 1.5 2 2.5 Z (m) 20 21 22 23 24 25 26 27 28 29 30 31 32 33 34 35
Figure 10.Air temperature field in the virtual classroom with 12 occupants in the plans (a) X = 1.791 m
and (b) Y = 0.4423 m, with an inlet air temperature of 20◦C.
Buildings 2018, 8, x FOR PEER REVIEW 12 of 22
(a)
(b)
Figure 10. Air temperature field in the virtual classroom with 12 occupants in the plans (a) X = 1.791
m and (b) Y = 0.4423 m, with an inlet air temperature of 20 °C.
(a)
(b)
Figure 11. Air temperature field in the virtual classroom with 12 occupants in the plans (a) X = 1.791
m and (b) Y = 0.4423 m, with an inlet air temperature of 24 °C. 0 0.5 1 1.5 2 2.5 Y (m) 0 0.5 1 1.5 2 2.5 Z (m) 20 21 22 23 24 25 26 27 28 29 30 31 32 33 34 35 0 0.5 1 1.5 2 2.5 3 3.5 4 4.5 X (m) 0 0.5 1 1.5 2 2.5 Z (m) 20 21 22 23 24 25 26 27 28 29 30 31 32 33 34 35 0 0.5 1 1.5 2 2.5 Y (m) 0 0.5 1 1.5 2 2.5 Z (m) 20 21 22 23 24 25 26 27 28 29 30 31 32 33 34 35 0 0.5 1 1.5 2 2.5 3 3.5 4 4.5 X (m) 0 0.5 1 1.5 2 2.5 Z (m) 20 21 22 23 24 25 26 27 28 29 30 31 32 33 34 35
Figure 11.Air temperature field in the virtual classroom with 12 occupants in the plans (a) X = 1.791 m
Buildings 2018, 8, 35 13 of 22
3.2. CO2Concentration Field
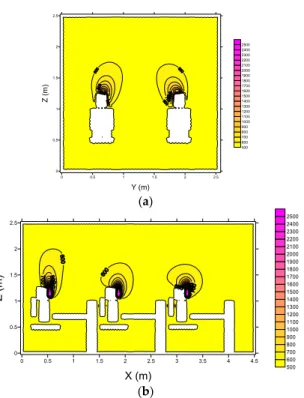
Figures12and13show the CO2concentration field in the virtual classroom, with an inlet air temperature of 20◦C when 6 and 12 occupants were present, respectively. The CO2concentration field in the virtual classroom for an inlet air temperature of 24◦C, with 6 and 12 occupants respectively, is similar to the earlier results.
From the results obtained, it is possible to conclude that:
• In general, the CO2concentration is higher with 12 occupants than with 6 occupants and the CO2 concentration in the ceiling area is higher with 12 occupants than with 6 occupants;
• The dispersion of the CO2concentration in the breathing area, is more influenced by the jet momentum when the space is occupied by 12 persons than when it is occupied by 6 persons, because with 12 occupants the air terminal devices are located in front to the occupants, while with 6 occupants the air terminal devices are located at the left and right sides of the occupants.
Buildings 2018, 8, x FOR PEER REVIEW 13 of 22
3.2. CO2 Concentration Field
Figures 12 and 13 show the CO2 concentrationfield in the virtual classroom, with an inlet air
temperature of 20 °C when 6 and 12 occupants were present, respectively. The CO2 concentration
field in the virtual classroom for an inlet air temperature of 24 °C, with 6 and 12 occupants respectively, is similar to the earlier results.
From the results obtained, it is possible to conclude that:
• In general, the CO2 concentration is higher with 12 occupants than with 6 occupants and the CO2
concentration in the ceiling area is higher with 12 occupants than with 6 occupants;
• The dispersion of the CO2 concentration in the breathing area, is more influenced by the jet
momentum when the space is occupied by 12 persons than when it is occupied by 6 persons, because with 12 occupants the air terminal devices are located in front to the occupants, while with 6 occupants the air terminal devices are located at the left and right sides of the occupants.
(a)
(b)
Figure 12. CO2 concentration field in the virtual classroom with 6 occupants in the plans (a) X = 1.791 m and (b) Y = 0.63099 m, with an inlet air temperature of 20 °C.
(a) 0 0.5 1 1.5 2 2.5 Y (m) 0 0.5 1 1.5 2 2.5 Z (m) 500 600 700 800 900 1000 1100 1200 1300 1400 1500 1600 1700 1800 1900 2000 2100 2200 2300 2400 2500 0 0.5 1 1.5 2 2.5 3 3.5 4 4.5 X (m) 0 0.5 1 1.5 2 2.5 Z (m) 500 600 700 800 900 1000 1100 1200 1300 1400 1500 1600 1700 1800 1900 2000 2100 2200 2300 2400 2500 0 0.5 1 1.5 2 2.5 Y (m) 0 0.5 1 1.5 2 2.5 Z (m) 500 600 700 800 900 1000 1100 1200 1300 1400 1500 1600 1700 1800 1900 2000 2100 2200 2300 2400 2500
Figure 12.CO2concentration field in the virtual classroom with 6 occupants in the plans (a) X = 1.791 m
and (b) Y = 0.63099 m, with an inlet air temperature of 20◦C.
Buildings 2018, 8, x FOR PEER REVIEW 13 of 22
3.2. CO2 Concentration Field
Figures 12 and 13 show the CO2 concentrationfield in the virtual classroom, with an inlet air
temperature of 20 °C when 6 and 12 occupants were present, respectively. The CO2 concentration
field in the virtual classroom for an inlet air temperature of 24 °C, with 6 and 12 occupants respectively, is similar to the earlier results.
From the results obtained, it is possible to conclude that:
• In general, the CO2 concentration is higher with 12 occupants than with 6 occupants and the CO2
concentration in the ceiling area is higher with 12 occupants than with 6 occupants;
• The dispersion of the CO2 concentration in the breathing area, is more influenced by the jet
momentum when the space is occupied by 12 persons than when it is occupied by 6 persons, because with 12 occupants the air terminal devices are located in front to the occupants, while with 6 occupants the air terminal devices are located at the left and right sides of the occupants.
(a)
(b)
Figure 12. CO2 concentration field in the virtual classroom with 6 occupants in the plans (a) X = 1.791 m and (b) Y = 0.63099 m, with an inlet air temperature of 20 °C.
(a) 0 0.5 1 1.5 2 2.5 Y (m) 0 0.5 1 1.5 2 2.5 Z (m) 500 600 700 800 900 1000 1100 1200 1300 1400 1500 1600 1700 1800 1900 2000 2100 2200 2300 2400 2500 0 0.5 1 1.5 2 2.5 3 3.5 4 4.5 X (m) 0 0.5 1 1.5 2 2.5 Z (m) 500 600 700 800 900 1000 1100 1200 1300 1400 1500 1600 1700 1800 1900 2000 2100 2200 2300 2400 2500 0 0.5 1 1.5 2 2.5 Y (m) 0 0.5 1 1.5 2 2.5 Z (m) 500 600 700 800 900 1000 1100 1200 1300 1400 1500 1600 1700 1800 1900 2000 2100 2200 2300 2400 2500 Figure 13. Cont.
Buildings 2018, 8, 35 14 of 22
Buildings 2018, 8, x FOR PEER REVIEW 14 of 22
(b)
Figure 13. CO2 concentration field in the virtual classroom with 12 occupants in the plans (a) X = 1.791
m and (b) Y = 0.4423 m, with an inlet air temperature of 20 °C.
3.3. Airflow Around the Occupants
Figures 14 and 15 show the mean air velocity values around the 25 human body sections in the virtual classroom, with 6 and 12 occupants respectively. Figures 14a and 15a show the inlet air temperature of 20 °C, while Figures 14b and 15b show shows the inlet air temperature of 24 °C.
From the results obtained, it is possible to conclude that:
• With 6 occupants the air velocity is higher around the upper body members than around the
lower members and trunk;
• With 6 occupants the body sections subjected to the highest air velocities are the shoulders, arms
and hands;
• With 12 occupants the air velocity is lower around the upper body members than around the
lower members;
• With 12 occupants the body sections subjected to the highest air velocities are the legs.
(a)
(b)
Figure 14. Mean air velocity value around the 25 human body sections of 6 occupants, for an inlet air
temperature of (a) 20 °C and (b) 24 °C.
0 0.5 1 1.5 2 2.5 3 3.5 4 4.5 X (m) 0 0.5 1 1.5 2 2.5 Z (m ) 500 600 700 800 900 1000 1100 1200 1300 1400 1500 1600 1700 1800 1900 2000 2100 2200 2300 2400 2500
Figure 13.CO2concentration field in the virtual classroom with 12 occupants in the plans (a) X = 1.791
m and (b) Y = 0.4423 m, with an inlet air temperature of 20◦C.
3.3. Airflow Around the Occupants
Figures14and15show the mean air velocity values around the 25 human body sections in the virtual classroom, with 6 and 12 occupants respectively. Figures14a and15a show the inlet air temperature of 20◦C, while Figures14b and15b show shows the inlet air temperature of 24◦C.
From the results obtained, it is possible to conclude that:
• With 6 occupants the air velocity is higher around the upper body members than around the lower members and trunk;
• With 6 occupants the body sections subjected to the highest air velocities are the shoulders, arms and hands;
• With 12 occupants the air velocity is lower around the upper body members than around the lower members;
• With 12 occupants the body sections subjected to the highest air velocities are the legs.
Buildings 2018, 8, x FOR PEER REVIEW 14 of 22
(b)
Figure 13. CO2 concentration field in the virtual classroom with 12 occupants in the plans (a) X = 1.791
m and (b) Y = 0.4423 m, with an inlet air temperature of 20 °C. 3.3. Airflow Around the Occupants
Figures 14 and 15 show the mean air velocity values around the 25 human body sections in the virtual classroom, with 6 and 12 occupants respectively. Figures 14a and 15a show the inlet air temperature of 20 °C, while Figures 14b and 15b show shows the inlet air temperature of 24 °C.
From the results obtained, it is possible to conclude that:
• With 6 occupants the air velocity is higher around the upper body members than around the lower members and trunk;
• With 6 occupants the body sections subjected to the highest air velocities are the shoulders, arms and hands;
• With 12 occupants the air velocity is lower around the upper body members than around the lower members;
• With 12 occupants the body sections subjected to the highest air velocities are the legs.
(a)
(b)
Figure 14. Mean air velocity value around the 25 human body sections of 6 occupants, for an inlet air
temperature of (a) 20 °C and (b) 24 °C.
0 0.5 1 1.5 2 2.5 3 3.5 4 4.5 X (m) 0 0.5 1 1.5 2 2.5 Z (m ) 500 600 700 800 900 1000 1100 1200 1300 1400 1500 1600 1700 1800 1900 2000 2100 2200 2300 2400 2500
Figure 14.Mean air velocity value around the 25 human body sections of 6 occupants, for an inlet air
Buildings 2018, 8, 35 15 of 22
Buildings 2018, 8, x FOR PEER REVIEW 15 of 22
(a)
(b)
Figure 15. Mean air velocity value around the 25 human body sections of 12 occupants, for an inlet
air temperature of (a) 20 °C and (b) 24 °C.
Figures 16 and 17 show the mean air temperature values around the 25 human body sections in the virtual classroom, with 6 and 12 occupants, respectively. Figures 16a and 17a are associated with the inlet air temperature of 20 °C, while Figures 16b and 17b are associated with the inlet air temperature of 24 °C.
(a)
(b)
Figure 16. Mean air temperature value around the 25 human body sections of 6 occupants, for an inlet
air temperature of (a) 20 °C and (b) 24 °C.
Figure 15.Mean air velocity value around the 25 human body sections of 12 occupants, for an inlet air
temperature of (a) 20◦C and (b) 24◦C.
Figures16and17show the mean air temperature values around the 25 human body sections in the virtual classroom, with 6 and 12 occupants, respectively. Figures16a and17a are associated with the inlet air temperature of 20◦C, while Figures16b and17b are associated with the inlet air temperature of 24◦C.
Buildings 2018, 8, x FOR PEER REVIEW 15 of 22
(a)
(b)
Figure 15. Mean air velocity value around the 25 human body sections of 12 occupants, for an inlet
air temperature of (a) 20 °C and (b) 24 °C.
Figures 16 and 17 show the mean air temperature values around the 25 human body sections in the virtual classroom, with 6 and 12 occupants, respectively. Figures 16a and 17a are associated with the inlet air temperature of 20 °C, while Figures 16b and 17b are associated with the inlet air temperature of 24 °C.
(a)
(b)
Figure 16. Mean air temperature value around the 25 human body sections of 6 occupants, for an inlet
air temperature of (a) 20 °C and (b) 24 °C.
Figure 16.Mean air temperature value around the 25 human body sections of 6 occupants, for an inlet
air temperature of (a) 20◦C and (b) 24◦C.
Buildings 2018, 8, 35 16 of 22
• The air temperature distribution around the occupants present are, in general, uniform, however, it is at slightly higher levels around the upper body sections than around the lower body sections:
• The air temperature around the body sections is higher with 12 occupants than with 6 occupants.
Buildings 2018, 8, x FOR PEER REVIEW 16 of 22
From the results obtained it is possible to conclude that:
• The air temperature distribution around the occupants present are, in general, uniform,
however, it is at slightly higher levels around the upper body sections than around the lower body sections:
• The air temperature around the body sections is higher with 12 occupants than with 6 occupants.
(b)
(c)
Figure 17. Mean air temperature value around the 25 human body sections of 12 occupants, for an
inlet air temperature of (a) 20 °C and (b) 24 °C.
3.4. DR Level
Figures 18 and 19 show the DR mean values, based in ISO 7730, around the 25 human body sections in the virtual classroom, with 6 and 12 occupants, respectively, [17]. Figures 18a and 19a are associated with the inlet air temperature of 20 °C, while Figures 18b and 19b are associated with the inlet air temperature of 24 °C.
From the results obtained, it is possible to conclude that:
• The DR is higher when 6 occupants are present than when 12 occupants are present;
• The DR is higher for an inlet air temperature of 20 °C than for an inlet air temperature of 24 °C;
• When 6 occupants are considered, the shoulders and legs are subjected to highest DR values
than other body segments;
• When 12 occupants are considered, the legs are subjected to the highest DR values than other
body segments;
• When an inlet air temperature of 24 °C is considered the DR level is acceptable in accordance
with the Category C of ISO 7730 [17].
Figure 17.Mean air temperature value around the 25 human body sections of 12 occupants, for an inlet
air temperature of (a) 20◦C and (b) 24◦C.
3.4. DR Level
Figures18and19show the DR mean values, based in ISO 7730, around the 25 human body sections in the virtual classroom, with 6 and 12 occupants, respectively, [17]. Figures18a and19a are associated with the inlet air temperature of 20◦C, while Figures18b and19b are associated with the inlet air temperature of 24◦C.
From the results obtained, it is possible to conclude that:
• The DR is higher when 6 occupants are present than when 12 occupants are present;
• The DR is higher for an inlet air temperature of 20◦C than for an inlet air temperature of 24◦C;
• When 6 occupants are considered, the shoulders and legs are subjected to highest DR values than other body segments;
• When 12 occupants are considered, the legs are subjected to the highest DR values than other body segments;
• When an inlet air temperature of 24◦C is considered the DR level is acceptable in accordance with the Category C of ISO 7730 [17].
Buildings 2018, 8, 35 17 of 22
Buildings 2018, 8, x FOR PEER REVIEW 17 of 22
(a)
(b)
Figure 18. Mean draught risk (DR) value around the 25 human body sections of 6 occupants, for an
inlet air temperature of (a) 20 °C and (b) 24 °C.
(a)
(b)
Figure 19. Mean DR value around the 25 human body sections of 12 occupants, for an inlet air
temperature of (a) 20 °C and (b) 24 °C.
0 10 20 30 40 50 60 70 80 90 100 DR ( % ) Body section O5 O6 O3 O4 O1 O2 Category C Category B Category A 0 10 20 30 40 50 60 70 80 90 100 DR ( % ) Body section O5 O6 O3 O4 O1 O2 Category C Category B Category A 0 10 20 30 40 50 DR ( % ) Body section
O9 O10 O11 O12 O5 O6 O7 O8 O1 O2 O3 O4 O9 O10 O11 O12
Category C Category B Category A 0 10 20 30 40 50 DR ( % ) Body section
O9 O10 O11 O12 O5 O6 O7 O8 O1 O2 O3 O4
Category C
Category B
Category A
Figure 18.Mean draught risk (DR) value around the 25 human body sections of 6 occupants, for an
inlet air temperature of (a) 20◦C and (b) 24◦C.
Buildings 2018, 8, x FOR PEER REVIEW 17 of 22
(a)
(b)
Figure 18. Mean draught risk (DR) value around the 25 human body sections of 6 occupants, for an
inlet air temperature of (a) 20 °C and (b) 24 °C.
(a)
(b)
Figure 19. Mean DR value around the 25 human body sections of 12 occupants, for an inlet air
temperature of (a) 20 °C and (b) 24 °C.
0 10 20 30 40 50 60 70 80 90 100 DR ( % ) Body section O5 O6 O3 O4 O1 O2 Category C Category B Category A 0 10 20 30 40 50 60 70 80 90 100 DR ( % ) Body section O5 O6 O3 O4 O1 O2 Category C Category B Category A 0 10 20 30 40 50 DR ( % ) Body section
O9 O10 O11 O12 O5 O6 O7 O8 O1 O2 O3 O4 O9 O10 O11 O12
Category C Category B Category A 0 10 20 30 40 50 DR ( % ) Body section
O9 O10 O11 O12 O5 O6 O7 O8 O1 O2 O3 O4
Category C
Category B
Category A
Figure 19. Mean DR value around the 25 human body sections of 12 occupants, for an inlet air
temperature of (a) 20◦C and (b) 24◦C.
3.5. ADI
Tables 2 and3 present the ADI results when 6 occupants are considered, with an inlet air temperature of 20◦C and 24◦C, respectively. The tables include the effectiveness for heat removal,
Buildings 2018, 8, 35 18 of 22
the PPD, the thermal comfort number, the CO2concentration in the breathing area, the effectiveness for contaminant removal, the PD for IAQ, the air quality number and the ADI.
Table 2.Air distribution index (ADI) for an occupation of 6 persons with an inlet air temperature of
20◦C.
Occupants 1 2 3 4 5 6 Mean Value
Effectiveness for Heat Removal (%) 51.5 51.4 50.6 50.6 53.2 53.5 51.4
PPD (%) 12.4 11.8 10.3 10.0 12.5 12.9 12.1
Thermal Comfort Number 4.1 4.4 4.9 5.0 4.3 4.2 4.3
CO2in the Breathing Area (mg/m3) 1197.4 1188.4 1267.0 1215.1 1137.0 1080.3 1192.9
Effectiveness for Contaminant Removal (%) 7.5 7.6 6.9 7.4 8.3 9.1 7.6
PD for IAQ (%) 5.5 5.5 5.5 5.5 5.5 5.5 5.5
Air Quality Number 1.4 1.4 1.3 1.3 1.5 1.7 1.4
ADI 2.4 2.5 2.5 2.6 2.5 2.6 2.5
Table 3.ADI for an occupation of 6 persons with an inlet air temperature of 24◦C.
Occupants 1 2 3 4 5 6 Mean Value
Effectiveness for Heat Removal (%) 68.8 68.7 66.8 67.1 67.4 68.0 67.7
PPD (%) 8.0 8.2 8.9 9.0 8.5 8.3 8.4
Thermal Comfort Number 8.6 8.3 7.5 7.4 8.0 8.2 8.1
CO2in the Breathing Area (mg/m3) 1207.7 1196.9 1311.0 1249.8 1117.8 1075.6 1202.3
Effectiveness for Contaminant Removal (%) 8.8 8.9 7.7 8.3 10.1 10.8 8.9
PD for IAQ (%) 5.5 5.5 5.5 5.5 5.5 5.5 5.5
Air Quality Number 1.6 1.6 1.4 1.5 1.8 2.0 1.6
ADI 3.7 3.7 3.2 3.4 3.8 4.0 3.7
From the results presented in Tables2and3, it is possible to conclude that:
• The effectiveness for heat removal is slightly lower for an inlet air temperature of 20◦C than for an inlet air temperature of 24◦C.
• The PPD value is acceptable, according to the category C of the ISO 7730, for an inlet air temperature of 20 ◦C and is acceptable according to category B of this standard for an inlet air temperature of 24◦C, [17].
• The thermal comfort number is higher for an inlet air temperature of 24◦C than for an inlet air temperature of 20◦C.
• The CO2concentration, the PD for the IAQ and the air quality number represent nearly the same values for an inlet air temperature of 24 ◦C as that for an inlet air of 20 ◦C; however, the effectiveness for contaminant removal is slightly lower for an inlet air temperature of 20◦C than for an inlet air temperature of 24◦C.
• The ADI number is lower for an inlet air of 20◦C than for an inlet air temperature of 24◦C.
Tables4 and5present the ADI results when 12 occupants are considered, with an inlet air temperature of 20◦C and 24◦C, respectively. The tables include the effectiveness for heat removal, the PPD, the thermal comfort number, the CO2concentration in the breathing area, the effectiveness for contaminant removal, the PD for IAQ, the air quality number and the ADI.
Buildings 2018, 8, 35 19 of 22
Table 4.ADI for an occupation of 12 persons, with an inlet air temperature of 20◦C.
Occupants 1 2 3 4 5 6 7 8 9 10 11 12 Mean Value
Effectiveness for Heat Removal (%) 88.9 84.9 88.1 85.8 90.3 87.5 85.4 88.7 86.1 88.9 88.1 89.8 87.7
PPD (%) 5.0 6.0 5.2 5.5 5.1 5.7 6.0 5.5 5.3 5.4 5.4 5.2 5.4
Thermal Comfort Number 17.7 14.2 16.8 15.6 17.7 15.4 14.3 16.0 16.2 16.4 16.4 17.1 16.2
CO2in the Breathing Area (mg/m3) 997.2 1140.8 1038.4 1162.0 1123.5 1205.5 1071.3 1157.3 1083.0 1141.2 1133.0 1145.7 1116.6
Effectiveness for Contaminant Removal (%) 34.4 26.7 31.8 25.9 27.5 24.3 30.0 26.1 29.4 26.7 27.1 26.5 28.0
PD for IAQ (%) 10.8 10.8 10.8 10.8 10.8 10.8 10.8 10.8 10.8 10.8 10.8 10.8 10.8
Air Quality Number 3.2 2.5 3.0 2.4 2.5 2.3 2.8 2.4 2.7 2.5 2.5 2.5 2.6
ADI 7.5 5.9 7.0 6.1 6.7 5.9 6.3 6.2 6.6 6.4 6.4 6.5 6.5
Table 5.ADI for an occupation of 12 persons, with an inlet air temperature of 24◦C.
Occupants 1 2 3 4 5 6 7 8 9 10 11 12 Mean Value
Effectiveness for Heat Removal (%) 92.0 88.9 91.2 89.5 93.2 91.2 89.3 91.8 89.8 91.8 91.6 92.8 91.1
PPD (%) 15.1 18.5 16.4 17.3 15.8 17.8 18.5 17.5 16.7 17.1 16.9 16.5 17.0
Thermal Comfort Number 6.1 4.8 5.6 5.2 5.9 5.1 4.8 5.3 5.4 5.4 5.4 5.6 5.4
CO2in the Breathing Area (mg/m3) 998.5 1142.6 1040.4 1164.7 1127.2 1209.2 1072.8 1158.1 1085.3 1142.1 1136.5 1148.7 1118.8
Effectiveness for Contaminant Removal (%) 34.9 27.0 32.2 26.1 27.7 24.5 30.3 26.4 29.7 27.1 27.3 26.8 28.3
PD for IAQ (%) 10.8 10.8 10.8 10.8 10.8 10.8 10.8 10.8 10.8 10.8 10.8 10.8 10.8
Air Quality Number 3.2 2.5 3.0 2.4 2.6 2.3 2.8 2.5 2.8 2.5 2.5 2.5 2.6
Buildings 2018, 8, 35 20 of 22
From the results given in Tables4and5, it is possible to conclude that:
• The effectiveness for heat removal is slightly lower for an inlet air temperature of 20◦C than for an inlet air temperature of 24◦C.
• The PPD value is acceptable for an inlet air temperature of 20◦C, according to category B of the ISO 7730, and is not acceptable for an inlet air temperature of 24◦C, [17]. However, the TC levels are near acceptable conditions.
• The thermal comfort number is lower for an inlet air temperature of 24◦C than for an inlet air temperature of 20◦C.
• The CO2concentration, the effectiveness for contaminant removal, the PD for the IAQ and the air quality number present similar values for an inlet air temperature of 24◦C as those for an inlet air of 20◦C. Thus, the inlet air temperatures do not appear to influence the IAQ that the occupants are subjected to.
• The ADI number is higher for an inlet air of 20◦C than for an inlet air temperature of 24◦C.
4. Conclusions
In this study one virtual school classroom, with 6 and 12 virtual occupants, is used to evaluate the TC level, effectiveness for heat removal, thermal comfort number, IAQ level, effectiveness for contaminant removal, air quality number, ADI and DR level associated to a PVS. The virtual classroom consists of 6 virtual desks, equipped with a PVS, with upper and lower air terminal devices. A coupling of a HTC numerical model with a CFD numerical model using the RNG turbulence model, lead to the generation of the ADI index which is used for comparing ventilation system performance.
From the results obtained it is concluded that the effectiveness for heat removal is lower for a classroom of 6 persons than for a classroom of 12 persons. The PPD value is acceptable for 6 persons in a classroom, however for 12 persons in a classroom, the PPD value is acceptable for an inlet air temperature of 20◦C and is unacceptable for an inlet air temperature of 24◦C. The thermal comfort number is lower for a classroom of 6 persons than for a classroom of 12 persons.
The CO2concentration in the breathing area is not strongly influenced by the number of occupants nor the inlet air temperature. This finding is due to the inlet air terminal devices for 12 persons located in front of the occupants, while the for 6 persons these are located at the left and right side of the occupants. The effectiveness for contaminant removal, the PD for IAQ and the air quality number are higher for 12 persons than for 6 persons in a classroom.
The ADI, in general, is higher for 12 persons than for 6 persons in the classroom and is higher for an inlet air temperature of 20◦C than for an inlet air temperature of 24◦C.
Thus, according to the ADI values obtained, one upper and one lower air terminal devices located in front of the body area produced better values than those for one upper and one lower air terminal devices located to the left side of the body and one upper and one lower air terminal devices located on the right side body.
Based on the results obtained, for future work, more combinations of upper and lower air terminal devices located around the body area and more combinations of a number of occupants at the desk will be analyzed.
Acknowledgments:The authors grateful the 2017–2018 ASHRAE Undergraduate Senior Project Grant Program.
Author Contributions:All authors contributed equally in the preparation of this manuscript.
Conflicts of Interest:The authors declare no conflict of interest.
References
1. Yang, B.; Sekhar, C.; Melikov, A.K. Ceiling mounted personalized ventilation system in hot and humid climate—An energy analysis. Energy Build. 2010, 42, 2304–2308. [CrossRef]