FORMULATION OF FEEDS FOR Octopus vulgaris
SUB-ADULTS IN LAND-BASED CONDITIONS
Tania Rodríguez González
Dissertation to obtain the degree in
Masters in Aquaculture and Fisheries
Speciality in Aquaculture
Thesis coordinated by:
António de Vilhena Andrade Ferreira Sykes, PhD
Jesús Cerezo Valverde, PhD
FORMULATION OF FEEDS FOR Octopus vulgaris
SUB-ADULTS IN LAND-BASED CONDITIONS
Tania Rodríguez González
Dissertation to obtain the degree in
Masters in Aquaculture and Fisheries
Speciality in Aquaculture
Thesis coordinated by:
António de Vilhena Andrade Ferreira Sykes, PhD
Jesús Cerezo Valverde, PhD
LAND-BASED CONDITIONS
“Declaração de autoria do trabalho”
“Declaro ser o autor deste trabalho, que é original e inédito. Autores e trabalhos
consultados estão devidamente citados no texto e constam da listagem de referência
incluída”
“Copyright”
“A Universidade do Algarve tem o direito, perpétuo e sem limites geográficos, de
arquivar e publicar este trabalho através de exemplares impressos reproduzidos em papel ou de forma digital, ou por qualquer outro meio conhecido ou que venha a ser inventado, de o divulgar através de repositórios científicos e de adquirir a sua cópia e distribuição com objectivos educacionais ou de investigação, não comerciais, desde que
seja dado crédito ao autor e editor.”
____________________________________
“El futuro tiene muchos nombres. Para los débiles es lo inalcanzable. Para los temerosos, lo desconocido. Para los valientes es la oportunidad”
(V.M. Hugo)
La oportunidad…
Estas líneas van dirigidas a todos aquellos que me han dado “la oportunidad” y me han ayudado, de una forma u otra, a realizar este trabajo:
- En primer lugar, al Dr. António de Vilhena Andrade Ferreira Sykes, coordinador interno de esta tesis, por su ayuda constante desde que entré en su despacho por primera vez. Mil gracias por la paciencia, la orientación, el interés y el seguimiento de mi trabajo a lo largo de estos meses.
- Al Dr. Jesús Cerezo Valverde, coordinador externo de esta tesis, por hacer posible mi incorporación en su equipo; por enseñarme a hacer frente a la parte experimental y
analítica de este trabajo; así como por su orientación cuando “estaba más perdida que un pulpo en un garaje”.
- Al Dr. Benjamín García García, director del IMIDA, por permitir mi incorporación
temporal en el centro y dedicarme diariamente un “hola amiga” acompañado de una
sonrisa.
- A los que fueron mis compañeros durante mi estancia en el IMIDA. Irene, Ángel P. y Ángel gracias por amenizarme las mañanas y hacer escandalosamente divertidas las rutinas diarias. Piedad, Ángel H. y Mar gracias por ayudarme a sobrellevar la saturación mental que por momentos se apoderaba de mí. Mari Carmen y Cristino gracias por guiarme por el laboratorio. Pepe gracias por tu tranquilidad y serenidad todos y cada uno de los días.
- A mis padres y mi tía por creer en mis objetivos. En especial a mi madre por su dedicación, apoyo y confianza incondicional.
Universidad de Vigo por haber compartido conmigo los primeros años, especialmente a Manoli. A los de la Universidad de Baja California: en especial a
Mundo, Vincent y Roberto por haberme metido “el gusano” de la acuicultura en el
cuerpo. A mis compañeros del Máster: Luis, Calisto, Tânia, Dani y Mârcia por estos dos últimos años de convivencia y vivencias, dentro y fuera de la Universidad. Y en
especial a Elena y a mis “meninas portuguesas” por darme ánimos, sufrir conmigo e
intentar sacarme una sonrisa de desahogo en todo momento.
- Y ya para terminar, le dedico este trabajo a mis Gordos. A Breogán, mi novio; al que debo agradecerle su comprensión, su apoyo, su cariño y su saber esperar todos estos años solo para verme feliz cumpliendo mis objetivos. Y como no, a Foski, mi gato y fiel compañero, por la infinidad de horas que ha pasado encima de mí mientras escribía este texto.
A todos, muchas gracias por acompañarme en el camino.
_______________________________________
This thesis was funded by:
- "Aplicación de los nuevos avances en nutrición, desarrollo de piensos y diseño de instalaciones al engorde de pulpo (Octopus vulgaris) en tierra y mar abierto." Nº Project: RTA2012-00072-00-00. Entity: Instituto Murciano de Investigación y Desarrollo Agrario y Alimentario.
- SEPIATECH – Development of cuttlefish, Sepia officinalis, aquaculture production technology - feed and husbandry refinements. DGPA – PROMAR. 31.03.05.FEP.002
- SEPIABREED - Improving the reproduction of the European cuttlefish, Sepia
officinalis (Linnaeus, 1758) in captivity: a multidisciplinary approach
A aquacultura mediterrânica necessita diversificação e o polvo comum, Octopus vulgaris, é visto como uma alternativa viável e interessante devido ao seu valor de mercado e de consumo elevado não só nesta região mas também na Ásia e Oceânia. Além disso, possui um ciclo de vida curto (12-18 meses); crescimento rápido com taxas que rondam cerca de 5% do seu peso por dia bem como cerca de 13% de incremento de peso por dia em juvenis; elevadas taxas de conversão nas quais se verificam incorporações do alimento ingerido em peso na ordem dos 30-60%; fecundidade elevada (100.000-500.000 ovos por fêmea); elevado conteúdo proteico (70-90% do seu peso seco); boa adaptação a condições de cativeiro; boa aceitação de alimentos inertes; e resistência a manuseamento e transporte.
O polvo é já produzido em Espanha (principalmente na Galiza) desde a década de 1990, através de engorda de juvenis capturados na natureza. No entanto o cultivo completo da espécie enfrenta ainda alguns problemas que impedem um concretizar efectivo deste potencial, dos quais a existência de uma dieta inerte que diminua a logística e os custos de operação que viabilize deste modo o seu cultivo industrial. Parte deste problema deve-se a um conhecimento restrito da fisiologia do polvo e de outros cefalópodes bem como à capacidade cognitiva do próprio animal. Apesar de se terem realizados vários ensaios experimentais no sentido de resolver esta questão desde a década de 1990, não existe ao momento uma dieta para qualquer cefalópode que seja aceite e permita crescimentos pelo menos de cerca de metade do verificado com alimento natural. Nos últimos anos, tem sido feito um esforço adicional no sentido de desenvolver esta dieta, utilizando-se para tal espécies de peixe resultantes de rejeição de pesca e de aquacultura como matéria-prima. Um exemplo é a boga, Boops boops, que surgiu como dieta alternativa utilizada para engordar o polvo. No entanto, a utilização desta e outras matérias-primas numa preparação tradicional de formulação das dietas, que inclui processamento térmico de cozimento, parece influir com a aceitação e crescimento do polvo devido à desnaturação proteica que ocorre nesse processo. Para mitigar este problema, foram recentemente testadas dietas que foram liofilizadas. No entanto, o processo de liofilização implica logística e custos associados que são elevados para serem implementados num futuro processo de preparação de dietas para polvo e, eventualmente, outros cefalópodes. Nesse sentido, o objectivo desta tese foi testar o uso de duas dietas semi-húmidas, que possuem como base farinhas liofilizadas de lula e caranguejo, testando a variável processamento térmico na preparação de farinha de boga
realizar um protocolo de alimentação semanal que inclua dias não consecutivos sem alimentação (2 vs. 3) com a dieta FDb.
Na experiência 1, testou-se o efeito do uso de boga liofilizada (FDb) ou boga desidratada a menos de 60ºC (Mb), através da inclusão de uma ou outra na preparação de uma dieta semi-húmida. Além de um destes, esta dieta semi-húmida incluía as seguintes matérias-primas: lula (Todarodes sagittatus) e caranguejo (Carcinus mediterranus) liofilizados; óleo de peixe, glucose, gema de ovo, e gelatina e amido como ligantes. Foi verificado o crescimento, eficiência da dieta, digestibilidade e condição. Ambas as dietas tiveram valores similares de composição proximal e de desagregação (P>0.05); sendo que apenas foram marginalmente diferentes em termos de conteúdo proteico (66.14±0.01% e 69.98±0.31% para FDb e Mb, respectivamente) e de cinza (5.77±0.02% e 6.20±0.04% para FDb e Mb, respectivamente). Os polvos aceitaram ambas as dietas, produziram fezes e nenhuma mortalidade foi registada. O crescimento específico (SGR) foi semelhante em ambos os grupos (0.78±0.19 e 0.85±0.09 %BWday-1 para FDb e Mb, respectivamente) bem como a eficiência da dieta (48.31±9.70% e 39.22±2.92% para FDb e Mb, respectivamente). Não foram também encontradas diferenças relativamente aos valores de rácio de conversão da dieta (FCR) e valores produtivos de proteína (PPV) e de lípido (LPV). No entanto, foram verificados diferenças significativas (P<0.05) ao nível da taxa absoluta e específica de ingestão (AFR e SFR) e no índice da glândula digestiva (DGI). Nomeadamente, foram verificadas AFRs e SFRs superiores bem como uma DGI superior no grupo Mb. A composição proximal das fezes também apresentou diferenças ao nível do conteúdo de proteína, lípido e mineral (P<0.05), que se reflectiram em diferenças verificadas ao nível do coeficiente aparente de digestibilidade (ADC) dos diversos nutrientes. No entanto, não se verificaram qualquer tipo de diferenças na composição proximal dos tecidos estudados (musculo, glândula digestiva e do animal inteiro). Os resultados desta experiência revelam que não existe perda de qualidade da proteína quando se faz desidratação a valores de temperatura inferiores a 60ºC, já que os resultados obtidos foram na generalidade idênticos. No entanto, o processamento térmico que não inclui liofilização poderá eventualmente provocar oxidação lipídica o que poderá explicar as poucas diferenças observadas.
distintos: o primeiro (2FDb) incluía dois dias não contínuos em que não se alimentavam os polvos e o segundo 3 dias não contínuos (3FDb). Ambos os protocolos incluíam alimentação com a dieta FDb da experiência anterior. Tanto a ingestão semanal como o crescimento foram similares entre os grupos (P>0.05), apresentando valores médios de SGR inferiores a 1%. Verificaram-se diferenças na eficiência da dieta (FE), sendo a FE e o PPV superiores no grupo 3FDb. No entanto, a digestibilidade da dieta e a composição proximal das fezes e dos tecidos analisados registaram valores idênticos em ambos grupos. Estes resultados sugerem que a inclusão de 3 dias não consecutivos de jejum no protocolo de alimentação poderá ser uma opção interessante no cultivo industrial do polvo já que os valores de eficiência da dieta (FE) foram superiores e de conversão (FCR) estiveram próximos de ser estatisticamente inferiores no grupo 3FDb. Além disso, os resultados parecem apontar para a eventual capacidade da espécie em compensar os dias de jejum através de um incremento na ingestão no dia subsequente. Este protocolo poderá assim promover um uso de menor quantidade de comida e dos custos de alimentação associados.
Palavras-chave: Octopus vulgaris; Crescimento; Dietas semi-húmidas; Digestibilidade; Eficiência de dieta; Jejum de curta duração.
In the present study growth, feed efficiency, digestibility and condition of O. vulgaris fed two different diets (FDb and Mb); and the effects of two (2FDb) or three starvation days (3FDb) per week feeding with FDb diet were analyzed. The diets were formulated using freeze-dried ingredients and only differed on bogue preparation; freeze-dried (diet FDb) or meal prepared under 60˚C (Mb). Both diets were accepted, promoted growth and faeces production with 100% of survival. No significant differences were found in growth (SGR of 0.78±0.19 %BWday-1 for FDb and 0.85±0.09 %BWday-1 for Mb) and feed efficiency (48.31±9.70% and 39.22±2.92% for FDb and Mb, respectively) or PPV and LPV. Despite the similarity on FCR (P>0.05), a better mean value was obtained by FDb (2.15±0.47) compared to Mb (2.56±0.19). However, statistical differences were identified on ingestion and DGI. In this sense, a higher ingestion were found on Mb group regarding to AFR (P<0.01), APFR and ALFR (P<0.01) and SFR (P<0.05). The animals of Mb showed the highest DGI (6.75±1.00 %). Faeces proximate composition differed between groups in protein (P<0.05), lipid (P<0.05) and mineral content (P<0.01), which were reflected on differences on ADC of nutrients (P<0.01). Nonetheless, the proximate composition of tissues were similar between both groups (P>0.05). Growth and ingestion did not differ with starvation protocols (P>0.05). FE displayed differences (P>0.05); the better FE and PPV were performed by 3FDb (58.65±6.47% and 23.90±2.61%, respectively). Digestibility and proximate composition of faeces and tissues were also similar (P>0.05). The results revealed no loss on diet quality when dehydration is performed under 60˚C which point out the suitability of bogue-meal for O. vulgaris feeds. It seems that growth and, survival and proximate composition were not influenced by the applied starvation/feeding protocols. It also seems that O. vulgaris has the ability to compensate starvation through an increase in food intake on the subsequent day. The application of feeding protocols that include starvation days might be an interesting option for industrial application since FE and FCR were enhanced. This will promote a reduction in operational costs, such in manpower and food.
Keywords: Octopus vulgaris; Semi-moist diets; Growth; Feed efficiency; Digestibility; Short-term Starvation.
Title ……….….i
Authorship declaration ……….ii
Acknowledgments ……… iii
Resumo ………v
Abstract …..……….viii
General Index ………ix
Index of figures ……….xi
Index of tables ………..xv
Abbreviations ……….xvii
1. Introduction ………. 1
1.1. Current status of world aquaculture ………..1
1.2. Aquaculture in Spain ………7
1.3. Cephalopods Production ……….10
1.4. Cephalopods aquaculture ………13
1.5. Octopus vulgaris as a Potential Species in Spain ………...17
1.6. O. vulgaris aquaculture research ………21
1.6.1. Reproduction and paralarvae rearing ………..21
1.6.2. On-growing status and origin ………..27
1.6.3. Feeding and digestion ……….29
1.6.4. Diet development for octopus on-growing ……….31
1.6.4.1.Nutritional requirements ………31
1.6.4.2.On-growing diets for the common octopus ………...34
1.7. Objectives ………...38
2.3. Preparation, conservation and water stability of the diets ………..43
2.4. Experimental design ………...46
2.4.1. Experiment 1 ………...48
2.4.2. Experiment 2 ………...48
2.5. Sample collection and preservation ………49
2.6. Biochemical determinations ………...52 2.7. Determination of variables ……….55 2.7.1. Growth ………55 2.7.2. Ingestion ………..55 2.7.3. Feed efficiency ………56 2.8. Statistical Analysis ………..57 3. Results ……….58
3.1.Water stability and macronutrient composition of the diets ………58
3.2.Experiment 1 ………58 3.3. Experiment 2 ………...64 4. Discussion ………...72 4.1. Experiment 1 ………...72 4.2. Experiment 2 ………...82 5. References ………...85
Introduction
Figure 1.1.1. World Fisheries and Aquaculture Production Statistics (FAO, 2004; 2009 ;
2012) ………..1
Figure 1.1.2. Global aquaculture volume production (FAO, 2012) ……….3
Figure 1.1.3. European Union imports, exports and related values (Administration, 2013) ………..5
Figure 1.1.4. European Union main import countries, and related value: United Kingdom (UK), Poland (POL), Spain (SPA), France (FRA) and Netherlands (NET); (Administration, 2013) ………..6
Figure 1.1.5. European Union main export countries, and related value: Germany (GER), Netherlands (NET), France (FRA), Denmark (DEN), Spain (SPA) and United Kingdom (UK); (Administration, 2013). ………...7
Figure 1.2.1. Number of produced species by culture environment in Spain (2011) (MAGRAMA, 2013) ……….8
Figure 1.2.2. Main aquaculture species in Spain in 2011; data is only referred to the on-growing phase (MAGRAMA, 2013) ……….9
Figure 1.2.3. Spanish aquaculture: tonnage (a.) and value (b.) in 2011 (MAGRAMA, 2013) ………..9
Figure 1.3.1. Cephalopods consumption by continent (FAO, 2013b) ………12
Figure 1.3.2. Main cephalopod consumer countries (FAO, 2013b) ………...13
Figure 1.4.1. Octopus maya [adapted from GrupoGarzaLimón (2012)] ………15
Figure 1.4.2. Octopus mimus [adapted from RadioPaladar (2011)] ………...16
Figure 1.4.3. Octopus vulgaris [adapted from Biopix (2013)] ………...16
Figure 1.5.1. Global production (including fisheries and aquaculture volumes), global aquaculture production, Octopus global production, European and Spanish fisheries production, and Spanish aquaculture volumes for Octopus vulgaris (FAO, 2010-2013)……….18
Figure 1.5.2. O. vulgaris aquaculture production in five concessions located in Galicia, Spain. [adapted from Conselheria-do-Medio-Rural-e-do-Mar (2009)] ………...20
glands; b- beak; bh- branquial hearts; bm- buccal area; br- branchial arcs; cae- caecum; cr- crop; dg- digestive gland; e- esophagus; i- intestine; is- ink sac; k- kidney;
Ns-Needham’s sac; psg- posterior salivary glands; s- siphon; sh- systemic heart;
sp-spermatophores; sto- stomach and tes- testicles. ……….22
Figure 1.6.1.2. Octopus vulgaris mating [adapted from Dirscheri (2013)] ………23 Figure 1.6.1.3. Hectocotylus. a. Octopus arm, b. duct, c. hectocotylus. ………23 Figure 1.6.1.4. Octopus vulgaris egg cluster [adapted from Castelló (2013)]. ………..24 Figure 1.6.1.5. Octopus vulgaris paralarvae. a. paralarvae at rearing tank, b. paralarvae (Cerezo-Valverde, personal photos). ………...25
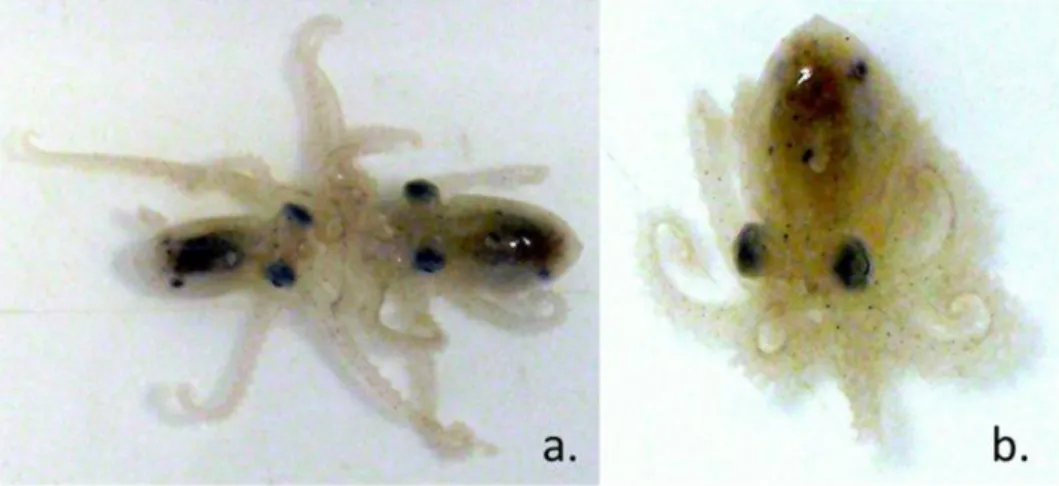
Figure 1.6.1.6. Octopus vulgaris juveniles. a. Two juveniles fighting, b. common octopus juvenile (Cerezo-Valverde, personal photos). ………25
Materials and methods
Figure 2.1.1. Aerial view of Estación de Acuicultura del Instituto Murciano de Investigación y Desarrollo Agroalimentario (adapted from Google Earth on 16/09/2013 under the Creative Commons Licence). ………..39
Figure 2.1.2. Semiopen seawater system with detailed flowwater and elements: R -water renewal; e - expansion tank; s - sand filter; sk - Skimmer; uv - ultra-violet filtration; hp - heat pump. ………40
Figure 2.1.3. Circular experimental tank (216L): external (a. and b.) and internal (c.) views. Arrows refer to tank elements and water flow. ………41
Figure 2.2.1. Transport and acclimatization. a. bag net( 50x80cm), b. portable tank (200L), c. circular acclimatization tank (1970L). ………42
Figure 2.3.1. Raw materials used in formulated diets (A): a. - bogue; a1. - bogue meal; a2. - freeze-dried bogue; b. - freeze-dried squid (T.sagittatus); c. - freeze-dried crab (C. mediterranus); d. - egg yolk powder; e. - commercial glucose; f. - commercial starch; g. - commercial gelatin; h. - water; i. - fish oil. Cooking blender Professional LACOR My Cook 1.8, Taurus (B). Formulated feed on anti-adherent plate and after being demolded (C). ………...45
Figure 2.4.1. Cubed shaped feed pieces (a.) and feed supply (b.). ……….46 Figure 2.4.2. Sampling procedure. a. - transport of octopus individuals from the rearing tanks to the sampling area in a net; b. - weighing; c. - octopus transfer to the net before being placed back into the corresponding rearing tank. ………..47
Figure 2.5.1. Numbered bags containing sacrificed octopuses (a.) and digestive gland
crushing machine; d. - sample cut as cubes into the crushing machine; e. - homogenous sample; f. - plastic bag with the sample. ………..51
Figure 2.5.3. Faeces samples preparation. a. Frozen faeces; b. Cut frozen faeces; c. -freeze-drying plates prepared; d. - freeze-dried faeces sample. ………..52
Figure Error! Use the Home tab to apply 0 to the text that you want to appear here.. Moisture samples for moisture determination [Method 930.15 (Cunniff, AOAC, 1997)]: a. - digestive gland sample; b. - muscle sample; c. - mineral sample …53
Figure Error! Use the Home tab to apply 0 to the text that you want to appear here.2.6.2. Crude protein determination by the Kjeldahl Method 954.01 (Cunniff, AOAC, 1997). Arrows indicate the sequence: a. - sample and commercial catalyst; b. - sample, commercial catalyst and sulfuric acid (95-97%); c. - sample digestion (≈420˚C) and gas condenser; d. - green color of the samples denote the end of the digestion; f. - cold sample mixed with 20mL of distilled water; e. - distiller, the tube contain the sample (left) and the Erlenmeyer a color solution (right); g. - distillation, the sample became black when sodium hydroxide (NaOH) is added, a volume of 150mL was established as the end of distillation; h. - determination; i. - color solution (left), distilled sample (middle) and established white for the determination (right). ……….54
Figure 2.6.3. Crude lipid extraction by Method 920.39 (Cunniff, AOAC, 1997). a. and b. - moisture extraction; c. - capsules for lipid extraction; d. - SOXTEC AVANTI 2058; e. - extracted crude lipid. ……….54
Results
Figure 3.2.1. Mean temperature and oxygen saturation for replicates of Mb and
FDb………...59
Figure 3.3.1. Mean temperature and oxygen saturation for replicates of 2FDb or 3FDb feeding protocols. ………64
Figure 3.3.2. Mean temperature and oxygen saturation for each feeding protocol (2FDb or 3FDb) by experimental week. ……….65
Figure 3.3.3. Instantaneous Feeding Rate (IFR) for two (2FDb) and three (3FDb) day of starvation. a - significant for P<0.05; b - significant for P<0.01. ………68
Figure 3.3.4. Feeding Rate per Week (WFR) for both starvation treatments (2FDb and 3FDb). ………..69
Discussion
Figure 4.1.1. Proximate composition (% wet weight), protein-energy ratio (P/E, g/MJ) and gross energy (kJ/100g) of diets formulated with bogue, freeze-dried (FDb) or meal
(Aguado Giménez, García García, 2002). ……….73
Figure 4.1.2. Comparison of AGR, SGR, AFR, SFR, FE and FCR obtained for diets in the present study (FDb = freeze-dried bogue; Mb= bogue meal), for natural diets [craba (Cerezo Valverde et al., 2008)] and bogueb(García García, Aguado Giménez, 2002)] and for other formulated diets: Sc= freeze-dried European flying squid, (Morillo-Velarde et al., 2012b), fish meald (Querol et al., 2012b) and a mixture of fish and krill meals ef (Querol et al., 2013), where the 3FMK diet contained fish meal in a triple proportion than the FMK diet. ………...75
Figure 4.1.3. Comparison of apparent digestibility coefficients of protein (ADCPROT), lipid (ADCL), dry matter (ADCDM) and nitrogen-free-extract (ADCNFE) obtained for the experimental diets formulated with freeze-dried bogue (FDb) or bogue meal (Mb) and with natural diets (crab and bogue) in similar conditions (Hernández, García García, 2004). ………...79
Figure Error! Use the Home tab to apply 0 to the text that you want to appear here.4.1.4. Thermal melting point of a protein [adapted from (Lehninger, 1981)]. …81
Figure 4.2.1. Specific growth rate (SGR, % body weight.day-1) obtained for different feeding protocols (differing by starvation days per week) feeding with crab (García García, Cerezo Valverde, 2004) and with the tested diet (FDb). ………..………..82
Figure Error! Use the Home tab to apply 0 to the text that you want to appear here.4.2.2. Specific feeding rate (SFR, % body weight·day-1) obtained for different feeding protocols (differing by starvation days per week) feeding with crab (García García, Cerezo Valverde, 2004) and with the tested diet (FDb). ………83
Figure 4.2.3. Food conversion rate (FCR) obtained for different feeding protocols (differing by starvation days per week) feeding with crab (García García, Cerezo Valverde, 2004) and with the tested diet (FDb). ……….…………84
Materials and methods
Table 2.3.1. Basal mixture (%), proximate composition (% dry weight) and statistical analysis of freeze-dried bogue (FDb) or bogue meal (Mb) formulated diets. ………….44
Table 2.4.1.1. Feeding protocol 1. ………..48 Table 2.4.2.1. Feeding protocol 2. ………..49 Table 2.5.1. Sampling protocol applied to replicates by treatment in both experiments………...50
Results
Table 3.1.1. Results of the water stability tests for diets based on freeze-dried bogue (FDb) or bogue meal (Mb). ……… 58
Table 3.2.1. Statistical results for temperature and oxygen saturation in experiment
1………...59
Table 3.2.2. Weight (W), weight gain (Wg), absolute growth rate (AGR), specific growth rate (SGR), absolute feeding rate (AFR), absolute protein feeding rate (APFR), absolute lipid feeding rate (ALFR), specific feeding rate (SFR), feed efficiency (FE), feed conversion ratio (FCR), protein productive value (PPV), lipid productive value (LPV) and digestive gland index (DGI) of each experimental group fed with formulated diets with freeze-dried bogue (FDb) or bogue meal (Mb) and statistical results. ……...60
Table 3.2.3. Statistical results of Univariate General Linear Model applied to weight gain between diets. ………...61
Table 3.2.4. Statistical results and data of freeze-dried faeces proximate composition (% dry weight) and apparent digestibility coefficients obtained with formulated diets with freeze-dried bogue (FDb) and bogue meal (Mb). ………62
Table 3.2.5. Macronutrient composition (% dry weight) of the different fractions of common octopus fed diets formulated with freeze-dried bogue (FDb) or bogue meal (Mb) and statistical results. ……….63
Table 3.3.1. Statistical results for temperature and oxygen saturation in experiment
2………64
Table 1. Statistical results of weekly temperature and oxygen saturation of both experimental groups, 2FDb and 3FDb. ………65
growth rate (SGR), absolute feeding rate (AFR), absolute protein feeding rate (APFR), absolute lipid feeding rate (ALFR), specific feeding rate (SFR), feed efficiency (FE), feed conversion ratio (FCR), protein productive value (PPV), lipid productive value (LPV) and digestive gland index (DGI) of each feeding protocol, two (2FDb) and three (3FDb) day starvation, and statistical results. ………..66
Table 3. Statistical results of Repeated Measures General Linear Model applied to weight data………67
Table 3.3.54. Statistical results of instantaneous feeding rate (IFR) analysis.
………….68
Table 3.3.6. Statistical results of Repeated Measures General Linear Model applied on weekly feeding rates (WFR). ………...69
Table 3.3.7. Statistical results and data of freeze-dried faeces proximate composition (% dry weight) and apparent digestibility coefficients obtained with formulated diets with freeze-dried bogue two (2 FDb) and three (3 FDb) days starvation. ………...70
Table 3.3.8. Proximate composition (% dry weight) of the different fractions of common octopus fed diets formulated with freeze-dried bogue with two (2 FDb) or three days (3 FDb) starvation and statistic results………..71
Discussion
Table 4.1.15. Comparison of AGR, SGR, AFR, SFR, FE and FCR obtained for diets in the present study (FDb = freeze-dried bogue; Mb= bogue meal) and for other formulated diets with: a mixture of bogue and crab mealsab(Estefanell et al., 2012; Estefanell et al., 2009a) and krill mealc(López et al., 2009). ………77
ADCN Apparent Digestibility Coefficient for nutrients
AIA Acid Insoluble Ash
AFR Absolute Feeding Rate
AyFR Absolute protein/lipid Feeding Rate
AGR Absolute Growth Rate
BWest Body Weight estimation
BWest4 Body Weight estimation for the 4th day of the week (Thursday)
C Carcass
CH Carbohydrates
CIMA Consellería de Pesca e Asuntos Marítimos
CIFAP Centro de Investigación y formación Acuícola y Pesquera
CSIC Consejo Superior de Investigaciones Científicas
DAH Days After Hatching
DG Digestive Gland
DGI Digestive Gland Index
DGw Digestive Gland weight
DHA Docosahexaenoic acid
DWi Initial Dry Weight
DWf Final Dry Weight
FAO Food and Agriculture Organization of the United Nations
FCR Food Conversion Ratio
FDb Freeze-dried bogue based diet
FE Feed Efficiency
FRA France
GER Germany
I.E.O Instituto Español de Oceanografía
IF Ingested food
IFAPA Instituto Andaluz de Investigación y Formación Agraria y Pesquera, Alimentaria y de la Producción Ecológica
IFR Instantaneous Feeding Rate
IMIDA Instituto Murciano de Investigación y Desarrollo Agrario y Alimentario
IRTA Institut de Recerca i Tecnología Agroalimentàries
M Muscle
Mb Meal bogue based diet
NET Netherlands
NFE Nitrogen-free extract
POL Poland
P/E Protein-Energy ratio
SFR Specific Feeding Rate
USD United States Dollar
Wa Average weight
Wi Initial weight
Wf Final Weight
WFR Weekly Feeding Rate
Wg Weight gain
WSI Water Stability Index / Disaggregation
yPP Lipid/protein Productive Value
2FDb Two day starvation protocol fed with freeze-dried bogue based diet
1. Introduction
1.1.Current status of world aquaculture
Aquaculture is a millennia practice apparently originated in ancient China and Mesopotamia 3,000 to 4,000 years ago. It can be defined as farming of aquatic organisms – including fish, molluscs, crustaceans and aquatic plants - under controlled or semi-controlled conditions which imply some practices – stocking, feeding, protection against predation, harvesting - in order to enhance growth, development and production (Barnabé, 1991; FAO, 1997; Stickney, 2005).
At present, global fishery captures are stabilized around 90 million tons per year (FAO, 2012). This is a trend verified since 2000 (Fig. 1.1.1), due to the decline suffered by fisheries stocks at worldwide level. Indeed, the latest FAO report highlights the poor state of fisheries, being 87% of world's fish stocks fully exploited, overexploited or depleted.
0 20 40 60 80 100 2000 2005 2006 2007 2008 2009 2010 2011 Inland Captures Marine Captures Inland Aquaculture Marine Aquaculture Total capture Total aquaculture
Production (million tons)
Y
e
a
r
Figure 1.6.1. World Fisheries and Aquaculture Production Statistics, (FAO, 2004; 2009; 2012).
Nonetheless, according to FAO (2009), world food production will need to increase by 70% between 2005/07 and 2050 to support the demands created by the increasing world population, globalization and the connection between markets. Since fisheries production has reached its maximum, the only way of meeting these demands is by aquaculture. Undeniably, aquaculture should be considered not only as an aid to the sustainability of fisheries by reducing the pressure of overfishing on wild stocks but also as a proposal as farming activity with the greatest potential (FAO, 2012; Kura et al., 2004). In fact, the
importance of aquaculture can be summarized in the following sentences: “Give a man a fish
and he will have food for a day, teach a man how to fish and he will have food for a lifetime” (Chinese proverb); so, analogously: “Teach a man how to grow fish and he can feed the world”.
At present, around 50% of consumed seafood products come from aquaculture but FAO expects an increase above 65% by 2030. Aquaculture contribution to global fisheries production has been increasing gradually since the beginning of this activity: 9% in 1980, 20.9% in 1995, 32.4% in 2005, and 40.3% in 2010 (FAO, 2004; 2012). Since 1970, aquaculture has expanded, diversified its production and improved in technology to occupy
the production position of fisheries. Overall aquaculture’s year production has doubled in
the last decade (2000-2010) to 41.30% of total world production. Recent data (2011) point to a 55.8% increase in total aquaculture production compared with reported data for 2000 (Fig. 1.1.1). During the same period, inland aquaculture production has doubled while marine aquaculture has increased gradually by 25.0%, representing 12.5% of total world production in 2011 (Fig. 1.1.1). Nowadays, aquaculture production per person is higher than that of fisheries, namely 3.6 and 2.3 tons per person per year, respectively (FAO, 2012).
Nearly the entire aquaculture production is for human consumption. Edible fish production has increased 12 times at an annual rate of 8.8% in the last thirty years; while the overall aquaculture production grew more slowly. In 2010, aquaculture production attained an historical maximum production of 59.9 million tons of edible fish, valued as 119,400 million USD. If aquatic plants and non-edible products were included, the total amount would sums up to 79 million tons and 125,000 million USD. Global aquaculture volume production is focused on fresh water species (33.7 million tons), molluscs (14,2 million tons), crustaceans (5.7 million tons), diadromous fish (3.6 million tons), marine fish (1.8 million tons) and others (814,300 tons) [Fig. 1.1.2 (FAO, 2012)]. In 2010, global production importance, in terms of value, was 58.1% freshwater aquaculture, followed by 29.2% of marine, and 12.8%
of brackish water located exploitations (FAO, 2012).
Figure 1.1.7. Global aquaculture volume production (FAO, 2012).
The per capita world consumption of seafood has shown a growing trend in the last half century –from 9.0 kg, in 1961, to 18.5 kg, estimated for 2009. In that same year, European per capita consumption attained 21.9kg, being higher than the world average. (FAO, 2013b).
World aquaculture production is concentrated in Asian countries (91% of world production in 2011), being China the largest contributor with 60% of total world production (47% of global commercial value, which accounts for 64,269 million USD) in the same year, followed by America, Europe, Africa and Oceania (FAO, 2010-2013).
The largest contributors to the European aquaculture production in 2010 (2.5 million tons) was Norway (39.95%), followed by Spain (10.00%), France (8.89%), United Kingdom (7.97%) and Italy (6.08%) (FAO, 2012). In 2011, production raised to 157,817 tons (corresponding to a net value of 11,195 million USD) and represented 3.20% of total global production (FAO, 2010-2013). Marine European aquaculture, was the mainly contributor (82.00% of European production in 2011); which increased 620,177 tons from reported data since 2000. On the other hand, the inland outcomes remained stabilized around 460,000 tons (FAO, 2010-2013). Mariculture and brackish water products increased from 55.6% in 1990 to 81.5% in 2010. From those, three quarters corresponded to finfish production and the
remaining quarter to molluscs; crustaceans and algae aquaculture is reduced (APROMAR, 2012; FAO, 2012).
During the last twenty years aquaculture has developed considerably. The recognition as an alternative to extractive fishery led to the enforcement of several basic and applied researches to increase and diversify the number of exploitable species worldwide. Market oversaturation of certain species being produced, the fast decline of the worldwide fishery stocks and the technological advances over the last 20 years can be identified as other triggers for production diversification (Sarrasquete, 2012). In fact, species diversification, market expansion and the reduction of production costs are strategies that allow greater flexibility to changes in market demand. Produced products, as food and feeds, are well integrated in the current market and global fish trade has grown remarkably. Indeed, trade of fishery goods has increased fourteen times since 1976 to 2010, to an astonishing 109 billion USD. If aquatic plants, non-edible fish fractions, or others are considered, the market grew more 1,300 million USD. The 71% of global exports of fish or fishery products were directly used for human consumption in 2010, highlighting the relevance of world-trade on global feeding. Since 2002, China as attained the position of first worldwide exporter (13,268 and 17,100 million USD in 2010 and 2011, respectively), representing nearly 12% of global trade, followed by Norway with around 4,500 million USD less export value. World imports of fish and fishery products raise 86% from 2000 to 2010, when a maximum of 111,800 million USD was registered. In 2010, the main importing countries of fishery products in the world were the United States of America (USA) and Japan (15,496 and 14,973 million USD, respectively), followed by Spain (6,637 million USD), China and other European countries, such as France, Italy, Germany, United Kingdom and Sweden. In 2011, the USA and Japan, raised their imports up to 17,500 and 17,400 million USD, respectively, followed by China as third, with 7,600 million USD (FAO, 2012).
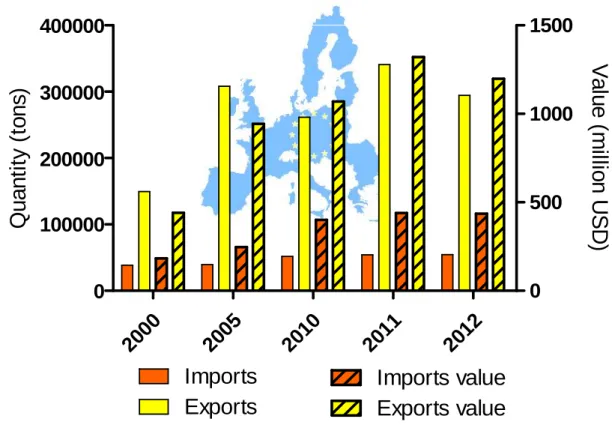
A consumption increase in the European Union (EU) has converted this region in the largest single market for imported fishery products and fish (FAO, 2012). Interestingly, the EU has traditionally exported much more than it imports. In 2012, exports doubled its volume and almost tripled its economic value registered in 2000. Comparatively, the imports growth rate was less marked over the same period in volume, but grew 60% in value [Fig. 1.13 (Administration, 2013)].
20
00
20
05
20
10
20
11
20
12
0
100000
200000
300000
400000
0
500
1000
1500
Imports
Exports
Imports value
Exports value
Q
u
a
n
ti
ty
(
to
n
s)
V
a
lu
e
(
m
illi
o
n
U
S
D
)
Figure 1.1.8. European Union imports, exports and related values (Administration, 2013).
In 2010, the EU accounted for 40% of total world imports of fishery products in value (44,600 million USD), including community trade. Nevertheless, from those, 23,700 million USD imports were attributed to extra-EU countries – in descending value order of import: Asia, South America, Africa, North America and Oceania -, representing 26% of total world imports. Analogously, in 2011 imports reached 50,000 and 26,500 million USD, including and excluding intra-community trade, respectively (FAO, 2012). In 2010-2011 the United Kingdom (UK), Poland (POL), Spain (SPA) and France (FRA) were the main importer countries of fishery products, corresponding to around 35%, 13% and 12%, respectively, of total EU imports (54,479 tons and 1,198 million USD; Fig. 1.1.4). In 2012, all of these main importers declined, except SPA, which increased up to 16% and attained the second position, only surpassed by UK [32%; Fig. 1.1.4 (Administration, 2013)].
U
K
P
O
L
S
PA
FR
A
N
ET
0
5000
10000
15000
20000
25000
0
50
100
150
2010
2011
2012
2012 Value
Q
u
a
n
ti
ty
(
to
n
s)
V
a
lu
e
(
m
illi
o
n
U
S
D
)
Figure 1.1.9. European Union main import countries, and related value: United Kingdom (UK), Poland (POL), Spain (SPA), France (FRA) and Netherlands (NET); (Administration, 2013)..
It is also interesting that the most valuable imports for 2012 came from the UK (28%), SPA (18%) and NET (14%), Fig. 1.1.4. Analogously, Germany (24%; GER), Netherlands (16%; NET), FRA (13%), SPA (11%) and UK (11%) congregated the economic value of EU exports [Fig. 1.1.5; (Administration, 2013)]. GER (29%) and NET (19%) volume contribution was massively higher than that of other countries, which represented less than 10% of the EU exports volume. Nevertheless, a growing trend was observed, with an EU export maximums being observed in 2011 [Fig. 1.1.5; (Administration, 2013)].
G
E
R
N
E
T
FR
A
D
E
N
S
P
A
U
K
0
20000
40000
60000
80000
100000
0
100
200
300
2010
2011
2012
2012 Value
Q
u
a
n
ti
ty
(
to
n
s)
V
a
lu
e
(
m
illi
o
n
U
S
D
)
Figure 1.1.10. European Union main export countries and related value: Germany (GER), Netherlands (NET), France (FRA), Denmark (DEN), Spain (SPA) and United Kingdom (UK); (Administration, 2013)
1.2. Aquaculture in Spain
Spain is a peninsular nation, with a large shoreline of almost 8,000 Km that has established a strait association between population, sea and its products. Spanish per capita consumption was the double of World and European average values for 2009 [42.9kg, 18.5kg and 21.9kg per year, respectively (FAO, 2013b)]. Martín (2010) reported a 27.6kg per capita and per year for Spain; where 15.3kg were finfish, 8.3kg seafood, molluscs and crustaceans, and 4.0kg were preserved seafood. According to APROMAR (2012), these corresponded to a preference in consumption of hake, cephalopods and sardine / anchovy, respectively.
Spain is considered a traditionally fishery country with a specific orography and climatology, which translates into physicochemical and environmental advantages for marine aquaculture.
companies used to grow molluscs in Galicia (northwest of the country). They started as pilot-scale investments in the 1980’s, which were driven by scientific research, until a maturity of the industry was reached in the 1990’s, with development of new technologies and industrialization of the sector (FAO, 2005-2013).
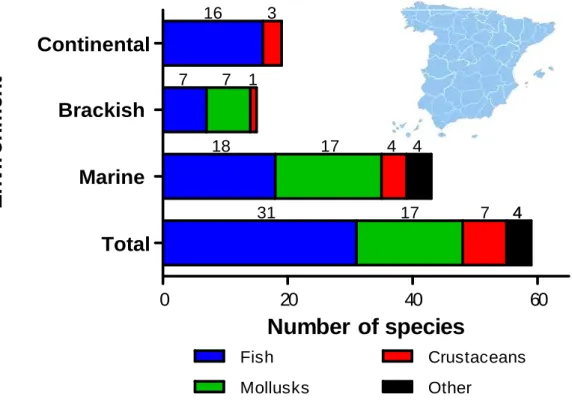
At the present, Spanish aquaculture is focused on fish and molluscs species, [Fig. 1.2.1 (MAGRAMA, 2013)]. Therefore, nine species embody the 93% of total production volume (Fig. 1.2.2). Almost all are saltwater species.
0 20 40 60
Total
Marine
Brackish
Continental
Fish Crustaceans Mollusks Other 16 3 7 7 1 18 17 4 4 4 4 7 17 31Number of species
E
n
v
ir
o
n
m
e
n
t
Figure 1.2.1. Number of produced species by culture environment in Spain (2011) (MAGRAMA, 2013).
Mussels (Mytilus galloprovincialis) culture volume corresponds to more than ¾ of total aquaculture production (Fig. 1.2.2). The remaining species exceed a million ton per year production (Fig. 1.2.2).
Figure 1.2.2. Main aquaculture species in Spain in 2011; data is only referred to the on-growing phase (MAGRAMA, 2013).
Seventy three per cent (253,354.3 tons which accounts for 4,917.2 million USD) of all the species grown in Spain are cultured in marine environments (Fig. 1.2.3). Freshwater species (approximately 90) are traditionally cultured in continental environments, accounting for 6% and 11% of total Spanish production and economic inputs (Figs. 1.2.1, 1.2.2 and 1.2.3).
a. b.
In Spain, the centralized production of few species (mainly sea bream, sea bass and trout) triggered market saturation and, consequently, lower selling prices. For instance, in 1999, the sea bream price was very similar to its production cost (González-Laxe, 2000). The difficulty of selling the production and the little profit margins has made aquaculture less attractive, which led to limited investment in these species. To counteract this situation, the Spanish Government promoted a series of Mariculture Plans, focused on applied research regarding on-growing and diversification of marine species. Diversification can be seen as a tool to improve the sustainability and competitiveness of the industry as well as a strategy to increase production and ensure that aquatic animal protein is obtained from different sources. Nonetheless, industrial farming success requires the control over the biological cycle of the species because, in production terms, any life stage may limit profitability (Sarrasquete, 2012).
In this sense, according to Pillay (2005), the selection of potential species for aquaculture must consider inherent characteristics of the organisms as biological traits, growth rate, size, age of sexual maturity, adaptability to captivity, ease of reproduction in captivity, fecundity and spawning frequency, food habits and acceptability of artificial food, feed conversion efficiency, resistance to unfavourable environmental conditions and density of establishment. In addition, it should also consider market demands, product availability,
consumption, and consumers’ acceptance.
Currently, Spain is betting on market diversification through an effort in research on species such as the amberjack (Seriola dumerili), red porgy (Pagrus pagrus) or striped mullet (Mullus sp.) and cephalopods, such as the common octopus (Octopus vulgaris) (APROMAR, 2012).
1.3. Cephalopods Production
Cephalopods (Schneider, 1784; from Greek kephalé, “head” and podós, “foot”, means “foot
in the head”) are invertebrate organisms belonging to the Mollusca phylum. The
Cephalopoda class includes the Nautiloidea, Ammonoidea and Coleoidea subclasses. The Coleoidea subclass includes cuttlefish, squids and octopus species in various orders (Guerra, 1992). In general terms, cephalopods are bilaterally symmetrical species characterized by the presence of tentacles or arms with suckers; the reduction, migration to internal cavities
or disappearance of the shell; pigment cells in the mantle that allow them to change colour rapidly; developed eyes and low frequency hearing to locate preys; a complex nervous system; body covered by a muscular sac enclosing organs and conferring it flexibility; the ability to eject toxic ink as a defence and the presence of a radula into the mouth connected to the oesophagus (Nesis, 1982).
While ground fish landings have suffered a worldwide generalized decline, cephalopod landings have increased showing the potential of this natural production. According to Caddy, Rodhouse (1998), the markedly increase on cephalopods abundance was possibly caused by an ecosystem response to the heavy fishery pressure. Hence, cephalopods fishery might be recognized as a manner to diversify and reduce fishery effort during the second half of the twentieth century, when these species were considered foreign resources (Vaz-Pires et al., 2004).
Traditionally, cephalopod fisheries were located mainly in southern Europe. However, the depletion of traditional fisheries resources and the high abundance of cephalopod species have caused the spreading of capture by North-European coastlines. Commercial and small-scale cephalopod fishery is done inshore and offshore, especially in Portugal, Spain, Italy and Greece, where human consumption is more relevant. The recent development of more efficient fishery gears, such as plastic pots or fykenets, has resulted on higher catches (Pierce et al., 2010). The Spanish cephalopod trawl fleet fishes mainly in Mauritania and Guinea Bissau, subjected to a communitarian license, and have their base at La Luz harbour in Las Palmas de Gran Canaria (Canary Islands). Fishery is performed during periods of 1-2 months with closures during the breeding season (September and October) in both areas. The nearly 100 fishery trips performed per year, results in a total cephalopod annual captures of 6,100 tonnes (Rafel et al., 2010).
Cephalopods farming for human consumption have never had great relevance due to their abundance from fishery captures (Fig. 1.5.1). Nonetheless, these species are attractive for industrial aquaculture (García García, García García, 2011; Iglesias, Sánchez, 2007; Vaz-Pires et al., 2004) due to its high market value and consumption in the Mediterranean and Asian regions, an observed increasing consumption trend in Oceania [Fig. 1.3.2 (FAO, 2013b)], increasing world consumption predictions and the new open market represented by America (Sykes et al., 2006).
1990 1995 2000 2005 2010 0.0 0.5 1.0 1.5 Africa Americas Asia Europe Oceania World k g /c a p it a
Figure 1.3.1. Cephalopods consumption by continent (FAO, 2013b).
According to FAO (2013b), an increasing consumption trend was verified since 1990’s. This was mainly due to contributions from Oceania and Europe (Fig. 1.3.1). In contrast, a higher intake (kg/per capita/year) was observed in Asiatic and European countries compared to Oceania (Fig. 1.3.2). In 2009, New Zealand (3.20kg/capita) - the only Oceania country
included into the “top ten cephalopod consumer countries in 2009” - was in seventh
position, after Japan (4.90kg/capita), Spain (4.50kg/capita), Portugal (4.10kg/capita), Republic of Korea (4.00kg/capita), Greece (3.70kg/capita) and Italy (3.60kg/capita) (Fig. 1.3.2).
2005 2006 2007 2008 2009 0.0 2.0 4.0 6.0 Spain Portugal Italy Greece Croatia Japan New Zealand Peru Republic of Korea Thailand Viet Nam Year k g /c a p it a
Figure 1.3.2. Main cephalopod consumer countries (FAO, 2013b).
1.4.Cephalopods aquaculture
Currently, there are around 700 known cephalopod species. From those, 10% have been kept in captivity for maintenance (term referred when accommodation is done with individuals of the same age), rearing (when individuals are grown during a period without reaching the second generation), or culture (when the complete vital cycle is achieved in captivity, from hatching to second generation) for different purposes as behaviour and predator-prey relation research or just for obtaining live animals for aquarium display (Boletzky, Hanlon, 1983; Iglesias, Sánchez, 2007).
Culture tests were carried out in a dozen species without obtaining generally satisfactory results for application to industrial scale. Hence, cephalopod commercially viable culture is still in development. The main bottlenecks are the poor growth and high mortality rates of paralarvae (they are carnivorous and require live prey as food), which hinders the development of a suitable food (Iglesias, Sánchez, 2007; Pierce et al., 2010).
Interest on cephalopod maintenance in captivity dates back to the early twentieth century
when Grime, in 1928, made an accurate report translated as “Maintenance, handling and breeding cephalopods for zoological and physiological purposes” as referred in Boletzky,
biological, ecological, pathological, nutritional and behavioural points of view in various cephalopod species (Boletzky, Hanlon, 1983).
Initial studies made by Japanese and Korean researchers on Sepiidae species (cuttlefish: Sepia esculenta, Sepia subaculeata, Sepiella maindroni, and squid: Sepioteuthis lossoniana, Euprymna berryi) noted large quantities of fry supply and good rearing results under favourable conditions and appropriated food supply, making them interesting in terms of culture (Choe, 1966; Choe, Ohshima, 1963). Nowadays the most studied species is Sepia officinalis (Iglesias, Sánchez, 2007). A culture related research review was published by Sykes et al. (2006) noting lower fertility and fecundity in captivity, a semelparous life, live food requirements by hatchlings, probable intensive culture difficulties due to the species basic immunological system and the absence of an inert food as bottlenecks for culture development (Iglesias, Sánchez, 2007; Pierce et al., 2010).
Within the Octopodidae family, several species are currently being studied in different locations of the world. For instance, the Mexican red octopus (Fig. 1.4.1), Octopus maya (Voss, Solis Ramirez, 1966), is an endemic species of the Yucatan Peninsula (Mexico), with great potential as a laboratory model in biomedical research – immunology, behaviour, neurobiology, endocrinology and aging (Van Heukelem, 1977; 1983). It is a holobenthic species, hence new-borns are benthonic and similar to adults. The absence of a paralarvae stage seems to be an advantage for culture purposes. Nonetheless, high mortality, non-appreciable growth and pronounced cannibalism were observed when individuals were fed with dried or prepared diets (Iglesias, Sánchez, 2007; Van Heukelem, 1977). The current research is focused on the development of an artificial diet, testing various ingredients and binders (Águila et al., 2007; Quintana et al., 2011; Rosas et al., 2007; Rosas et al., 2008), feeding strategies (George-Zamora et al., 2011), and temperature related physiological mechanisms (Noyola et al., 2013). According to Rosas et al. (2013) the inexistence of a suitable artificial diet for this species is caused by changes in protein structure (which affects protein digestibility) during cooking and by alterations on nutritional characteristics during ingredient process (which affects the nutritional composition of diet).
Figure 1.4.1. Octopus maya [adapted from GrupoGarzaLimón (2012)].
Another South America species, Octopus mimus (Fig. 1.4.2) is also being studied. The species inhabits from north Peru to San Vicente bay in Chile. Although the species biology is known and was described by Cardoso et al. (2004), O. mimus displays a regional interest for aquaculture production but the obtained results from reproductive and nutritional experiences are still at laboratory level (Uriarte et al., 2012; Uriarte et al., 2011; Zuñiga et al., 1995). Acceptable growth rates and low mortality were observed by supplying natural food on juveniles and sub-adults for extended periods (Baltazar et al., 2000; Carrasco, Guisado, 2010). In contrast, the lack of a proper prey for paralarval feeding represents a bottleneck for juvenile production but, analogously to the previous species, grow-out has been tested and some success was achieved by using formulated diets with various ingredients and binders (Uriarte et al., 2011).
Figure 1.4.2. Octopus mimus [adapted from RadioPaladar (2011)].
Several other cephalopod species were and are been studied worldwide; but the most studied species is undoubtedly the common octopus, Octopus vulgaris (Fig. 1.4.3).
1.5. Octopus vulgaris as a Potential Species in Spain
O. vulgaris, is a benthic-neritic non-shelled cephalopod, worldwide distributed in warm waters (temperate and tropical) with unascertained geographical limits, although their inactivity below 7˚C is well-known. This cosmopolitan species inhabits coastal and continental shelf waters - from 0 to 200 meters - in a wide variety of habitats. In nature, the species display a seasonal migration pattern, which is slightly different in time, depending on their location. In early spring, the western Mediterranean population initiates their migration. At this time, maturing and mature octopuses migrate to shallow waters and return to deeper waters by August/September. Immature octopuses show the same pattern with a delay of around two months. O. vulgaris has two reproduction peaks, the more relevant in terms of recruitment coinciding with the migration pattern in the Mediterranean (April/May), and the second in October (FAO, 2013a).
Spain has an important O. vulgaris fishery fleet. The Spanish fishery production of this species from 1996 to 2012 corresponded to ≈⅓ of global Octopus production, and half of the European production (Fig. 1.5.1). In addition, Spain produces this species through aquaculture, but nowadays the achieved production volume is not significant (FAO, 2010-2013).
1996 1998 2000 2002 2004 2006 2008 2010 2012 0 20 40 20000 40000 60000 3.0×10⁷ 8.0×10⁷ 1.3×10⁸ 1.8×10⁸ Global Production
O. vulgaris European Prod.
O. vulgaris Spanish Prod. Global Aquaculture Prod. O. vulgaris Spanish A.P.
Octopus Global Prod.
Q u a n ti ty ( to n s )
Figure 1.5.1. Global production (including fisheries and aquaculture volumes), global aquaculture production, Octopus global production, European and Spanish fisheries production, and Spanish aquaculture volumes for Octopus vulgaris (FAO, 2010-2013).
The common octopus has aroused great interest in recent years as a new product for aquaculture because of its great appreciation by consumers, a broad international market, an attractive selling price, its potential for marine aquaculture and industrial scale exploitation (García García, García García, 2011; Vaz-Pires et al., 2004); conferred by: its short life cycle (12-18 months); rapid growth rates up to 5% of their body weight per day and by 13% body weight increase per day on sub-adults; high feed conversion rates with the incorporation of 30-60% of ingested food to their weight (depending on temperature and diet might be 15-43%); high fecundity (100,000-500,000 eggs per female); high protein content (70-90% of dry body weight); fast and good adaptation to captivity; good acceptance of inert food and high resistance to handling and transport (Aguado Giménez, García García, 2002; Iglesias, Sánchez, 2007; Iglesias et al., 1997; Iglesias et al., 2004; Lee, 1994; Mangold, 1983b; Mangold, Boletzky, 1973; Navarro, Villanueva, 2003; Nixon, 1969; Vaz-Pires et al., 2004).
The first feeding and behaviour experiments were performed by Instituto de Ciencias Marinas de Vigo and the Instituto Español de Oceanografía (Guerra, 1978; Guerra, Nixon, 1987). Octopus juveniles were grown in tanks and floating cages obtaining promising results. Since then, many Spanish research centres have shown interest in this species production development, such as Ciencias Marinas del Mar of CSIC, Barcelona (Villanueva, 1995), Centro Costero of I.E.O, Vigo (Iglesias et al., 1997) and Departamento de Bioquímica y Biología Molecular of Universidad de Santiago (Rama-Villar et al., 1997).
A joint initiative by both companies and scientists allowed the optimization of the production systems and the identification of relevant factors at the beginning (García García et al., 2004). The variability on growth, food conversion rates and survival were attributed to culture parameters (temperature, stock density and supplied feed).
Between 2000 and 2004 a National Plan (JACUMAR, “Cultivo de Pulpo” – “Octopus rearing”) was implemented by the Spanish Government. Galician, Asturian, Catalonian,
Valencian, Murcian, Andalucian, Balear and Canarian research groups started working together on the species aquaculture development. The main targets were paralarvae rearing technology development and juvenile on-growing optimization, through optimization of culture systems and improvements in feeds. Despite these efforts, the closing of the life cycle, extensive juvenile production and the development of a formulated diet were not achieved. Further projects, financed by the JACUMAR National Plan, were developed more recently. For instance, in 20072009, “Optimización del engorde de pulpo (O. vulgaris)
-“On-growing common octopus (O. vulgaris) optimization” was performed by research
centers of Galicia (CIMA, Consellería de Pesca e Asuntos Marítimos), Asturias (Centro de Experimentación Pesquera, Consejería de Medio Rural y Pesca), Catalonia (Centro de Acuicultura, Institut de Recerca i Tecnología Agroalimentàries (IRTA)), Valencia (Escuela Técnica Superior de Ingenieros Agrónomos, Universidad Politécnica de Valencia), Murcia (Instituto Murciano de Investigación y Desarrollo Agrario y Alimentario (IMIDA), Consejería de Agruicultura y Agua de la Región de Murcia), Andalucía (Centro de Investigación y Formación Acuícola y Pesquera (CIFAP), Instituto Andaluz de Investigación y Formación Agraria y Pesquera, Alimentaria y de la Producción Ecológica (IFAPA)), and Canary Islands (Instituto Canario de Ciencias Marinas, Gobierno de Canarias). This project was focused on artificial feeding development (semi-moist or lumpy-gelatinous, ensilage or extruded), on-growing optimization in tanks and sea cages, industrial
2010 to 2013, was called “Nutrición y alimentación de paralarvas y subadultos del pulpo de
roca (O. vulgaris) - “Paralarvae and sub-adults feeding and nutrition of common octopus (O. vulgaris)”. The objectives were to develop a culture methodology for paralarvae and manufactured diets with good yields, defining its nutritional requirements.
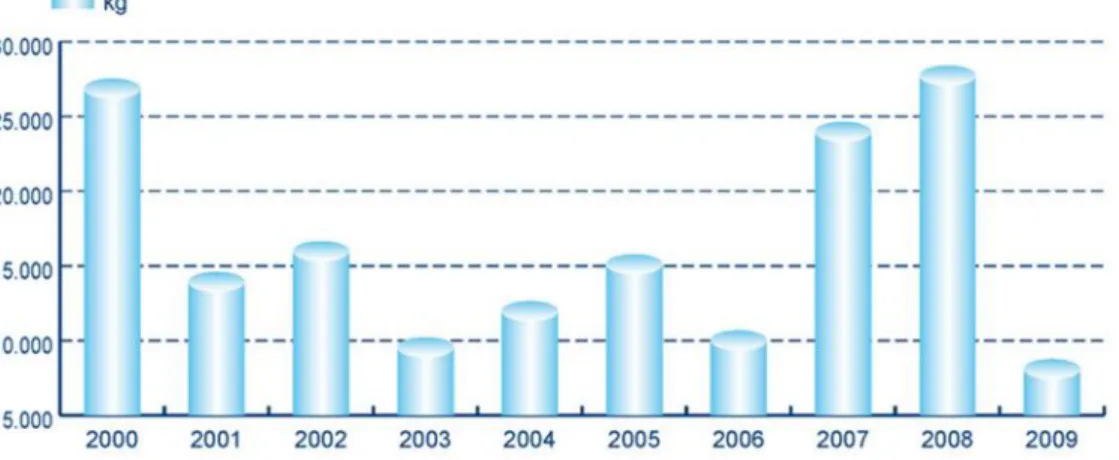
The obtained results in cage design development were applied by the industry in Galicia (García García et al., 2004; Iglesias, Sánchez, 2007). This application resulted in on-growing productions reported from five concessions in Galicia of 12.0, 32.3 and 34.0 tons per year for 1997, 1998 and 1999 (García García et al., 2004; Iglesias et al., 2002). After 2000, the octopus on-growing production decreased below 15 tons per year to a minimum of ≈10 tons per year, verified in 2003 and 2006 (Conselheria-do-Medio-Rural-e-do-Mar, 2009). The production increased once again in 2007 and 2008 to 28.5 tons (Iglesias, Sánchez, 2007) just to abruptly decrease in 2009 to 8.8 tons [Figs. 1.5.2 and 1.5.3 (Conselheria-do-Medio-Rural-e-do-Mar, 2009; FAO, 2010-2013)].
Figure 1.5.2. O. vulgaris aquaculture production in five concessions located in Galicia, Spain. [adapted from Conselheria-do-Medio-Rural-e-do-Mar (2009)]..
The commercial value of cultured octopus in Galician market displays a wide variation with on-growing production years, having a minimum of ≈4.0€/Kg and a maximum of 6.6€/Kg [Fig. 1.5.3 (Conselheria-do-Medio-Rural-e-do-Mar, 2009; Iglesias et al., 1999)].
Figure 1.5.3. O. vulgaris aquaculture production value of five concessions located in Galicia, Spain [adapted from Conselheria-do-Medio-Rural-e-do-Mar (2009)].
In nutritional terms, this species is interesting for its high protein content. Octopus flesh composition is composed by 80% of water, 16.6% of protein, around 1.0% of carbohydrates and less than 2.0% of lipids (Domingues et al., 2006). Compared to fish, octopus flesh contains more protein (20%) but less lipid (50-90%) and carbohydrate (50-90%) (Domingues et al., 2006). Additionally, the non-edible part of these species (around 30%) might provide an extra income, as it can be used for fish meal or baits (Sykes et al., 2006). Furthermore, cultured cephalopods could also be used for scientific or neuro-physiological purposes, as ornamental species or for restocking natural populations (Boucaud-Camou, 1989).
1.6. O. vulgaris aquaculture research
1.6.1. Reproduction and paralarvae rearing
O. vulgaris is a dioeciously species. The reproductive system of males consist of unpaired testis (“tes” in Fig. 1.6.1.1) where spermatozoids are generated and packed into
spermatophores (“sp” in Fig. 1.6.1.1.c.), a duct (which contains a pair of spermatophoric glands for spermatozoid agglutination and membrane development) and the Needham’s sac (for mature spermatophores storage, “Ns” in Fig. 1.6.1.1.c.) connected to outer duct and the
mantle cavity and placed at the opening of female oviducts by the hectocotylized arm (Guerra, 1992; Mangold, 1983b; 1987; Wells, 1978b). Hectocotylus (the right third arm, Fig. 1.6.1.3) differentiation begins in 50-70 g males (Mangold, 1983b). This modified arm is
also used to remove previous stored spermatophores, from other males, from the females’
mantle (Quinteiro et al., 2011) .
Figure 1.6.1.1 Internal view of Octopus vulgaris (a., b., c.). asg- anterior salivary glands; b-beak; bh- branquial hearts; bm- buccal area; br- branchial arcs; cae- caecum; cr- crop; dg-digestive gland; e- esophagus; i- intestine; is- ink sac; k- kidney; Ns- Needham’s sac; psg-posterior salivary glands; s- siphon; sh- systemic heart; sp- spermatophores; sto- stomach
Females have a single ovary (where oocites are formed) connected to a pair of oviducts each one with an oviductal gland (responsible for generating the surrounding egg envelopes after fertilization) opened laterally throughout the mantle cavity (Guerra, 1992; Wells, 1978b).
Figure 1.6.1.2 Octopus vulgaris mating [adapted from Dirscheri (2013)].
Sexual maturation in both sexes is controlled by the endocrine system. The ability of the optical glands to produce hormones is heavily influenced by light and temperature (Guerra, 1992). After courtship, mating occurs. The species is polygamous, so there is no pairing, and mating can occur for several hours with more than one male (Mangold, 1983b). This behaviour results in multiple paternal clusters, which are laid by the female (Quinteiro et al., 2011).


![Figure 1.4.1. Octopus maya [adapted from GrupoGarzaLimón (2012)] .](https://thumb-eu.123doks.com/thumbv2/123dok_br/18635467.911400/37.892.201.726.106.443/figure-octopus-maya-adapted-from-grupogarzalimón.webp)
![Figure 1.4.2. Octopus mimus [adapted from RadioPaladar (2011)].](https://thumb-eu.123doks.com/thumbv2/123dok_br/18635467.911400/38.892.167.758.105.498/figure-octopus-mimus-adapted-from-radiopaladar.webp)
![Figure 1.5.3. O. vulgaris aquaculture production value of five concessions located in Galicia, Spain [adapted from Conselheria-do-Medio-Rural-e-do-Mar (2009)].](https://thumb-eu.123doks.com/thumbv2/123dok_br/18635467.911400/43.892.157.773.121.393/figure-vulgaris-aquaculture-production-concessions-located-galicia-conselheria.webp)