ACPD
8, 8881–8912, 2008Rate constant for the O(1D)+N
2O reaction and O(3P) yield
S. Vranckx et al.
Title Page
Abstract Introduction
Conclusions References
Tables Figures
◭ ◮
◭ ◮
Back Close
Full Screen / Esc
Printer-friendly Version
Interactive Discussion Atmos. Chem. Phys. Discuss., 8, 8881–8912, 2008
www.atmos-chem-phys-discuss.net/8/8881/2008/ © Author(s) 2008. This work is distributed under the Creative Commons Attribution 3.0 License.
Atmospheric Chemistry and Physics Discussions
Absolute rate constant and O(
3
P) yield for
the O(
1
D)
+
N
2
O reaction in the
temperature range 227 K to 719 K
S. Vranckx, J. Peeters, and S. A. Carl
University of Leuven, Department of Chemistry, 200F Celestijnenlaan, 3001 Leuven, Belgium Received: 4 March 2008 – Accepted: 15 April 2008 – Published: 19 May 2008
Correspondence to: S. A. Carl ([email protected])
ACPD
8, 8881–8912, 2008Rate constant for the O(1D)+N
2O reaction and O(3P) yield
S. Vranckx et al.
Title Page
Abstract Introduction
Conclusions References
Tables Figures
◭ ◮
◭ ◮
Back Close
Full Screen / Esc
Printer-friendly Version
Interactive Discussion
Abstract
We have determined, in the temperature range 227 K to 719 K, the absolute rate con-stant for the reaction O(1D)+N2O→products and, in the temperature range 248 K to 600 K, the fraction of the reaction that yields O(3P). Both the rate constants and product yields were determined using a recently-developed chemiluminescence technique for 5
monitoring O(1D) that allows for higher precision determinations for both rate constants, and, particularly, O(3P) yields, than do other methods. We found the rate constant,kR1,
to be essentially independent of temperature between 400 K and 227 K, having a value of (1.37±0.09)×10−10cm3s−1. For temperatures greater than 450 K a marked de-crease in value was observed, with a rate constant of only (0.94±0.11)×10−10cm3s−1 10
at 719 K. The rate constants determined over the 227 K–400 K range show very low scatter and are significantly greater, by 20% at room temperature and by 15% at 227 K, than the current recommended values. The fraction of O(3P) produced in this reaction was determined to be 0.002±0.002 at 250 K rising steadily to 0.010±0.004
at 600 K, thus the channel producing O(3P) can be entirely neglected in atmospheric 15
kinetic modeling calculations. A further result of this study is an expression of the rela-tive quantum yields as a function of temperature for the chemiluminescence reactions (kCL1) C2H+O(
1
D)→CH(A)+CO and (kCL2) C2H+O(3P)→CH(A)+CO, both followed by
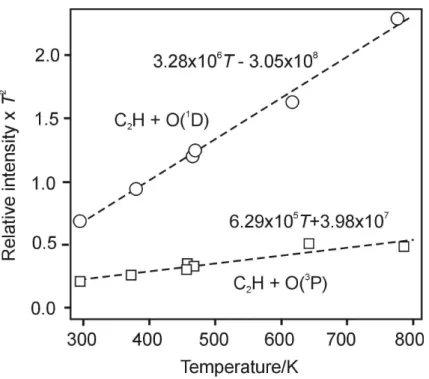
CH(A)→CH(X)+hν, askCL1(T)/kCL2(T)=(32.8T−3050)/(6.29T+398).
1 Introduction
20
The two most important reactions of electronically-excited atomic oxygen, O(1D), in the Earth’s atmosphere are that with H2O, which is the major source of OH radicals
throughout the troposphere, and that with N2O in the stratosphere, producing directly NO and indirectly NO2 via NO+O3→NO2+O2. This latter reaction is part of the
well-known chain mechanism that is crucial for determining stratospheric ozone concentra-25
tions (Crutzen et al., 1971). Besides in the atmosphere, reactions of O(1D) have also
ACPD
8, 8881–8912, 2008Rate constant for the O(1D)+N
2O reaction and O(3P) yield
S. Vranckx et al.
Title Page
Abstract Introduction
Conclusions References
Tables Figures
◭ ◮
◭ ◮
Back Close
Full Screen / Esc
Printer-friendly Version
Interactive Discussion received attention due to their occurrence in gas-phase plasmas used in the
oxida-tion of silicon surfaces (Kaspar et al., 2003) and in photochemical processes in other planetary atmospheres and around comets (Bhardwaj and Haider, 2002; Nair et al., 2005).
In this work we focus on the reaction of O(1D) with N2O, which has seven exothermic 5
product channels
∆rH(298 K)
O(1D)+N2O→ NO2+N −15 (R1a)
→N2+O(3P)+O(3P) −23 (R1b)
→ O(3P)+N2O −190 (R1c)
→ NO+NO −341 (R1d)
→ O2(b1Σ+g)+N2 −364 (R1e)
→ O2(a 1∆
g)+N2 −427 (R1f)
→ O2(X 3Σ−
g)+N2 −521 (R1g)
for which both direct and indirect quantification of the products, N2, NO, and O(3P) have been employed to determine product branching fractions. For the important NO chan-nel,kR1d/kR1 appears to be reasonably well established at room temperature; a value
of 0.61±0.06 (95% confidence) was recommended by Cantrell et al. (1994) following
10
their own study, and analysis of several studies by others up to 1994. The current recommended value of the JPL/NASA panel for stratospheric reactions (Sander et al., 2006) is in line with this at kR1d/kR1=0.6. To the authors’ knowledge no direct
ex-perimental evidence for channel (R1a) has been reported. All O(3P) formed in the title reaction is assumed to be produced by channel (R1c), which is relatively minor at room 15
ACPD
8, 8881–8912, 2008Rate constant for the O(1D)+N
2O reaction and O(3P) yield
S. Vranckx et al.
Title Page
Abstract Introduction
Conclusions References
Tables Figures
◭ ◮
◭ ◮
Back Close
Full Screen / Esc
Printer-friendly Version
Interactive Discussion
kR1c/kR1=0.04±0.02. The rest of the reaction flux (ca. 35% to 40%) passes through
either of, or a combination of, the last three channels (R1e)–(R1g) yielding O2+N2. The
electronic state in which O2is preferentially produced is not established.
As well as the branching ratios, the overall rate constant,kR1, has been determined
in several studies, using a variety of methods (Carl, 2005, and references therein) 5
for following the time profile of O(1D). The current NASA/JPL panel recommendation (Sander et al., 2006) forkR1(298 K) is (1.17±0.40)×10−10cm3s−1, with the uncertainty
representing approximately 95% confidence. This value is based on earlykR1
deter-minations by Davidson et al. (1979), Amimoto et al. (1979), Wine and Ravishankara (1981), and the very recent studies of Blitz et al. (2004), and Dunlea and Ravishankara 10
(2004). Since the reportedkR1 values of the latter two studies differ by some 18% at
room temperature and by almost 30% at lower stratospheric temperatures, no large improvement in the uncertainty of the recommended value over the previous recom-mendation was forthcoming. In fact the latest four determinations ofkR1 show a fair
spread in values at room temperature. For the two studies mentioned above, Dun-15
lea and Ravishankara (2004) determined kR1 to be (1.21±0.04)×10 −10
cm3s−1, and Blitz et al. (2004) determined a value of (1.07±0.08)×10−10cm3s−1, whereas the
lat-est two room-temperature determinations by Takahashi et al. (2005) and by Carl (2005) reported values of (1.35±0.08)×10−10 and (1.43±0.08)×10−10cm3s−1, respectively, where all values are given with their reported 95% confidence limits.
20
The most extensive set of measurements to date are those above by Dunlea and Ravishankara (2004) for which twenty four determinations ofkR1 were carried out over
the temperature range 220 K–370 K. Actually, the high stated precision of those de-terminations reveals a statistically significant difference between the weighted
aver-age of all nine 295 K data, (1.21±0.04)×10−10cm3s−1, and the kR1(295 K) value of
25
(1.34±0.04)×10−10cm3s−1predicted from an Arrhenius fit to all other kR1(T)
determi-nations of that study (fifteen in all). This, together with the most recent data of Taka-hashi et al. (2005) and Carl (2005), suggests thatkR1 is significantly greater than the
current NASA/JPL recommendation, though still within its broad uncertainty limits.
ACPD
8, 8881–8912, 2008Rate constant for the O(1D)+N
2O reaction and O(3P) yield
S. Vranckx et al.
Title Page
Abstract Introduction
Conclusions References
Tables Figures
◭ ◮
◭ ◮
Back Close
Full Screen / Esc
Printer-friendly Version
Interactive Discussion The aim of the present study is three-fold. Firstly, to further reduce the uncertainty in
kR1 for this very important reaction by employing a recently-developed, highly-precise
method (Carl, 2005) for the determination of O(1D) rate constants; secondly, to clearly establish its temperature dependence by extendingkR1 determinations to higher
tem-peratures; and thirdly, to determine the branching fractionkR1c/kR1over a wide
temper-5
ature range to establish its value at stratospheric temperatures. High-temperature rate constant determinations could also aid predictions of stratospheric NO formation rates under conditions where the population of photolytically-produced O(1D) is not entirely thermalized before reaction with N2O (Kharchenko and Dalgarno, 2004).
2 Experimental section
10
We use a method to monitor O(1D), described recently by Carl (2005), based on the 431 nm CH(A→X) chemiluminescence resulting from the reaction,
C2H+O(1D)→CH(A2∆)+CO (R2)
Pulsed laser (10 ns) photolysis of the precursors C2H2 and N2O, at 193 nm,
gener-ates the reactants of the above chemiluminescence reaction. Aside from production of 15
O(1D), N2O photolysis at 193 nm results in a small fraction of O( 3
P) (Φ(O(1D))=0.995, Φ(O(3P))=0.005)) (Nishida et al., 2004). Additional O(3P) can result from O(1D)
quench-ing by the precursor molecules C2H2and N2O, and by the bath gas He. The presence
of O(3P) in the reaction volume also leads to CH(A→X) chemiluminescence by the
analogous, but less efficient, reaction:
20
C2H+O(3P)→CH(A2∆)+CO (R3)
ACPD
8, 8881–8912, 2008Rate constant for the O(1D)+N
2O reaction and O(3P) yield
S. Vranckx et al.
Title Page
Abstract Introduction
Conclusions References
Tables Figures
◭ ◮
◭ ◮
Back Close
Full Screen / Esc
Printer-friendly Version
Interactive Discussion The radiative lifetime of CH(A) due to spontaneous emission is sufficiently short,
at ca. 540 ns, (Luque and Crosley, 1996; Tamura et al., 1998) to ensure its concen-tration establishes a quasi-steady-state within a small time fraction of the O(1D) (or C2H) decay time, such that the temporal profile of the 431 nm emission is determined by the temporal profiles of [O(1D)], [C2H] and [O(3P)]. Both [O(1D)] and [C2H] decay 5
exponentially in the presence of excess reactants, while [O(3P)] resulting from O(1D) will be essentially determined by the quenching kinetics owing to the negligible reac-tivity of O(3P) toward the molecular species present – in sharp contrast to O(1D) and C2H. Thus, the widely differing reactivities of O(
1
D) and O(3P) result in a chemilumi-nescence profile that can be, for the sake of demonstration, easily separated into two 10
components: the first arising from Reaction (R2) and the second from Reaction (R3). The chemiluminescence intensity,Ichem2(t), due to Reaction (R2) is given by
Ichem2(t)∝kR2[O(1D)]t[C2H]t (1a)
∝kR2[O(1D)]0[C2H]0exp[−(k ′
O(1D)+k ′
C2H)t] (1b)
herekO(′ 1D) and k ′
C2H represent the total first-order decay rates of [O( 1
D)] and [C2H], 15
respectively, and [X]0refers to the concentration of X att=0.
Given the negligible removal of O(3P) on the time scale of interest, its temporal con-centration obeys the simple law [O(3P)]∝Q[O(1D)]t=0[1−exp(-k
′
O(1D)t)], whereQis the
fraction of O(1D) that is quenched to O(3P), such that the chemiluminescence intensity due to Reaction (R3),Ichem3(t) is given by
20
Ichem3(t)∝kR3[O(3P)]t[C2H]t (2a)
∝kR3Q[O(1D)]0[1−exp(−k′
O(1D)t)][C2H]0exp(−k ′
C2Ht) (2b)
ACPD
8, 8881–8912, 2008Rate constant for the O(1D)+N
2O reaction and O(3P) yield
S. Vranckx et al.
Title Page
Abstract Introduction
Conclusions References
Tables Figures
◭ ◮
◭ ◮
Back Close
Full Screen / Esc
Printer-friendly Version
Interactive Discussion For larger reaction times, t>5/k′
O(1D), [O( 3
P)] tends to Q [O(1D)]0 , independent of
time, andIchem3(t)∝kR3fq[O( 1
D)]0[C2H]0exp(−k ′
C2Ht). Thus, the values of bothk ′ O(1D)
andkC′
2Hcould be determined by fitting the decay rates ofIchem(t)≡Ichem2(t)
+Ichem3(t)
at short times and at long times, respectively. This analysis is valid provided initial O(3P) formation is minor, such that the decay profile at short times is representative of 5
O(1D) and C2H decay only. The fullIchem expression is given below in Eq. (2).
The ratio of the chemiluminescence channel rate coefficientskR2andkR3in Eqs. (1a),
(1b) and (2a), (2b) is equal to 3.0±0.2 at room temperature. This (T-dependent) value was determined in this study by simply taking two chemiluminescence inten-sity profiles: one when photolysing a mixture of N2O and C2H2 in helium buffer gas,
10
for which O(1D→3P) quenching is negligibly slow, and the second when photolysing
the same mixture in the presence of Ar or N2, for which O( 1
D) is rapidly entirely quenched to O(3P). Indeed, the very low rate constant for O(1D) quenching by He,
<1×10⁻¹⁵cm3s−1 (Dunlea and Ravishankara, 2004; Heidner et al., 1972) leads to a
quenching rate of less than 300 s−1at 10 Torr He at room temperature (1 Torr=133 Nm−2),
15
which is negligible compared to the overall experimental O(1D) decay rates in the range 50 000 to 450 000 s−1. On the other hand, both nitrogen and argon quench O(1D) rapidly, with rate coefficients of (3.1±0.3)×10−11cm3s−1 and (8±3)×10−13cm3s−1 at room temperature (Blitz et al., 2004), resulting in quenching rates at 10 Torr of 1.0×10⁷s−1 and 2.6×10⁵s−1respectively. Thus, extrapolation of the emission intensities tot=0 and
20
taking the ratio in N2 (or Ar) over that in He gives kR2/kR3, provided that CH(A) is not
significantly quenched by the buffer gas (Tamura et al., 1998).
The concentration of each gas in the reaction chamber was calculated from the measured gas flows using the gas law together with the known fractional composition in the high-pressure cylinders. Though not a critical parameter we used the value of 25
the fractional composition for C2H2in He as that stated by the manufacturers of 0.0096.
ACPD
8, 8881–8912, 2008Rate constant for the O(1D)+N
2O reaction and O(3P) yield
S. Vranckx et al.
Title Page
Abstract Introduction
Conclusions References
Tables Figures
◭ ◮
◭ ◮
Back Close
Full Screen / Esc
Printer-friendly Version
Interactive Discussion The concentration of N2O is, of course, an important parameter. The suppliers
spec-ification is 5.0% N2O in high-purity He. However, the fractional concentration of the
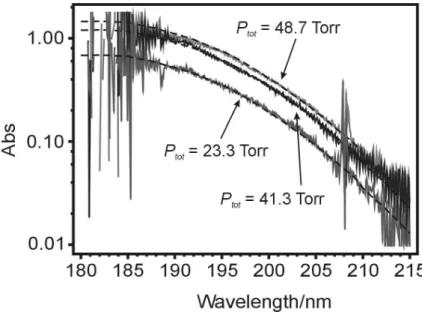
cylinder was checked by single-pass uv optical absorption in a 1.2 m absorption cell using a D2lamp as the light source. The resulting spectra together with fits using the known absorption cross sections (Sander et al., 2006; Selwyn et al., 1977) are dis-5
played in Fig. 1. Our fits give the percentage of N2O in the cylinder as (5.10±0.30)%
(95% confidence).
The possible impurities of the N2O/He cylinder were also checked by electron-impact
ionization mass-spectrometry, in which several mass spectra were taken as a function of electron energy to eliminate ions resulting from N2O fragmentation from the analy-10
sis. Here only trace amounts of NO and N2 were detected and their estimated mole fractions of less than 1×10⁻⁶were too small to significantly influence the kinetic mea-surements.
A typical 193 nm laser intensity for these experiments was 15 mJ cm−2. This intensity results in a fraction of C2H2dissociated as 0.0026 and a fraction of N2O dissociated as
15
0.0014. On average ca. 1×10¹² O(1D) cm−3 and ca. 4×10¹¹C2H cm −3
are produced per laser pulse.
The experimental setup is illustrated in Fig. 2. To enable a large range of temper-atures to be covered, two reaction vessels of entirely different construction were
con-nected in series, such that the photolysis laser beam was able to pass through both of 20
them at the same time.
The reactor on the left in Fig. 2 is made of a single tube of chemically-inert PFA (per-fluoroalkoxy) of internal diameter 10 mm and length 30 cm with a gas inlet and outlet. As connections to the single Spectrosil quartz window of the PFA reactor and for the gas inlet and pressure meter, PFA Swagelock “Tee” connectors were used (not shown). 25
This reactor was designed to cover the ranges from ca. 500 K to ca. 220 K. It is cooled or heated by fluid flowing in a closed circuit through a metallic jacket surrounding the PFA reactor tube. There is a quartz entrance window for the laser beam; the exit window is placed after passage through the second reactor volume. Interestingly, no
ACPD
8, 8881–8912, 2008Rate constant for the O(1D)+N
2O reaction and O(3P) yield
S. Vranckx et al.
Title Page
Abstract Introduction
Conclusions References
Tables Figures
◭ ◮
◭ ◮
Back Close
Full Screen / Esc
Printer-friendly Version
Interactive Discussion window for detection of the chemiluminescence is required for the PFA reactor: the PFA
tubing is partially transparent to the 431 nm chemiluminescence and according to our test does not significantly fluoresce at this wavelength on passage of the uv photolysis pulse. The chemiluminescence detection system comprises a lens, an interference filter (430±10 nm) and a photomultiplier tube that are placed close to the PFA reactor,
5
and arranged such that the chemiluminescence is detected at right-angles to the pas-sage of the laser beam. For this, the metallic cooling jacket exposes the PFA tube on one side for 3 cm at about 3/4 along its length. The cooling fluid was maintained at the correct temperature by a commercial temperature controller. Pressure in the reaction cell was determined using a calibrated capacitance manometer that was cross-checked 10
regularly with other calibrated pressure gauges. The pressure measurement point was located about 12 cm downstream of the chemiluminescence observation zone, using a second PFA Swagelock “Tee” connector (not shown) placed between the two reactors. At the flow rates used in this experiment there was negligible pressure drop between the observation point and the pressure-measurement point. Upstream of the reactor, 15
the separate flows of He, C2H2/He, and N2O/He, were combined in a small volume to
ensure complete mixing before entering the reactor.
The reactor on the right is a larger heatable stainless steel cell that has been used for many previous studies for C2H, OH, and CF2 reactions (Elsamra et al., 2005;
Kham-aganov et al., 2006; Dils et al., 2004). It can cover a temperature range of 290 K to 20
850 K. A glass window is used as exit window for the chemiluminescence, detected perpendicular to the axis of the laser beam. The interference filter, collection lens and PMT are mounted together on a translation stage such that they are easily moved be-tween the observation points of the two reaction cells, thus providing a very convenient way to directly compare rate constants at two different temperatures if need be.
25
ACPD
8, 8881–8912, 2008Rate constant for the O(1D)+N
2O reaction and O(3P) yield
S. Vranckx et al.
Title Page
Abstract Introduction
Conclusions References
Tables Figures
◭ ◮
◭ ◮
Back Close
Full Screen / Esc
Printer-friendly Version
Interactive Discussion
3 Results and discussion
3.1 Determination ofkR1(T)
Preliminary results revealed a very small O(3P) yield for the title reaction, in qualitative agreement with the previous studies mentioned above. Thus, under the conditions used for the rate constant determinations, the chemiluminescence decay profiles are 5
effectively single exponential at short times (t≤10µs) and represent the sum of the
decay rates of O(1D) and C2H only, with interference from any growth of O( 3
P) therefore negligible. In fact, even for reactions with substantial quenching to O(3P), the decay rate of O(1D) alone is in principle relatively easily extracted as described previously (Carl, 2005). Here though, the determination ofkR1 is more transparent as it involves
10
fitting to a single-exponential decay only.
A typical chemiluminescence time profile generated using our new method is dis-played in the log-linear plot of Fig. 3. The tail observed at long times results from O(3P) formation (see above), but does not affect the extraction of the O1D decay rate.
Here the total decay constant, neglecting the slow quenching of O(1D) by He, is given 15
by
k′ tot=k
′
O(1D)+k ′ C2H=
kC2H+C2H2+kO(1D)+C2H2
[C2H2]+
kC2H+N2O+kR1
[N2O] (3)
The solid line is a single-exponential fit to the data, neglecting the longer-time portion that includes chemiluminescence arising from a small fraction of O(3P) produced by quenching of O(1D).
20
Our recent detailed experimental and theoretical investigation of the C2H+N2O
reac-tion (manuscript in preparareac-tion) shows it to have a significant barrier and a low rate con-stant ranging from (an extrapolated)≈10−16cm3s−1at 300 K to ca. 1×10⁻¹³cm3s−1at 750 K. Thus, over the 300–750 K range, for the present experimental [N2O] of 1×1014cm−3
to 2.5×1015cm−3the removal rate of C2H by N2O is less than 0.1% of the removal rate
25
of O(1D) by N2O. Therefore, plots ofk ′
totversus [N2O] at constant [C2H2] should yield a
ACPD
8, 8881–8912, 2008Rate constant for the O(1D)+N
2O reaction and O(3P) yield
S. Vranckx et al.
Title Page
Abstract Introduction
Conclusions References
Tables Figures
◭ ◮
◭ ◮
Back Close
Full Screen / Esc
Printer-friendly Version
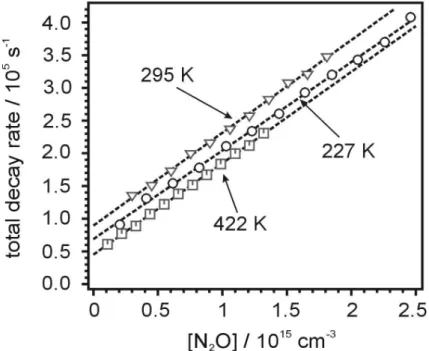
Interactive Discussion gradient equal tokR1. Figure 4 shows examples of suchkR1 determinations at 227 K,
298 K and 422 K. The ordinate intercepts correspond to the sums of the known removal rates of O(1D) and C2H by C2H2, with rate constants at 295 K of 3.08×10
−10
cm3s−1 and 1.3×10⁻¹⁰cm3s−1, respectively (Carl, 2005; Van Look and Peeters, 1995; Vakhtin, 2001). That ourkC2H+N
2Owas found to be very small at room temperature provides
ad-5
ditional support of the high purity of the N2O mixture used for the O(1D) experiments, given the general high reactivity of C2H, especially toward hydrocarbons.
The high precision of the data in the plots of Fig. 4 is typical of our chemilumines-cence method, which allows O(1D) removal rates of up to 450 000 s−1to be measured. Note that the data presented in this study, including those taken at room temperature, 10
were determined on four separate occasions over a period of several months and using two different reactors and different sets of calibrated flow controllers. Back-to-back runs
of rate constant determinations confirmed this high precision, with only±3% variation in rate constants from the mean.
The results of allkR1 rate constant determinations are given in Fig. 5, together with
15
the results of the most recent studies by other groups (Blitz et al., 2004; Dunlea and Ravishankara, 2004; Takahashi 2005). ThekR1 values are also listed in Table 1 along
with three columns of uncertainties. The first of these gives the 95% confidence limits in the fitted slopes for plots such as those given in Fig. 4 that are derived statistically from the weighted least-squares fitting procedure. For fitting a suitable function to the 20
data, the relative weights of the individual data points need to be estimated. The ran-dom uncertainties on individual determinations just mentioned (column 3 of Table 1) should not, in this case, be used as relative weighting factors, as this would imply, for example, that the confidence in the value at 227 K is a factor four greater than that at 447 K, whereas it is noted that the scatter of the data is greater than the random 25
ACPD
8, 8881–8912, 2008Rate constant for the O(1D)+N
2O reaction and O(3P) yield
S. Vranckx et al.
Title Page
Abstract Introduction
Conclusions References
Tables Figures
◭ ◮
◭ ◮
Back Close
Full Screen / Esc
Printer-friendly Version
Interactive Discussion an experiment, which is likely due mainly to uncertainties in flow controller
calibra-tions. To determine the average scatter of the data points we consider the data in the range 227 K to 447 K and assumek(T) it to be constant (this will tend to overestimate the scatter). Thus, the standard deviation, SD, is 0.045 cm3 s1. An estimate of the likely spread in the data at 95% confidence is ±2×SD=±0.090×10⁻¹⁰cm3 s−1. The
5
average contribution to this value of the uncertainties of individual determinations is (N/Σi(1/s2
i)) 0.5=
0.029, wheresI are the 95% confidence on individual determinations and N is the number of data points considered. Thus the contribution, at 95% con-fidence, of experiment repeatability to 2×SD is (0.0902−0.0292)0.5=0.085. This last
value is now propagated with the uncertainty of each data point (column 3, Table 1) 10
to give an estimate of the relative weights of the data. These are given in column 4 of Table 1 and also plotted as error bars in Fig. 5. Using these values as error bars is somewhat artificial since they have been derived partly from the data itself, however they do give a visual representation of the relative weights of the data points. Addi-tional to those random errors, is the systematic uncertainty of ca. 6% in the fracAddi-tional 15
concentration of N2O of our cylinder that was based on analysis of the results of our
absorption measurements. This uncertainty, which applies equally to all points with the same sign, affects only the absolute value of the whole set of rate constant data and
not their temperature dependence. It is statistically added to the overall errors at 95% confidence in the final column. These overall uncertainties cannot be used in a least-20
squares fitting procedure of the data. We estimate our confidence in temperature of the monitored reaction zone (at ca. 95% limits) to be±10 K at 719 K decreasing to±1 K at room temperature and then to increase again to 220 K to±5 K. Given the relatively
flat temperature profile of the rate constant data over 446 K to 227 K region, such un-certainties in temperature will make no significant contribution to the final unun-certainties 25
of the results.
All of our kR1 values below 450 K are significantly greater than the current
recom-mendation. Between 227 K and 446 K the determined values – twenty one in all – range from 1.28×10⁻¹⁰cm3s−1to 1.43×10⁻¹⁰cm3s−1(standard deviation of 0.05×10⁻¹⁰cm3s−1)
ACPD
8, 8881–8912, 2008Rate constant for the O(1D)+N
2O reaction and O(3P) yield
S. Vranckx et al.
Title Page
Abstract Introduction
Conclusions References
Tables Figures
◭ ◮
◭ ◮
Back Close
Full Screen / Esc
Printer-friendly Version
Interactive Discussion with a weighted mean of (1.37±0.02)×10−10cm3s−1 at 95% confidence (excluding
the uncertainty in [N2O]). That the rate constant shows a marked decrease beyond
450 K strongly suggests that, in the range 227 K to 446 K, it should either decrease slightly with increasing temperature or remain approximately constant. Since our data indicates a slight increase in kR1 over this range, we suggest a constant value of
5
(1.37±0.09)×10−10cm3s−1at 95%, which includes the 6% uncertainty in our N2O
frac-tion. These full confidence limits are plotted as dashed lines around the mean value in Fig. 5.
This value is in excellent agreement with the room temperature study of Takahashi et al. (2005) of (1.35±0.06)×10−10cm3s−1 as well as the average of all determina-10
tions (beside those at room temperature, as discussed in the Introduction) by Dunlea and Ravishankara (2004) of (1.34±0.04)×10−10cm3s−1. The results of recent
deter-minations of rate constant for O(1D)+N2O by other groups is also given in tabular form
(Table 2).
The rate constants determined in this work decrease markedly beyond about 450 K. 15
This effect is not unusual if the so-called “bottle-neck structure” is located on a purely
attractive entrance part of the potential energy surface. Conservation of the rotational quantum numberJ during the reaction means that the amount of energy available for random distribution amongst all other modes changes as the reactants approach one another. The bottle-neck structure is the structure (or point on the potential energy hy-20
persurface) that has a minimum number of states, counted from the zero-point energy to total available randomizable energy for that structure. As the reactants approach and the overall moment of inertia decreases, the energy associated with J, EJ, in-creases leading to proportionally less energy available for randomization. The total available randomizable energy (and therefore the number of states) depends therefore 25
both on the shape of the potential energy surface and on how EJ changes over the surface. The first is independent of temperature whereas the latter is temperature de-pendent. At higher temperatures, the differences inEJ over the surface become more
ACPD
8, 8881–8912, 2008Rate constant for the O(1D)+N
2O reaction and O(3P) yield
S. Vranckx et al.
Title Page
Abstract Introduction
Conclusions References
Tables Figures
◭ ◮
◭ ◮
Back Close
Full Screen / Esc
Printer-friendly Version
Interactive Discussion temperature – has proportionally fewer available randomizable states. This leads to a
decrease in rate constant with increasing temperature.
A similar effect can be caused by partial re-dissociation of an initially-formed reaction
complex. In this case there is an increased propensity to re-dissociate to reactants over the entrance-channel transition state rather than undergo transformation via a second 5
transition state (that can lie lower in energy than the reactants) leading to reactants.
3.2 Determination of the O(3P) yield
For the accurate interpretation of O(3P) yields from Reaction (R1), sources of potential interferences need to be considered. The first of these is direct production of O(3P) from the 193 nm photo-dissociation of N2O. The quantum yield for this process had 10
been recently determined by Nishida et al. (2004) asΦO
(3P)=0.005±0.002. Thus, from
this process alone, our uncertainty in the determined O(3P) yield from Reaction (R1) would be±0.002.
Note that O2or N2impurities, e.g. from air leaks, could affect the results by
chemilu-minescence via C2H+O2→CH(A)+CO2(Elsamra et al., 2005) or by O(1D→3P)
quench-15
ing. It was duly ascertained in this work that the O2 and N2 traces were so small as
to have an entirely negligible effect. We must now conclude that the anomalously high
quenching fraction value of 0.056 reported in the earlier investigation of this labora-tory by Carl (2005) was most likely due to a very small air leak in the reactor, whose influence may have been amplified due to its proximity to the chemiluminescence ob-20
servation zone.
The general equation for the chemiluminescence decay profile is (Carl, 2005)
Ichem =B[C2H]t
h
O1Di
t +
h
O3Pi
t kR2/kR3
(4)
h
O1Di
t
=hO1Di
0exp(−k ′
O(1D)t) (5)
ACPD
8, 8881–8912, 2008Rate constant for the O(1D)+N
2O reaction and O(3P) yield
S. Vranckx et al.
Title Page
Abstract Introduction
Conclusions References
Tables Figures
◭ ◮
◭ ◮
Back Close
Full Screen / Esc
Printer-friendly Version
Interactive Discussion
k′
O(1D)=kO(1D)+C2H2[C2H2]+kO(1D)+N2O[N2O]+kO(1D)+N2[N2]+kO(1D)+He[He] (6)
[C2H]t =[C2H]0exp(−k ′
C2Ht) (7)
k′
C2H=kC2H+C2H2[C2H2]+kC2H+N2O[N2O] (8)
O(3P) production via O(1D) reaction or via quenching by C2H2, N2O, N2, and He, to-gether with instantaneous O(3P) formation via N2O photolysis leads to the expression
5
h
O3Pi
t
=hO1Di 0
0.005+
kP′ k′
O(1D)
1−exp(−k′
O(1D)t)
(9)
k′
p= kO(1D)+C2H2[C2H2]QC2H2 +kO
(1D)+N2O[N2O]QN2O+kO(1D)+N2[N2]+kO(1D)+He[He] (10)
withQx the fractional yield of O( 3
P) from the reaction O(1D)+X; Qx=1 forX=N2, and
He. 10
The ratiokR2(T)/kR3(T) was experimentally determined using our new detection method
for O(1D) and O(3P). An absolute determination of either kR2 or kR3 as a function of
temperature was not possible here because the absorption cross-section of the oxygen atom precursor, N2O, is not accurately known as a function of the temperature.
How-ever, it was possible to determine their ratio, as described in the experimental section. 15
Thus, the ratio of initial chemiluminescence intensities, one taken with buffer gas He
that does not contribute to any O(1D→3P) quenching, and the other with buffer gas N2
that rapidly quenches all initial O(1D) to O(3P), is given by
Ichem(He)t→0 Ichem(N2)t→0
= kR2 kR3
ACPD
8, 8881–8912, 2008Rate constant for the O(1D)+N
2O reaction and O(3P) yield
S. Vranckx et al.
Title Page
Abstract Introduction
Conclusions References
Tables Figures
◭ ◮
◭ ◮
Back Close
Full Screen / Esc
Printer-friendly Version
Interactive Discussion neglecting the small fraction of O(3P) produced directly by N2O photolysis (Nishida et
al., 2004).
Since all experiments to determinekR2(T)/kR3(T) were performed with identical
total-and partial flow rates, at the same pressure, total-and using the same photolysis energy, the concentrations of C2H2 and N2O scale each as 1/T. Thus the chemiluminescence
5
signal would scale as 1/T2 if kR2 or kR3 were independent of temperature. For
in-creased accuracy, rather than the ratiokR3/kR2 being determined at each temperature, kR3(T) and kR2(T) were determined separately and then kR3/kR2 was accurately
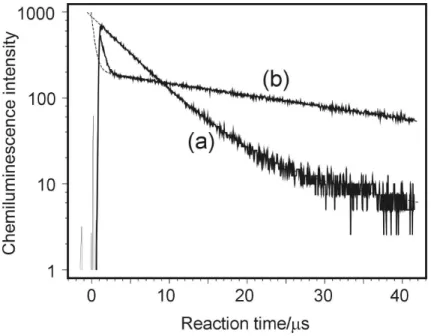
de-termined at 295 K. An example of temporal chemiluminescence profiles with He buffer
gas and with N2 buffer gas is given in Fig. 6. Profile (a) with He has a time
depen-10
dence governed by both [C2H] and [O( 1
D] and an intensity essentially proportional to k3(C2H+O(
1
D)→CH(A)+CO) whereas profile (b) has a time profile governed by
[C2H] only and an intensity proportional to kR2(C2H+O( 3
P)→CH(A)+CO) except at
short times where O(1D) quenching occurs. Plots ofIchem(He or N2)t→0×T 2
versusT, are given in Fig. 6. The ratio of the fittedIchem,t→0 of each set of experiments gives
15
then the ratio of the two rate coefficients as a function of temperature. kR2(T)
kR3(T)
= 32.8T −3050
6.29T +398 (12)
In fact the temperature dependence given by the denominator, which is the sum of the
Tdependence ofk3and theT dependence ofσ(N2O) at 193 nm (assumingΦ(O 1
D)=1)
is quite similar to that found by Devriendt et al. (1996) for theT dependence ofk3alone.
20
This indicates thatσ(N2O) changes by a factor 1.5 at most between 300 K and 800 K.
For the O(3P) yield determinations, a typical decay profile is given in Fig. 7. One can immediately see that the chemiluminescence signal due to O(1D) is at least a factor 100 greater than that due to O(3P). This immediately suggests an O(3P) yield of 0.03 at most, bearing in mind the thatkR3/kR2=3.0 at room temperature and that reaction
25
with N2O is the dominant O( 1
D) removal process. Also shown is the best fit to the data as well as three simulations. The flexible parameters in the fit equations are the total
ACPD
8, 8881–8912, 2008Rate constant for the O(1D)+N
2O reaction and O(3P) yield
S. Vranckx et al.
Title Page
Abstract Introduction
Conclusions References
Tables Figures
◭ ◮
◭ ◮
Back Close
Full Screen / Esc
Printer-friendly Version
Interactive Discussion first-order removal rate of [O(1D)],k′
O1D, the total first-order removal rate for C2H,k ′ C2H,
the scaling factorB, and the fractional yield of O(3P) from Reaction (R1),QN2O, i.e. the
value to be determined. The other parameters are fixed to their measured values, all of which are given above.
Importantly, the removal rateskO1D′ of O(1D) andkC′
2Hof C2H found through fitting the
5
decays are to within a few percent equal to the values calculated from the experimental concentrations and known rate coefficients.1 Note also, that under the conditions of
these sets of experiments the O(1D) removal rate is determined almost uniquely by the title reaction, such that the determined O(3P) yield from the fit to the chemilumines-cence decay profile is quasi-insensitive to the values of the other parameters.
10
The results of all determinations of the O(3P) yield from the title reaction, such as the one given in Fig. 7, are summarized in Fig. 8 together with the results of earlier studies of Wine and Ravishankara (1982) and Nishida et al. (2004).
The results clearly show the yield of O(3P) to be less than 0.01 over the temperature range 550 K to 250 K, slightly decreasing with decreasing temperature. At the lowest 15
temperature of ca. 250 K an upper limit for the O(3P) yield of 0.002 could be estab-lished. Channel (1c) therefore need not be taken into consideration in stratospheric chemistry models.
The overall impact of the study related here has been firstly to provide a set of
kR1(T) data that taken with that of Dunlea and Ravishakara (excepting their
anoma-20
lously low 298 K data) and of Takahishi et al. (2005) – all performed using different
methods for O(1D) detection – is to substantially reduce the uncertainty in the
over-1
The rate constant for O(1D)+N
2was taken from Blitz et al. (2004), that for O( 1
D)+N
2O was
taken from this work, and that for O(1D)+C
2H2was taken from Carl (2005) and assumed to be
independent of temperature. The rate constant for C2H+N
2O is taken from recent, unpublished,
ACPD
8, 8881–8912, 2008Rate constant for the O(1D)+N
2O reaction and O(3P) yield
S. Vranckx et al.
Title Page
Abstract Introduction
Conclusions References
Tables Figures
◭ ◮
◭ ◮
Back Close
Full Screen / Esc
Printer-friendly Version
Interactive Discussion all rate constant for this reaction, and to significantly increase its best estimate, to be
used in atmospheric chemistry models. The impact of our recommended values on modeling calculations naturally depends on values currently adopted for a particular model. At one extreme, models that rely on the JPL/NASA recommendations prior to 2006 with an overallT-independent rate constantkR1=1.16×10
−10
cm3s−1, that in-5
terpret the branching of 0.60 askR1d/(kR1e+kR1f+kR1g), and not kR1d/kR1, and then
consider an additional reduction of k1d by 4% due to channel (1c), as discussed by
Nishida et al. (2004), effectively use a value for the NO channel kR1d of 1.16×0.60
(1–0.04)=6.7×10⁻¹¹cm3s−1. On the other hand the 2006 recommendation (Sander et al., 2006) ofkR1d=6.7×10
−11
exp(20/T) gives a rate constant of 7.3×10⁻¹¹cm3s−1 at
10
220 K. The IUPAC recommendation (Atkinson et al., 2004) forkR1dis 7.2×10 −11
cm3s−1, independent of temperature. If we also adopt a branching ratio kR1d/kR1=0.60, the
present study results in a value for kR1d of 8.3×10 −11
cm3s−1 at 220 K, which repre-sents significant increases of ca. 15% over the last two values and of 24% over the first.
15
4 Conclusions
We have determined the rate coefficientkR1 of the reaction O(1D)+N2O over the wide
temperature range 227 K–719 K using a new and highly sensitive technique for mon-itoring O(1D), that provides a high kR1(T) measurement precision. We have firmly established that the rate constant has negligible temperature dependence over atmo-20
spheric temperature ranges, but shows a pronounced negative temperature depen-dence forT >450 K. OurkR1(T) data are significantly higher than the current JPL/NASA recommendations. At stratospheric temperatures, at which the title reaction is most im-portant, our rate constant is about 15% above the current recommendation. We have also determined that the minor channel leading to O(1D→3P) quenching is entirely
25
negligible at all atmospheric temperatures.
ACPD
8, 8881–8912, 2008Rate constant for the O(1D)+N
2O reaction and O(3P) yield
S. Vranckx et al.
Title Page
Abstract Introduction
Conclusions References
Tables Figures
◭ ◮
◭ ◮
Back Close
Full Screen / Esc
Printer-friendly Version
Interactive Discussion Acknowledgements. S. Vranckx gratefully acknowledges financial support of the Institute for
the Promotion of Innovation through Science and Technology in Flanders (IWT-Vlaanderen) in the form of a Ph.D. grant.
References
Amimoto, S. T., Force, A. P., Gulotty Jr., R. G., and Wiesenfeld, J. R.: Collisional deactivation
5
of O(1D2) by the atmospheric gases, J. Chem. Phys., 71, 3640–3647, 1979.
Atkinson, R., Baulch, D. L., Cox, R. A., Crowley, J. N., Hampson, R. F., Hynes, R. G., Jenkin, M. E., Rossi, M. J., and Troe, J.: Evaluated kinetic and photochemical data for atmospheric chemistry: Volume I – gas phase reactions of Ox, HOx, NOxand SOxspecies, Atmos. Chem. Phys., 4, 1461–1738, 2004,
10
http://www.atmos-chem-phys.net/4/1461/2004/.
Bhardwaj, A. and Haider, S. A.: Chemistry of O1D atoms in the coma: implications for cometary missions, Adv. Space Res., 29, 745–750, 2002.
Blitz, M. A., Dillon, T. J., Heard, D. E., Pilling, M. J., and Trought, I. D.: Laser induced fluores-cence studies of the reactions of O(1D2) with N2, O2, N2O, CH4, H2, CO2, Ar, Kr and n-C4H10,
15
Phys. Chem. Chem. Phys., 6, 2162–2171, 2004.
Cantrell, C. A., Shetter R. E., and Calvert, J. G.: Branching ratios for the O(1D)+N2O reaction, J. Geophys. Res., 99, 3739–3743, 1994.
Carl, S. A.: A highly sensitive method for time-resolved detection of O(1D) applied to precise de-termination of absolute O(1D) reaction rate constants and O(3P) yields, Phys. Chem. Chem.
20
Phys., 7, 4051–4053, 2005.
Crutzen, P. J.: Ozone production rates in an oxygen-hydrogen-nitrogen oxide atmosphere, J. Geophys. Res., 76, 7311–7327, 1971.
Davidson, J. A., Howard, C. J., Schiff, H. I., and Fehsenfeld, F. C.: Measurement of the branch-ing ratios for the reaction of O(1D2) with N2O, J. Chem. Phys., 70, 1697–1704, 1979.
25
Devriendt, K., Van Look, H., Ceursters, B., and Peeters, J.: Kinetics of formation of chemilu-minescent CH(A2∆) by the elementary reactions of C2H(X2Σ+) with O(3P) and O2(X3Σ−g): A pulse laser photolysis study, Chem. Phys. Lett., 261, 450–456, 1996.
ACPD
8, 8881–8912, 2008Rate constant for the O(1D)+N
2O reaction and O(3P) yield
S. Vranckx et al.
Title Page
Abstract Introduction
Conclusions References
Tables Figures
◭ ◮
◭ ◮
Back Close
Full Screen / Esc
Printer-friendly Version
Interactive Discussion of CF2(a3B1) with C3H8, C3H6, iso-C4H8 and C3H4 between 295 and 550 K, Phys. Chem.
Chem. Phys., 6, 2211–2215 , 2004.
Dunlea E. J. and Ravishankara, A. R.: Kinetic studies of the reactions of O(1D) with several atmospheric molecules, Phys. Chem. Chem. Phys. 6, 2152–2161, 2004.
Elsamra, R. M. I., Vranckx, S., and Carl, S. A.: CH(A2∆) formation in hydrocarbon
combus-5
tion: The temperature dependence of the rate constant of the reaction C2H + O2 →
CH(A2∆)+CO2, J. Phys. Chem. A., 109, 10 287–10 293, 2005.
Heidner, R. F., Wiesen Jr., F. E., and Husain, D.: Kinetic study of electronically excited oxygen atoms, O(21D2), by time-resolved atomic absorption spectroscopy in the vacuum ultra-violet (λ=115.2 nm, O(31D0
2←2 1
D2)), Chem. Phys. Lett., 16, 530–533, 1972.
10
Kaspar, T., Tuan, A., Tonkyn, R., Hess, W. P., Rogers, J. W., and Ono, Y. J.: Role of O1D in the oxidation of Si(100), Vac. Sci. Technol. B, 21b, 895–899, 2003, and references therein. Khamaganov, V. G., Bui,V. X., Carl, S. A., and Peeters, J.: Absolute rate coefficient of the OH
+CH3C(O)OH reaction atT=287–802 K. The two faces of pre-reactive H-bonding, J Phys. Chem A, 110, 12 852–12 859, 2006.
15
Kharchenko, V. and Dalgarno, A.: Thermalization of fast O(1D) atoms in the stratosphere and mesosphere, J. Geophys. Res.-Atoms., 109, D18311, doi:10.1029/2003JD004071, 2004. Luque, J. and Crosley, D. R.: Electronic transition moment and rotational transition probabilities
in CH. 1. A2∆-X2Πsystem, J. Chem. Phys., 104, 2146–2155, 1996.
Nair, H., Summers, M. E., Miller, C. E., and Yung, Y. L.: Isotopic fractionation of methane in the
20
martian atmosphere, Icarus, 175, 32–35, 2005.
Nishida, S., Takahashi, K., Matsumi, Y., Taniguchi, N., and Hayashida, S. J.: Formation of O(3P) atoms in the photolysis of N2O at 193 nm and O(3P)+N
2O product channel in the reaction
of O(1D)+N2O, Phys. Chem. A, 108, 2451–2456, 2004.
Sander, S. P., Friedl, R. R., Ravishankara, A. R., Golden, D. M., Kolb, C. E., Kurylo, M. J.,
25
Molina, M. J., Moortgat, G. K., Keller-Rudek, H., Finlayson-Pitts, B. J., Wine, P. H., Huie, R. E., and Orkin, V. L.: Chemical Kinetics and Photochemical Data for Use in Atmospheric Stud-ies, Evaluation Number 15, JPL Publication 06-2, National Aeronautics and Space Admin-istration, Jet Propulsion Laboratory, California Institute of Technology, Pasadena, California, July 10, 2006.
30
Selwyn, G., Podolske, J., and Johnston, H. S.: Nitrous-oxide ultraviolet-absorption spectrum at stratospheric temperatures, Geophys. Res. Lett., 4, 427–430, 1977.
ACPD
8, 8881–8912, 2008Rate constant for the O(1D)+N
2O reaction and O(3P) yield
S. Vranckx et al.
Title Page
Abstract Introduction
Conclusions References
Tables Figures
◭ ◮
◭ ◮
Back Close
Full Screen / Esc
Printer-friendly Version
Interactive Discussion Takahashi, K., Takeuchi, Y., and Matsumi,Y.: Rate constants of the O(1D) reactions with N2,
O2, N2O, and H2O at 295 K, Chem. Phys. Lett., 410, 196–200, 2005.
Tamura, M., Berg, P. A., Harrington, J. E., Luque, J., Jeffries, B., Smith, G. P., and Crosley, D. R.: Collisional quenching of CH(A), OH(A), and NO(A) in low pressure hydrocarbon flames, Combust. Flame, 114, 502–514, 1998.
5
Vakhtin, A. B., Heard, D. E., Smith, I. W. M., and Leone, S. R.: Kinetics of reactions of C2H radical with acetylene, O2, methylacetylene, and allene in a pulsed Laval nozzle apparatus at T=103 K, Chem. Phys. Lett., 344, 317–324, 2001.
Van Look, H. and Peeters, J.: Rate coefficients of the reactions of C
2H with O2, C2H2, and H2O
between 295 and 450 K, J. Phys. Chem., 99, 16 284–16 289, 1995.
10
Wine, P. H. and Ravishankara, A. R.: Kinetics of the O(1D) interactions with the atmopsheric gases N2, N2O, H2O, H2, CO2, and O3, Chem. Phys. Lett., 77, 103–109, 1981.
ACPD
8, 8881–8912, 2008Rate constant for the O(1D)+N
2O reaction and O(3P) yield
S. Vranckx et al.
Title Page
Abstract Introduction
Conclusions References
Tables Figures
◭ ◮
◭ ◮
Back Close
Full Screen / Esc
Printer-friendly Version
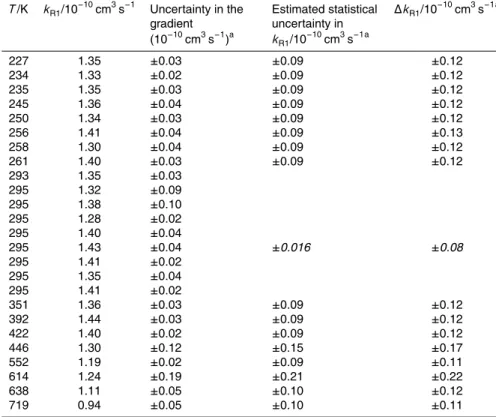
Interactive Discussion Table 1.Summary of rate constant determinations for O(1D)+N2O of this work.
T/K kR1/10
−10cm3s−1 Uncertainty in the gradient
(10−10cm3s−1)a
Estimated statistical uncertainty in kR1/10
−10cm3s−1a ∆k
R1/10
−10cm3s−1a
227 1.35 ±0.03 ±0.09 ±0.12 234 1.33 ±0.02 ±0.09 ±0.12 235 1.35 ±0.03 ±0.09 ±0.12 245 1.36 ±0.04 ±0.09 ±0.12 250 1.34 ±0.03 ±0.09 ±0.12 256 1.41 ±0.04 ±0.09 ±0.13 258 1.30 ±0.04 ±0.09 ±0.12 261 1.40 ±0.03 ±0.09 ±0.12 293 1.35 ±0.03
±0.016 ±0.08
295 1.32 ±0.09 295 1.38 ±0.10 295 1.28 ±0.02 295 1.40 ±0.04 295 1.43 ±0.04 295 1.41 ±0.02 295 1.35 ±0.04 295 1.41 ±0.02
351 1.36 ±0.03 ±0.09 ±0.12 392 1.44 ±0.03 ±0.09 ±0.12 422 1.40 ±0.02 ±0.09 ±0.12 446 1.30 ±0.12 ±0.15 ±0.17 552 1.19 ±0.02 ±0.09 ±0.11 614 1.24 ±0.19 ±0.21 ±0.22 638 1.11 ±0.05 ±0.10 ±0.12 719 0.94 ±0.05 ±0.10 ±0.11
a
Column 3 gives the uncertainties at 95% confidence in the slope of the corresponding plot of O(1D) removal rate versus [N2O] concentration. Column 4 gives the expected total random error ofkat each temperature. Column 5 gives the estimated total uncertainty ink, which includes the systematic uncertainty on the N2O concentration (identical for all data). The values in italics in columns 4 and 5 for the room-temperature data are the 95% confidence limits in the mean value.
ACPD
8, 8881–8912, 2008Rate constant for the O(1D)+N
2O reaction and O(3P) yield
S. Vranckx et al.
Title Page
Abstract Introduction
Conclusions References
Tables Figures
◭ ◮
◭ ◮
Back Close
Full Screen / Esc
Printer-friendly Version
Interactive Discussion Table 2. Summary of recent determinations of the rate constant for O(1D)+N2O by others
groups. The first three are plotted in Fig. 5.
T/K Dunlea and Ravishankara (2004) Blitz et al. (2004) Takahashi et al. (2005) Amimoto et al. (1979)
195 1.13±0.08 220 1.27±0.11
220 1.49±0.08 235 1.35±0.08 250 1.41±0.15 250 1.43±0.13 265 1.31±0.14 265 1.36±0.09 280 1.46±0.10 280 1.45±0.10
295 1.21±0.04a 1.07±0.10b 1.35±0.08 1.2±0.1 320 1.40±0.11
320 1.36±0.09 345 1.19±0.07 345 1.37±0.09 370 1.31±0.14 370 1.28±0.06
a
Weighted average of fifteen determinations.
b
ACPD
8, 8881–8912, 2008Rate constant for the O(1D)+N
2O reaction and O(3P) yield
S. Vranckx et al.
Title Page
Abstract Introduction
Conclusions References
Tables Figures
◭ ◮
◭ ◮
Back Close
Full Screen / Esc
Printer-friendly Version
Interactive Discussion Fig. 1. Spectra of mixtures of 5% N2O in He taken in a single-pass absorption cell of 1.2 m
length at three different total pressures. The fit to the data is based on the total cell pressure, the room temperature absorption cross-section of N2O and the fractional concentration of N2O, which is the variable in the fit.
ACPD
8, 8881–8912, 2008Rate constant for the O(1D)+N
2O reaction and O(3P) yield
S. Vranckx et al.
Title Page
Abstract Introduction
Conclusions References
Tables Figures
◭ ◮
◭ ◮
Back Close
Full Screen / Esc
Printer-friendly Version
Interactive Discussion Fig. 2.Experimental apparatus showing the coupled low- and high-temperature reaction cells
ACPD
8, 8881–8912, 2008Rate constant for the O(1D)+N
2O reaction and O(3P) yield
S. Vranckx et al.
Title Page
Abstract Introduction
Conclusions References
Tables Figures
◭ ◮
◭ ◮
Back Close
Full Screen / Esc
Printer-friendly Version
Interactive Discussion Fig. 3. A typical chemiluminescence decay profile observed following 193 nm photolysis of
C2H2/N2O/He mixtures at 10 Torr total pressure. The decay rate represents the sum of decay rates of C2H and O(1D). The small “tail” visible after ca. 17µs is indicative of O(3P) formation from channel (R1c) or directly from N2O photolysis. The exponential fit was performed over the range 1µs to 20µs in this case.
ACPD
8, 8881–8912, 2008Rate constant for the O(1D)+N
2O reaction and O(3P) yield
S. Vranckx et al.
Title Page
Abstract Introduction
Conclusions References
Tables Figures
◭ ◮
◭ ◮
Back Close
Full Screen / Esc
Printer-friendly Version
Interactive Discussion Fig. 4. The total decay rates as a function of N2O concentration. Conditions for 227 K:
[C2H2]∼=1.0×1014cm−3, N2O concentrations range from 2.05×10¹⁴ to 2.46×1015cm−3, re-sult: kR1=(1.35±0.03)×10−10cm3s−1. Conditions for 295 K: [C2H2]=1.5×1014cm−3, to-tal pressure 10 Torr He and [N2O] ranges from 3.0×1014cm−3 to 1.82×1015cm−3, re-sult: k1=(1.40±0.04)×10
−10
cm3s−1. Conditions for 422 K: [C2H2]=5.5×1013cm−3, total pressure 10 Torr He and [N2O] ranges from 1.10×1014cm−3 to 1.32×1015cm−3, result:
k1=(1.40±0.02)×10 −10
ACPD
8, 8881–8912, 2008Rate constant for the O(1D)+N
2O reaction and O(3P) yield
S. Vranckx et al.
Title Page
Abstract Introduction
Conclusions References
Tables Figures
◭ ◮
◭ ◮
Back Close
Full Screen / Esc
Printer-friendly Version
Interactive Discussion Fig. 5. Summary of the results obtained for k1 plotted as a function of temperature together
with the three most recent results of Blitz et al. (2004), Dunlea and Ravishankara, (2004) and Takahashi et al. (2005). The dotted line through the middle of the graph and the outer dotted lines represent the current JPL/NASA recommendation and its ca. 95% uncertainty limits, re-spectively. The inner lines represent the best fit to our data between 227 K and 446 K assuming aT-independentkR1 and 95% confidence limits that includes the 6% uncertainty in the N2O
fraction. The plot on the right better shows individual room-temperature determinations of this work and those from the most recent studies by other groups.
ACPD
8, 8881–8912, 2008Rate constant for the O(1D)+N
2O reaction and O(3P) yield
S. Vranckx et al.
Title Page
Abstract Introduction
Conclusions References
Tables Figures
◭ ◮
◭ ◮
Back Close
Full Screen / Esc
Printer-friendly Version
Interactive Discussion Fig. 6. An example of the change in chemiluminescence decay profile on addition of N2
ACPD
8, 8881–8912, 2008Rate constant for the O(1D)+N
2O reaction and O(3P) yield
S. Vranckx et al.
Title Page
Abstract Introduction
Conclusions References
Tables Figures
◭ ◮
◭ ◮
Back Close
Full Screen / Esc
Printer-friendly Version
Interactive Discussion Fig. 7. The relative chemiluminescence intensity att=0 (extrapolated from the total decay)
multiplied byT2. Conditions: [N2O]=7.44×1014cm−3×T/298, [C2H2]=1.49×1014cm−3×T/298, total pressure 2 Torr He for C2H+O(1D), 2 Torr N
2for C2H+O( 3
P),T varies from 298 K to 797 K.
ACPD
8, 8881–8912, 2008Rate constant for the O(1D)+N
2O reaction and O(3P) yield
S. Vranckx et al.
Title Page
Abstract Introduction
Conclusions References
Tables Figures
◭ ◮
◭ ◮
Back Close
Full Screen / Esc
Printer-friendly Version
Interactive Discussion Fig. 8. O(3P) yield investigations. CH(A→X) emission profile for the following from
CH(A) formed through C2H+O(1D) and C2H + O(3P). Conditions: [N2O]=3.21×1015cm−3, [C2H2]=6.96×1013cm−3, total pressure 10 Torr He, 247 K. The solid line is the best fit of the function of Eq. (7) to the decay. In this case the adjustable parameter
QN
2O(=kR1c/kR1)=0.02±0.02. Also plotted are simulated curves forQN2O=0.01, 0.02, and 0.04. Note thatQN
ACPD
8, 8881–8912, 2008Rate constant for the O(1D)+N
2O reaction and O(3P) yield
S. Vranckx et al.
Title Page
Abstract Introduction
Conclusions References
Tables Figures
◭ ◮
◭ ◮
Back Close
Full Screen / Esc
Printer-friendly Version
Interactive Discussion Fig. 9. Summary of the results of the determinations ofkR1c/kR1. All error bars indicate 95%
confidence.