FOREIGN INVESTMENT STYLES AND RETURNS IN
PORTUGAL’S REAL ESTATE MARKET
Leonor Silva Garcia Ramos de Carvalho
Dissertation submitted as partial requirement for the conferral of Master in Finance
Supervisor:
Prof. Rui Alpalhão, Visiting Associate Professor, ISCTE Business School, Finance Department
ACKNOWLEDGEMENTS
In the first place, I dedicate this thesis to the ones that, somehow, facilitated the accomplishment of this project. The development of this dissertation was one of the most challenging projects that I concretize during my academic journey. It is necessary a great willingness, hard work and sacrifice to finish this work and sometimes it is easy to lose courage. This way, I could not thank to the people that helped going through this journey.
Primarily, I would like to thank to my supervisor, Professor Rui Alpalhão, for all is help and motivation, but also for his involvement in this work that were an important support during these months.
Lastly, to acknowledge the support from my parents, brother and grandparents, that never let me gave up and encourage me every day to overcome this challenge. Last but not least, a big thank you to my friend Mariana Cabrita, that motivated me and accompanied each step of this journey.
ABSTRACT
The current context of Portugal’s real estate market has become a phenomenon of great interest, which leads to the need to study some of its specificities. In fact, the market is facing an outstanding performance and foreign investors are increasing their interest in investing in properties all over Portugal. Thus, it is important to analyze what are these investors looking for and what can be done so that this positive environment can continue. For this matter, the study of investment styles arises as way to understand the profile of foreign investors.
The idea of real estate as an asset has become more global and the study of investment styles will help defining new guidelines for the real estate market, so that the needs of foreign investors can meet what Portugal’s market has to offer. Consequently, the aim of the thesis is to identify the different investment styles of foreign investors in Portugal’s real estate market and discuss whether the weight of the various style impacts, or not, the market returns. It is also analyzed if the variation of volume of transaction changes the investment styles.
The results demonstrate that the two key players in Portugal’s real estate market were core and value added investors. It is also concluded that there is no strong correlation between investment styles and market returns. Relatively to the volume of transactions, the results suggest that it is catalyzed by opportunistic investors meaning that they are the responsible for the growth of the market.
Key words: Real Estate, Investment Styles, Foreign Investment, Returns
RESUMO
O atual contexto do mercado imobiliário em Portugal tem se tornado um fenómeno de grande interesse, o que o torna um importante objeto de estudo do qual é necessário avaliar algumas das suas especificidades. De facto, o mercado evidencia uma performance excepcional e o interesse de investidores estrangeiros em propriedades em todo o país tem aumentado. Desta forma, é importante analisar o que estão estes investidores à procura e o que pode ser feito para que esta positiva evolução possa continuar. Consequentemente, o estudo dos estilos de investimento surge como uma forma de perceber o perfil destes investidores estrangeiros. A ideia de imobiliário como uma classe de ativos tem se tornado cada mais global e o estudo dos estilos de investimento ajuda a definir diretrizes para o mercado, para que as necessidades dos investidores estrangeiros possam ser satisfeitas pela oferta no mercado imobiliário português. Por conseguinte, esta dissertação tem como objetivo identificar os diferentes estilos de investimento estrangeiros em Portugal e discutir se o peso de cada estilo tem impacto, ou não, nos retornos do mercado.
Os resultados demonstram que os dois principais intervenientes no mercado imobiliário português são investidores core e de valor acrescentado. Conclui-se também que não há uma forte correlação entre os estilos de investimento e os retornos de mercado. Relativamente ao volume de transações, os resultados sugerem que este é catalisado por investidores oportunistas, o que significa que eles são os principais responsáveis pelo crescimento do mercado.
Palavras chave: Mercado Imobiliário, Estilos de Investimento, Investimento Estrangeiro,
Retornos
INDEX
INDEX OF TABLES ... vii
INDEX OF FIGURES ... vii
GLOSSARY ... viii
1. INTRODUCTION ... 1
2. LITERATURE REVIEW ... 1
2.1. Real Estate as an Asset ... 3
2.2. Real Estate Investment Styles ... 7
2.2.1. Definition ... 7
2.2.2. Purposes of Investment Styles ... 7
2.2.3. Why Real Estate Investment Styles ... 8
2.2.4. Real Estate Investment Styles Factors ... 9
2.2.5. Investment Styles: Core, Value Added and Opportunistic ... 10
2.3. Determinants of International Real Estate Investment ... 14
2.4. Portugal’s Real Estate Market ... 16
2.4.1. Economic Environment ... 16
2.4.2. Industrial Market ... 17
2.4.3. Office Market ... 18
2.4.4. Residential Market ... 20
2.4.5. Retail Market ... 22
3. DATA AND METHODOLOGY ... 24
3.1. Data ... 24
3.2. Methodology ... 25
4. RESULTS ... 29
4.1. Relationship between the volume of transactions and investment styles... 29
4.2. Relationship between average yields and investment styles ... 32
5. CONCLUSIONS ... 34
7. ANNEXES ... 39
INDEX OF TABLES
Table 1 - Returns and Risk-Adjusted Returns for Major Asset Classes (1987-2004) ... 5
Table 2 – Core Investment Style ... 11
Table 3 – Value Added Investment Style ... 12
Table 4 - Opportunistic Investment Style ... 13
Table 5 - State of development ... 26
Table 6 – Location ... 26
Table 7 – Occupancy levels ... 28
Table 8 - Ownership control ... 28
Table 9 – Correlation matrix between volume of transaction of investment styles... 31
Table 10 – Correlation matrix between total average yield and investment styles ... 33
INDEX OF FIGURES Figure 1 - United States inflation versus Commercial Real Estate total return ... 4
Figure 2 - Evolution of GDP composition (in %) ... 16
Figure 3 - Evolution of CPI excluding energy goods ... 17
Figure 4 – Unemployment rate (in %) ... 17
Figure 5 – Industrial sector indicators (Confidence indicator in annual average) ... 18
Figure 6 – Occupation of Logistics Warehouses ... 18
Figure 7 – Office take-up evolution ... 19
Figure 8 – New office supply... 20
Figure 9 – Homes Supply in Lisbon and Porto ... 20
Figure 10 – Residential market values ... 21
Figure 11 – Number of homes sold... 21
Figure 12 – Evolution of Retail Developments Supply ... 22
Figure 13 – Evolution of prime rents (in €) ... 23
Figure 14 - Volume of Real Estate Investment ... 27
Figure 15 - Lisbon industrial market geography... 27
Figure 16 – Lisbon office market geography ... 27
Figure 17 – Relationship between volume of transaction and investment styles ... 29
Figure 18 – Investment by type of property... 30
Figure 19 – Correlation between Office Take up and Unemployment Rate ... 31
GLOSSARY
CBD - Central Business District CBRE – CB Richard Ellis
CPI – Consumer Price Index
CRE – Commercial Real Estate
GDP – Gross Domestic Product
INE – Instituto Nacional de Estatistica
INREV – European Association of Investors in Non-Listed Real Estate Vehicles
JLL – Jones Lang LaSalle
NCREIF – National Council of Real Estate Investment Fiduciaries
1. INTRODUCTION
Portugal’s real estate market is posting an outstanding performance and this brings relevance to exploring the reasons behind this performance and the features that investors are looking for in the market. Being mostly foreign investors the main players in the market, it makes sense to study what are the profiles of these investors and what can be done to continue to attract them to this country. According to Pedro Lancastre, Managing Director of JLL Portugal,” The strong interest of investors in Portuguese real estate is installed. If we know how to perceive and support their investment strategies and do not experience major changes in tax policy, there will not be many reasons why this positive wave cannot continue.“
The idea of real estate as an asset has become more consistent and fundamental in a well-diversified and global portfolio. According to Hoesli and Lekander (2007) the main advantages of including real estate in a portfolio are: risk diversification, low correlation with financial markets, high stable returns and inflation indexation income. The combination of these advantages with the growth of Portugal’s real estate market, makes a relevant investment opportunity for foreign investors.
The analysis of the investments styles, however, is very neglected in respect to real estate. In this regard, it was one of the main constraints during the investigation. Most authors studied investment styles for equity, starting to classify stocks as value or growth. As the market started to get more complex, the concept expanded to the point where a wide range of indices is now available. Nevertheless, the definition of investment styles used in equity is not suitable for real estate. The main problem arises from the fact that real estate managers have much more control over the property and the possibility of active management stock managers that usually do not own.
Therefore, investment styles in real estate can be classified according to eight main factors: (1) leverage (2) income distribution as a percentage of total return; (3) location; (4) property size; (5) property type; (6) stage of development; (7) ownership control; (8) occupancy.
The aim of the thesis is to identify the different investment styles of foreign investors in Portugal’s real estate market and discuss whether the weight of the various style impacts, or not, the market returns. It is also analyzed if the variation of volume of transaction changes the
investment styles. Furthermore, this work intends to be used as a tool for better understanding about what foreign investors seek for in Portugal’s real estate market.
This investigation uses the information provided by real estate advisory companies reports, namely Jones Lang LaSalle (JLL), Cushman & Wakefield, CBRE, WORX and BPrime. The data covers 73 transactions of sale and purchases agreements between 2013 and 2017 in a semiannual series that were latter categorized according to each investment style.
Following this section, in chapter 2 this literature review about real estate as an asset class and the determinants of foreign investment this market is presented. Also, it includes the main references that analyzed the definition of real estate investment styles and its categorization. Chapter 3 presents which was the collected data and the methodology used to analyzed that information. The results of the research are described in chapter 4 and in chapter 5 concludes.
2. LITERATURE REVIEW
Real estate as an asset class has several specificities that distinguish it from other asset classes. In Portugal, the investment in real estate has been attracting investors from all over the world and it is necessary to understand what are the elements in Portugal’s real estate market that attract these investors and to analyze them. To start this research, it is important to clarify some concepts and the context of Portugal’s real estate market.
2.1. Real Estate as an Asset
The idea of real estate as an asset has become more clear for investors during the last decade and has earned its place into a diversified portfolio (Wilson et al., 2005). This theory was supported by several authors (Craft, 2001; Sirmans and Worzala, 2003) who concluded that investing in real estate has significant benefits:
1. Portfolio Diversifier and Risk Reducer
The correlation between real estate and other asset classes (bonds, stocks and cash) suggest that real estate can help to reduce the total risk of a multi-asset portfolio (Wilson et al., 2005). In fact, although property faces the same effects of interest rate movements as bonds and stocks, the results on the income streams of real estate are only evident later in the business cycle (Hoesli and Lekander, 2007). Also, during the last decade, it was possible to reduce the risk of investing in real estate in respect to information asymmetries, due to improvements in the flow of information, with the development of market statistics and indexes (Chun, Sa-aadu and Shilling, 2004).
2. Attractive Income Structure
The income structure of real estate can be decomposed into two parts. A first part that is affected by property market forces (supply and demand for space) which drives earnings from rents. The market can be easily evaluated by analyzing the occupancy rate, which refers to the percentage of property that is occupied, and the take-up levels, that reflect the vacancies that are being leased or sold (Maketa Investment Group, 2009). This portion is relatively stable
because although tenant demand can change unexpectedly, the supply for space is considerably easy to measure and predict (Conner and Liang, 2005). This is attractive to most investors since it offers stable cash flows, which is the ideal for investors that desire to have a higher proportion of its total portfolio (Wilson et al., 2005).
The other part however, concerning the valuation of the asset, and reflected in the capitalization rate is more complex and difficult to predict,. This rate stands for the ratio between the annual net operating income (rents) and the property purchase price. The capitalization rate is influenced by capital markets fundamentals that are more difficult to predict, such as investor sentiment (Conner and Liang, 2005). Indeed, capital market forces can easily offset or amplify property market fundamentals. The combination of the income streams with long-holding perspective of real estate encourages investors with liability matching management to include real estate in their portfolios.
3. Protection against unexpected inflation and low consumption
Over the time, real estate has proved its ability to beat inflation, namely when comparing with other assets, as it can be concluded in Figure 1, by Peyton (2011). Therefore, in a mixed-asset portfolio, if inflation is greater than expected, real estate returns will help offset the negative performance of other assets (Wilson et al., 2005).
Figure 1 - United States inflation versus Commercial Real Estate total return
* NCREIF Property Index – Total return
Chun, Sa-aadu and Shilling (2004) go further and conclude that the relationship between the ratio for real estate and the volatility of future consumption growth suggests that investors who prefer have good performance on their investments when consumption growth opportunities are low, should overweight real estate.
Nevertheless, the level of protection against inflation depends on certain specifications of the leasing contract. Lease structures play a crucial role. In long-term leases, rents increase over the term of the lease due to indexation to inflation. In the case of short-term leases, rents can easily catch up to inflation. However, if for instance there is an excess in space supply, at the time of renewal of the contract, the catch up to inflation will be at the minimum. This helps portfolio managers to decide on which markets to invest based on the space supply, selecting the ones that are more unlikely to face excess supply and therefore, that are more inflation protective (Peyton, 2011).
4. High risk-adjusted returns
Real estate investments have quite high average returns relative to their risk (Chun, Sa-aadu and Shilling, 2004) In fact, Wilson et al. (2005) concluded that, on average, real estate does not outperform stocks and bonds returns. Nevertheless, when analyzing the return per unit of risk, real estate exceeds both stocks and bonds (Table 1). Also, as income streams are relatively predictable, investors are willing to accept more geared property investments, especially in a low-interest rate environment since the returns on equity would compensate the perceived risk (Hoesli and Lekander, 2007).
Table 1 - Returns and Risk-Adjusted Returns for Major Asset Classes (1987-2004)
Return Risk Return per unit
of Risk
PPR REI* 7,89% 3,6% 2.18
Bonds 8,04% 5,1% 1.58
Stocks 13,10% 17,5% 0.47
* Property & Portfolio Research Real Estate Investments
However, as in every other asset, real estate also presents drawbacks that can be summed up into three main ones: heterogeneity, lumpiness and illiquidity (Hoesli and Lekander, 2007 and
CAIA Association, 2012). In fact, real estate is highly heterogeneous not only due to its physical characteristics but also because of different lease structures, specially between property types, which affects the income structure and overall valuation of the asset. This is also why real estate requires specialized and active management (CAIA Association, 2012). The second factor, with respect to lumpiness, refers to the fact that it cannot be acquired or sold in small pieces and quantities. In contrast to public equity, where transactions can be made freely in terms of size by adjusting the number of shares (Hoesli and Lekander, 2007). This restricts the entry in the market for investors at a single-property level that cannot easily purchase a large lot size. Finally, the fact of being an illiquid asset constrains the investment of more risk averse investors, especially when comparing to public stocks.
To conclude, the decision-making process of an investor should be made by balancing out the advantages and disadvantages of real estate and defining the exposure desired according to the goals of each investor.
2.2. Real Estate Investment Styles
2.2.1. Definition
The concept of investment style has been the subject of broad analyses and according to Kemp, Richardson, Wilson (2000: 1) a proper definition is that “Style analysis is the process of identifying, in some quantitative manner, the characteristics of a fund (or fund manager/fund management house) that differentiates it from its benchmark/competition”. Also, style analysis can be used as a measure to qualify the performance of a fund based on its returns (Fuerst and Marcato, 2009).
2.2.2. Purposes of Investment Styles
1. Performance Analysis
Style analysis helps investors and fund managers to evaluate the portfolio/fund performance in comparison to benchmark portfolios in the same styles category. (Fuerst and Marcato, 2009). Horst, Nijman and De Roon (2004: 3) also added that it can also be used to “determine whether the mimicking portfolio is obtainable at a lower cost than the observed portfolio”.
Moreover, style analysis provides a better description of manager’s behavior and at the same time, it helps to understand better how his/her own portfolio and how the competing
portfolios are positioned (Kemp, Richardson and Wilson, 2000). Managers can decide between sticking to a particular style or to diversify among styles.
2. Define Objectives
Investors require the information provided by investment styles to define a portfolio that is in accordance to their initial objectives, namely risk and return, and to estimate portfolio holdings (Xing, 2009).
The existence of segmentation in the markets according to their similarity in terms of risk/return helps more sophisticated investors distinguishing different investment strategies and facilitates the communication between them and fund managers, so that both interests can be matched (INREV, 2012).
3. Improve Transparency
According to Xing (2009: 8), funds categorization “improves the transparency of markets, and helps fund managers market their products, because a lack of symmetric information contributes to underpricing.”. Indeed, better information disclosure will allow investors to compare more clearly different investment products.
4. Track Style Drift
Once the style is defined, it is possible to track style drift and how which style performs better in different cycles (Baczewski, Hands and Lathem, 2003).
2.2.3. Why Real Estate Investment Styles
In the case of equity, the initial styles were limited to value and growth stocks but over time, the specification of each style was expanded to the point where a wide range of indices is now available. Initially, the concept was developed in a top-down process where investors started from allocating to a particular investment style and then construct a portfolio in accordance with that style (Fuerst and Marcato, 2009).
However, this method it is not adaptable to real estate. Indeed, an equity portfolio manager has much less ownership control in comparison to a real estate manager, that can use and active management strategy. According to Fuerst and Marcato (2009: 106), some of these options are: “lease management, physical alterations to the property, proactive maintenance, facility management and selectivity of tenant quality and mix”.
2.2.4. Real Estate Investment Styles Factors
When classifying styles, it is important to take into account both quantitative and qualitative factors to which investors can be more or less exposed to and that results in different patterns of return over time (INREV, 2012).
Based on previous studies (Baczewski, Hands and Lathem, 2003; Xing, 2009; Kaiser, 2005; CAIA Association, 2012), investment styles can be categorized according to the following attributes.
Financial Factors
1. Leverage: Measured by the loan-to-value of the portfolio, which is the “total external leverage at the fund level as a percentage of the gross asset value of the fund” ( INREV, 2012: 11).
2. Income distribution as a percentage of total return: Measured by the target percentage of investments in non-income producing investments in the investor’s portfolio. Income producing investments refer to assets that are already finished with construction and which are owned by investors that want to keep them in their holdings, that is, producing income from rents. Non-income producing investments, in contrast, can be either properties or land in the need for either (re)development, refurbishment or other active management activities before the asset can start producing income
Property Factors
• Property Size/Value: Larger properties are considered institutional assets since they are less risky because larger properties usually have high-quality tenants and long-term leases
• Property Type: Depending on the type (residential, retail, office and industrial), properties need different management, which has a direct effect on its performance. • Location: Properties’ performance is influenced by their geographic location and the
characterized by significant levels of transaction activity and high demand which results in higher prices and occupancy rate. These markets usually include major metropolitan areas and prime zones (city centers). Secondary markets are considered riskier, typically located in suburban markets, with more available space and less demand (Maketa Investment Group, 2012).
• Stage of Development: Early stages of a property have significantly more risk since it is more likely for something unexpected to happen. A well-established property, fully occupied and with no need for redevelopment have much less risk. Also, older assets tend to have more physical needs and repairs required, which increases the investment value.
Operating Factors
• Occupancy: Refers to the level of occupancy of the property when purchased. In an asset with a high level of vacancy that the investor expects to lease up over time, the risk of the investment will be higher compared to a fully-leased property.
• Ownership control: Enables the investors to do several activities that affect the performance of real estate. These activities include: investing additional capital for development or re-development, re-marketing and management of tenants, change the duration of the lease structure and reduce expenses (taxes or insurance) (Kaiser, 2005).
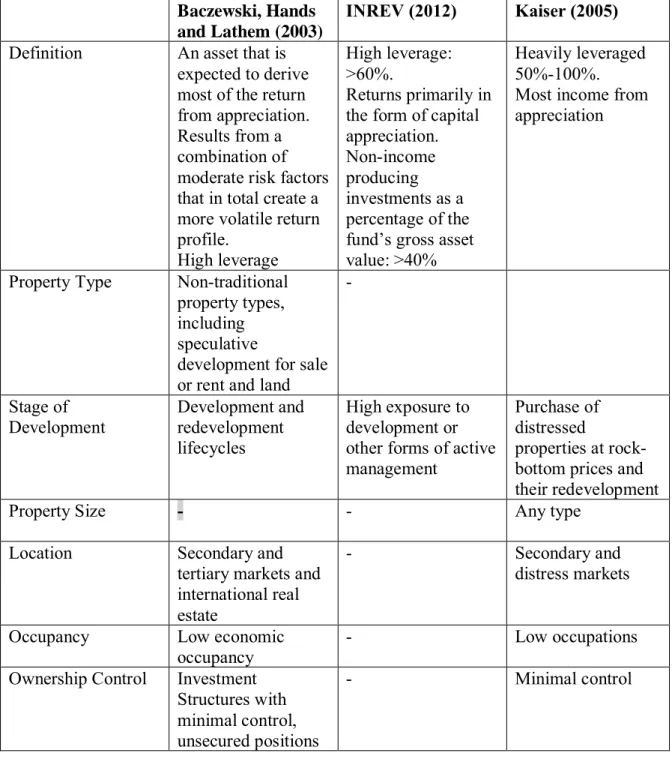
2.2.5. Investment Styles: Core, Value Added and Opportunistic
Real estate style analysis can be complexed because it can be done in terms of different subjects. In fact, not all definitions in previous studies cover the six characteristics explained above. Some authors use investment styles in terms of funds/portfolio, others in terms of investments/assets and others use the mix of the two. This explains the fact that most investors and consultants are relatively hesitant when using them. In Table 2, Table 3 and Table 4 the general definition and the characteristics of each factor of the three investment styles are exposed.
Table 2 – Core Investment Style
Baczewski, Hands and Lathem (2003)
INREV (2012) Kaiser (2005)
Definition Assets that achieve a relatively high percentage of return from income and that are expected to exhibit low volatility. Maximum loan to value: 50% Low leverage High proportion of return through income Little or non-mortgage debt. Maximum leverage: 50% High proportion of income (70%)
Property Type Major property types only – office, industrial, retail (neighborhood/ community centers, regional/super regional malls), multifamily - Office, Industrial, Retail and Residential Stage of Development
Operating Non or very low development exposure
-
Property Size - Large holdings of
assets Mostly institutional
Location Institutional
market/location
Mature sectors and countries
Major metropolitan areas
Occupancy High occupancy - Fully leased
(multitenant properties) Ownership Control Investment
structures with significant control
Table 3 – Value Added Investment Style
Baczewski, Hands and Lathem (2003)
INREV (2012) Kaiser (2005)
Definition Assets that achieve a significant portion of return from appreciation and exhibit moderate volatility. Moderate leverage. Maximum loan to value: 70% Returns from a balance of income and capital appreciation. Moderate leverage. Maximum loan-to-value: 40% - ≤60% Significant part of the return from appreciation (50-70%)
Leverage: over 30%/ - maximum 70%
Property Type Major property types, plus other retail, hospitality, senior living, storage
Any type of property Office, Industrial, Retail, Residential, Hotel and Storage
Stage of Development
Operating, Leasing Part of the investments in development. Repositioning or redevelopment Properties in need for relatively redevelopment Property Size - - - Location Institutional or emerging markets - Major metropolitan
areas but also in emerging markets Occupancy Moderate to well
leased, substantially pre-leased development Active management through active leasing risk Involves some substantial releasing or initial leasing risk
Ownership Control Investment structures with significant or moderate control, but security or preferred position -
Table 4 - Opportunistic Investment Style
Baczewski, Hands and Lathem (2003)
INREV (2012) Kaiser (2005)
Definition An asset that is expected to derive most of the return from appreciation. Results from a combination of moderate risk factors that in total create a more volatile return profile.
High leverage
High leverage: >60%.
Returns primarily in the form of capital appreciation. Non-income producing investments as a percentage of the fund’s gross asset value: >40%
Heavily leveraged 50%-100%. Most income from appreciation
Property Type Non-traditional property types, including speculative
development for sale or rent and land
- Stage of Development Development and redevelopment lifecycles High exposure to development or other forms of active management
Purchase of distressed
properties at rock-bottom prices and their redevelopment
Property Size - - Any type
Location Secondary and
tertiary markets and international real estate
- Secondary and
distress markets
Occupancy Low economic
occupancy
- Low occupations
Ownership Control Investment Structures with minimal control, unsecured positions
2.3. Determinants of International Real Estate Investment
Historically, investors prefer to invest in domestic real estate markets because they have more easy access to the opportunities and a better understanding of the markets (CAIA Association, 2012). Nevertheless, the diversification gain from investing in a foreign country outweighs these concerns and leads investors to proceed with their international investments. The diversification benefit of real estate is especially significant when investing internationally because property markets of different countries usually have low levels of correlation (Lee, 2005) which can be explained due to the macro and microeconomic factors of each market and the heterogeneity of the asset itself.
Therefore, after deciding to invest in a foreign country, an investor must decide in which markets to do it. For this matter, Lee (2005) proposes three questions that the investor must take into consideration during the investment process: (1) the potential of the real estate market in general; (2) the potential of the individual markets; (3) the investment vehicle.
Geuters and Jaffe (1996) established four main categories of risk: risk assessment variables, property rights variables, socio-cultural factors and foreign investment variables. In the first category, they include political risk, which expresses the probability of economic losses due to government actions, economic risk, issues more related with macroeconomic variables (economic growth, inflation, exchange rate and indebtedness), credit risk and financial risk rating. Relatively to the fourth topic, the authors refer to it as the degree of foreign control, that is, how foreign investors can manage companies and assets in another country and how they are treated by the citizens in the host country.
Lee (2005) proposed to create an index to evaluate a country’s real estate market investment potential based on four dimensions. (1) Expected growth; (2) Country Risk; (3) Transparency; (4) Real Estate Market Specific Risk. In the country risk category, the authors extend the usually used political risk, including also: discriminatory tax regulations, limitations on foreign ownership, lack of information, capital controls and transaction costs. Regarding transparency, it must reflect the ability of market participants to observe the information driving the trading process (O’hara, 1995). To facilitate the analysis of this subject, JLL developed an index that traduces the level of transparency in a country called the Global Real Estate Transparency Index. This index ranks countries from a score of 1 to 5 considering the following aspects: legal factors, regulatory burdens, availability of information on market fundamentals, listed
vehicle financial disclosure and governance and availability of investment performance indexes. For the last aspect of the index, real estate market specific risk, Lee (2005) evaluated the market size (using the level of urbanization), lease laws, tenant rights and taxation and ownership issues relating to direct real estate investment.
Lieser and Groh (2011) also examined what attracts international commercial real estate investment, using a set of panel data series for 47 countries worldwide. They conclude that the more significant drivers of international real estate investment are: real estate investment opportunities, depth and sophistication of capital markets, investor protection and legal framework, administrative burdens and regulatory limitations. The first factor can be evaluated first, in terms of barriers to entry, liquidity risk and market transparency and second, by the level of urbanization and quality of communication and transportation services. Moreover, the development of financial and business services reflects the level of sophistication in the economy, which increases demand for properties. Relatively to capital markets, investors will require a liquid market, with a stable banking and financial systems. For the last two factors, they have an impact directly on the process of investment in all its stages: investing, operating and existing. Furthermore, since real estate is an asset that requires active management, the investors will choose countries where market convention and administrative and legal framework are more alike.
Clearly, investing in international real estate requires a long and complex process due to its specificities and risks so that investors can take more advantageous of the diversification benefits and attained higher returns relatively to traditional investments. Therefore, when not well-informed about a certain market, investors should always look for the expertise of consultants to help their decision.
2.4. Portugal’s Real Estate Market
2.4.1. Economic Environment
The recovery process of the macroeconomic indicators has shown a very positive evolution (Figure 2). 2014 was a remarkable year with the end of the Economic and Financial Assistance Program, which strongly influenced Portuguese economy (JLL, 2015). Besides that, the European context was also advantageous, characterized with EURIBOR rates reaching minimum values, devaluation of euro against the dollar and the drop in oil prices. This led to some stability of economy at the end of 2015. It is important to mention that, in the beginning of the recovery, growth was mainly explained by private consumption. However, the weight of private and public consumption in GDP has also shown a downward trend in recent years. In contrast, the contribution of exports has been increasing significantly, mainly driven by the goods and services sector with greater impact from exports (Banco de Portugal, 2017).
Figure 2 - Evolution of GDP composition (in %)
Source: INE and Banco de Portugal
The positive evolution of inflation (Figure 3) is also important and it has a positive impact on the property market, leading an increase in rental values, stimulating the market. The upward trajectory in the last years is associated the recovery of the industrial goods, excluding energy, after the sharp drop in 2013 (Banco de Portugal, 2017). Relatively to the unemployment rate, as shown in Figure 4, after significant improvements during 2013, it has started a downward trajectory, which is expected to continue. This will also have a positive impact on inflation with an increase in salaries.
Figure 3 - Evolution of CPI excluding energy goods Figure 4 – Unemployment rate (in %) (Annual rate of change, in %)
Source: INE and Banco de Portugal Source: CBRE
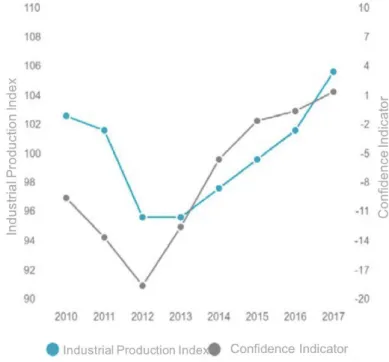
2.4.2. Industrial Market
Industrial activity has taken an important contribution to economic growth in Portugal. In 2013, as shown in Figure 5, after sharp drops in the industrial production index, which was negatively affected by the evolution of consumption and investment in the country, the indicators started to recover and the optimism of industrial entrepreneurs was reflected in the index (JLL, 2018). This favorable evolution of the industrial sector is mainly associated with the growth of the retail business, which led to the development of new infrastructures. However, this new construction was not enough and the market continuous facing two important constraints: first, traditional national logistics developers are not very active and secondly, the margin of investment is relatively low to attract foreign investors and for that, rents would need to increase or land prices to drop. Nevertheless, despite the lack of new construction, supply continues to exceed demand.
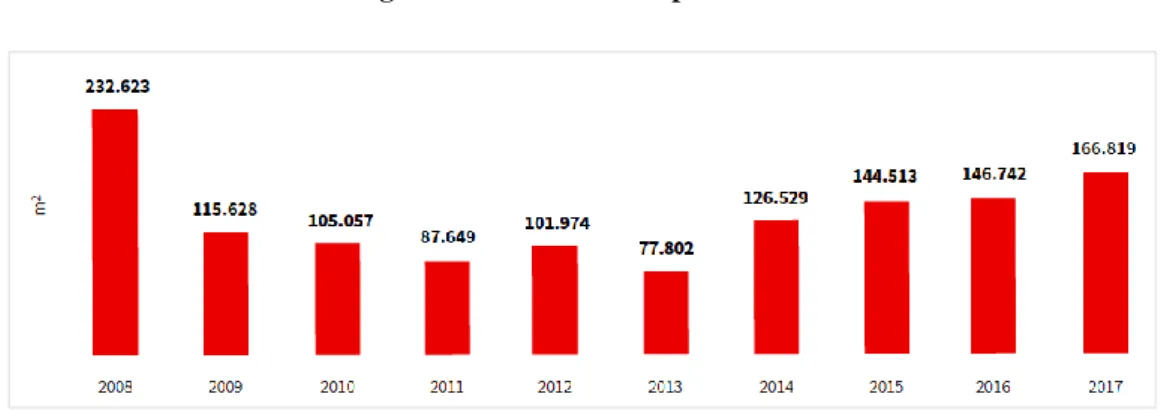
In fact, new occupants are rare in the market. Until 2016, the absorption levels, as shown in Figure 6, were relatively low, caused by the scarcity of newly and quality spaces, leading distribution companies to accommodate their expansion in spaces already occupied (CBRE, 2017). However, the growth of retail business and online sales led to the development of new projects in between 2016 and 2017, explaining the significant increase in the last year. Also, e-commerce distributors look for spaces with special characteristics such as proximity to urban areas and connection with the final point of delivery, so that they can reduce the delivery time of their products, which leads to an increase in the demand for space.
Figure 5 – Industrial sector indicators (Confidence indicator in annual average)
Source: Cushman & Wakefield
Figure 6 – Occupation of Logistics Warehouses
Source: CBRE Research
2.4.3. Office Market
The evolution of the take-up levels (Figure 7) present that, since 2008 and until 2014, the absorption of offices was quite low, culminating in 2013 with the lowest volume of 77,800sqm.
This occupation reflected the post crisis climate of uncertainty about the economy and a highly cautious attitude to the rental options. However, this trajectory was reversed in 2014, when the confidence levels started to increase due to expansionary demand as the economy started to recover. This led to improvements in the occupier’s attitude and preference for higher quality spaces.
Figure 7 – Office take-up evolution
Source: JLL
Currently, the demand for spaces is relatively high, associated to the positive pace of economic growth and employment, boosting the business market. More importantly, shares services companies and technologic sector continue to show interest in establishing themselves in Portugal (CBRE, 2017). This interest is due to a skilled and foreign language fluent labor force, more flexible labor force time zone suitable for Europe and quality of life and safety (JLL, 2017). However, the expansion of this activity is limited since the available space is low and rents will continue to increase, especially in the prime areas. This leads companies to look for solutions outside Lisbon or even other countries.
In fact, the most real estate is already occupied and new construction is not enough to satisfy demand and is already pre-leased, as shown in Figure 8. The low promotion of new and high-quality buildings has led to the occupation of offices that have been available for a long time and outside of prime zones. Another response of demand is to convert obsolete buildings into office spaces, such as warehouses, rather than occupy typical offices. This relocation justifies the increase in take-up levels despite the low supply in the market. Also, and especially in Lisbon, tenants are starting to renegotiate contracts to assure their spaces, even if it requires a significant increase in rents.
Figure 8 – New office supply
Source: JLL
2.4.4. Residential Market
In general, supply as evolved at a relatively moderate level, as exhibited in Figure 9. Currently, the market is facing a discrepancy between supply and demand, not only in terms of units but also in terms of location, typology and price (JLL, 2018). The majority of the new built apartments are targeted for the foreign market, characterized by being of a small type and with short-term rentals, which does not suit the domestic demand. In response to this dynamic, greater promotion is shifting from prime areas to traditional neighborhoods with less value. This geographical diversification is not yet evident in Porto (Cushman & Wakefield, 2017). In result of the modest evolution of supply, it shows to be insufficient to meet exponential increase in demand.
Figure 9 – Homes Supply in Lisbon and Porto
The resumption of residential market activity started in 2013, driven by the “Gold” Visa or Resident Permit for Investment Activity Program. This program was implemented at the end of 2012 and attracted several foreign investors who needed to have Portuguese citizenship travel freely in the Schengen area. The investment type that most investors choose was real estate and primarily residential properties in central locations in Lisbon, preferably with the possibility of obtaining income, rather than for own occupation (JLL, 2014). In addition, the strong growth of tourism initiated significant changes in the market values that, after a sharp drop due to the real estate bubble, started to recover (Figure 10). The sustained growth of demand, as shown in Figure 11, during the last years, is based on the better economic conditions, quality of life and increase in employability that continued to attract foreign investors but also, the increase in demand for housing loans by Portuguese citizens associated with the better banking conditions (JLL, 2018).
Figure 10 – Residential market values
Source: Cushman & Wakefield
Figure 11 – Number of homes sold
2.4.5. Retail Market
The retail supply in Portugal faces currently two main scenarios. The first one, is the maturity of the shopping centers market, leaving the potential for large-scale projects very reduced and the new supply in this sector mainly associated with expansions or renovations. The second one is the positive evolution of the high street retail, which justifies the positive levels of supply in the last two years (Figure 12). In fact, since 2011, with the contraction of the consumption and week conditions of bank loans, left many promoters to cancel their projects (JLL, 2014). Only in 2014 new openings were seen and street commerce started to grow. This was driven by the changes in leasing law, which beneficiated real estate owners to update rents of old contracts but mainly due to the growth of tourism. Actually, the supply in the main city centers is starting to not being enough, leading some retailers to look for solutions in secondary streets and residential areas, adapting to new consumer habits that have “welcomed back neighborhood shopping” (JLL, 2017: 32).
Figure 12 – Evolution of Retail Developments Supply
Source: JLL
Relatively to the evolution of rents, as shown in Figure 13, up until 2013, there was a period of stagnation as a consequence of economic crisis and a slight decrease in 2012 as owners of commercial infrastructures had to grant incentives and rent adjustments to keep tenants or to attract new ones (JLL, 2013). In 2014, rents in street retail started to accompanied the dynamics of the market, while shopping centers were relatively more stable. However, the scarcity of
available space in prime shopping centers started to put an upward pressure on rents for this market (CBRE, 2017).
Figure 13 – Evolution of prime rents (in €)
3. DATA AND METHODOLOGY
The main objective of this thesis was to identify the investment styles of foreign investors in the Portuguese real estate market and analyze the relationship between them and the returns and volume of transactions of the market. For this purpose, this chapter intends to describe all the stages of the process of classification of each transaction made in Portugal between 2013 and 2017.
In this investigation, there were some aspects that complicated the analysis. The most relevant was the lack of previous studies made on investment styles, especially when classifying properties and not funds. Most authors base their analysis on fund’s and linked their attributes and expected risk/return to a certain investment style (Xing, 2009). Although this is an interesting analysis, data is very difficult to find for non-listed investment vehicles and especially in Portugal, therefore, the information available on real estate market is limited and mainly provided only by major consulting companies.
This way, the analysis of investment style analysis based on the characteristics of the main real estate transactions and categorize them into each style.
3.1. Data
The data used in this analysis was provided by Jones Lang LaSalle, Cushman & Wakefield, CB Richard Ellis, WORX and BPrime reports, from where were collected the main real estate transactions from sale and purchase agreements in Portugal. It covers 73 transactions between 2013 and 2017, in a semiannual data. The following attributes were covered in each transaction:
• Building • Property Type • Location • Area • Seller • Buyer
• Country of the buyer • Value
The period of analysis chosen was selected based on the fact that, until 2011, the market was facing the consequences from the real estate bubble that started in 2007. This bubble was characterized by a severe increase in prices, followed by an abrupt decrease during a short period of time, resulting in a stagnation of the market. After that, the market passed through a downturn period and only in 2013 the market started to recover, supported essentially by foreign investment (Figure 14).
Figure 14 – Volume of Real Estate Investment
Source: JLL
3.2. Methodology
The data aforementioned collected was later organized in a database that gathered all the information needed to identify the investment styles of each property. According to the criteria reviewed in Chapter 2, there are three categories of attributes to classify each style; financial, property and operational factors. However, the information collected about each transaction only gives information about the property and operational factors. Therefore, the analysis was based on those two categories.
Property Factors: include stage of development (Table 5) and location.
Table 5 - State of development
Operating Building leasing-ready and with no renovations needed
Renovation Plans Building that is operating but investors intend to do renovations to increase its value
Change of tenants Building is operating but investor wants to change the tenants Rehabilitation Distressed properties or change of property use (For example,
change from an office building to a residential building) Source: Self-constructed
Location
The classification of the location of properties depends on the city in which the property is established as each city has its own key zones. Since Lisbon is the main city of investment and due to the complexity of the city, the office and industrial markets were divided into different zones, according to the Cushman and Wakefield (2018). Also, it was included a classification of grade C, representing zones with the highest vacancy rate. In the other cities, the markets were considered according to the definition used in the literature review (Table 6).
Table 6 – Location
Grade A locations City centers and other prime zones
Grade B locations Suburban areas with less volume of transactions Grade C locations Zones with the highest vacancy rate
Figure 15 - Lisbon industrial market geography
Source: Cushman &Wakefield Grade A: Zone 1 and 2
Grade B: Zone 5
Grade C: Zone 3, 4 and 6
Figure 16 – Lisbon office market geography
Grade A: Zone 1, 2 and 5 Grade B: Zone 3 and 4 Grade C: Zone 6
Operational Factors: include occupancy levels (Table 7) and ownership control (Table 8).
Table 7 – Occupancy levels
Fully leased Properties that are already occupied for one or more tenants Partially vacant Properties with space for more than one tenant and have space
available to rent or sell
Vacant Properties that are not occupied by any tenant
Pre-leased Properties that have no physical tenant but are already settled for future occupancy
Source: Self-constructed
Table 8 - Ownership control
Own Control Investors manage the property
External Management Hiring of external companies to manage the property Source: Self-constructed
There was also collected some additional information about the property or the transaction to facilitate the classification. For example, if the purchase was made under a sale and lease back contract.
In the second stage, after the categorization of each transaction, an analysis of the relationship between the investment styles and real estate market variables was performed. The selection of the variables was based on the reports and the information provided about the investment market.
With the purpose to analyze if foreign investment styles change with the evolution of returns, it was collected data about market average yields was collected and computed the correlation between variables computed. The same methodology was used for the volume of transaction.
4. RESULTS
This chapter aims to at observing the evolution of investment styles, attempting to establish a relationship between the styles and the main real estate market variables. It also explains the reasons behind the development of styles and what were the key transactions that contributed for this evolution.
4.1. Relationship between the volume of transactions and investment styles
Figure 17 explores the relationship between the volume of transactions and the share of each investment style of foreign investors in each semester. During the first three semesters, the volume of transaction was very low. This evolution goes in accordance with the market environment since it was in 2014 when the real estate started to recover from the economic crisis and investors regained their confidence in Portugal leading to an increase in demand. However, in 2016, the market faced a downward pressure justified by a reduction on the volume of transaction of the retail sector that decreased from 654 million euros in 2015 to 173 million euros in 2016. In fact, 2015 was a year marked by significant purchases in retail, namely the sale of Almada Forum and Forum Montijo to the American fund, Blackstone, and the portfolio of Dolce Vita Porto, Coimbra and Douro, managed by Deutsche Asset Management's, totaling a value of 530 million euros. The first transaction represented a value added investment since both shopping centers are located in secondary markets and the second one, an opportunistic investment as it resulted from the bankruptcy of the owner and the need for rehabilitation. Indeed, the positive performance of the market was due to the investments in office and retail segments, that represented more than 90% of the foreign investment during the period of analysis, except in 2014, as shown in Figure 18.
As stated in CBRE (2017), the growth of interest in offices since 2015 is remarkable. According to CBRE (2017), the evolution of the demand for offices is related to the decrease in the unemployment rate and the expansion of shared services and the technologic sectors that awakened the interest of investors in the market. In fact, as showed in Figure 19, it exists a clear negative correlation between the unemployment rate and the take up of offices in the Portuguese market. Most of the transactions were core properties, located in the Lisbon’s prime CBD and with long term tenants, that guarantees safe returns to the investors. Nevertheless, the main transaction in this market was executed by the Asian SG Trust, in 2017, that purchased
the Campus da Justiça, in Parque das Nações, valued at 225 million euros, representing a core investment.
Relatively to the evolution of investment styles, core and value-added investors were the main players in the market, but important to highlight the weight of core throughout the period of analysis that was practically always above 50%. Apart from the first semester of 2014, when there was only one main transaction in the market and represented a value added property.
Figure 17 – Relationship between the volume of transaction and investment styles
Source: Self-constructed
Figure 18 – Investment by type of property
Figure 19 – Correlation between Office Take up and Unemployment Rate
Source: Self-constructed
As Table 9 shows, the volume of transactions has a positive correlation with opportunistic investments. This means that the pick-up in volume in the Portuguese property investment market was due to the arrival of opportunistic investors, largely absent from the market in the period that started with Economic and Monetary Union membership and abruptly ended with the Financial Assistance Program of 2011. Relatively to value added investments, the correlation is negative, meaning that foreign value-added investors were not essential for the markets turnaround. In respect to core investments, the correlation to the volume of transaction is practically null, showing that core investors lost their, once decisive, importance in the Portuguese property investment market.
Table 9 – Correlation matrix between volume of transaction of investment styles
Volume of transactions Variation Opportunistic Variation Value added Variation Core Volume of transactions 1 Variation Opportunistic 0,54945448 1 Variation Value added -0,4584317 -0,6420946 1 Variation Core -0,0231166 -0,3531004 -0,2336762 1 Source: Self-constructed
4.2. Relationship between average yields and investment styles
In terms of yields, as shown in the Figure 20, it accompanied the dynamics of the market, showing a downward evolution, remaining more stable since 2016. This was a reflection of the increase in demand, mainly in office and retails sectors, that result in the appreciation of assets. Important to highlight the sharp decline of office in 2017, that in the first semester attained minimal values of yield. This decrease was associated with a high volume of transactions relative to the purchase of Campus da Justiça (Core), Entreposto Building (Core), República 25 (Core) and Gago Coutinho Portfolio (Value added), totaling a value of transactions of 370 million euros.
Figure 20 - Relationship between Average Yields and Investment Styles
Source: Self-constructed
As shown in Table 10, there is no strong correlation between the returns and the investment styles. The strongest relationship among the three is between the average yield and opportunistic investments, that shows a negative correlation, meaning that low yields do not scare opportunistic investors, as is to be expected, since opportunistic investors seek capital gains. not stable returns.
Table 10 – Correlation matrix between total average yield and investment styles Average
Yield Opportunistic Variation Value added Variation Variation Core
Average Yield 1 Variation Opportunistic -0,18247099 1 Variation Opportunistic 0,06990518 -0,6420946 1 Variation Opportunistic -0,10682153 -0,3531004 -0,2336762 1 Source: Self-constructed
5. CONCLUSIONS
The aim of the thesis is to identify the different investment styles of foreign investors in Portugal’s real estate market and discuss whether the weight of the various style impacts, or not, the market returns. It is also analyzed if the variation of volume of transaction changes the investment styles. For this matter, it was constructed a data base that collected the main real estate transactions from sales and purchase agreements in Portugal between 2013 and 2017. The results demonstrate that the two key players in Portugal’s reinvigorated real estate investment market were core and value-added investors, but with more focus in core investments that represented practically always more than 50% of the transactions. The market’s uplift was accompanied by a drastic change in the features that investors look for – Portugal’s real estate investment market went from a once segmented backwater in which a few core investors made relatively small investments seeking slightly higher yields to sweeten their portfolio returns to a relevant market for most of the world’s largest opportunistic investors, where these mammoth players deployed – or at least tried to - significant capital in absolute terms.
Relatively to the volume of transactions, the results suggest that it is catalyzed by opportunistic investors meaning that they are the responsible for the growth of the market. This dynamic comes from the fact that real estate prices of did not fall during the period of crisis, which should have happened as a result of the low level of transactions. As prices continued to be attractive for opportunistic investors, the positive condition of the market also had an positive impact on the demand. It is important to point out the influence of the office market that was mainly driven by the expansion of shared services that increased the demand for this type of buildings, not only in grade A zone but also in grade C locations. Also, the retail market represented a significant share of the investments, specially the purchase of portfolios of shopping centers that were in bankruptcy and the demand for street stores in Lisbon grade A areas that are expected to continue to grow to accompany the positive evolution of tourism. The study investment styles is yet a subject that is poorly analyzed. In fact, one of the main obstacles to elaboration of the thesis was the lack of data about the market and previous studies that could be suitable to the data base that was constructed to analyze the investment styles. The positive path of Portugal’s real estate market is remarkable. Nevertheless, there are still some challenges that the market has to face: (1) the lack of new office buildings and pipeline
in Lisbon prime areas, especially with conditions and high standards that match the demand of international companies that want to establish themselves in Portugal. This will lead them to start to look for different countries for this matter; (2) the spaces available for new construction require a significant investment since they either represent buildings outside prime zones that need a lot of renovations or construction from scratch.
6. BIBLIOGRAPHY
Baczewski, J., Hands, K. & Lathem, C. R. 2003. Real estate investment styles: trends from the catwalk. NCREIF white paper, Chicago.
Banco de Potugal, Boletim Económico,
https://www.bportugal.pt/sites/default/files/anexos/pdf-boletim/be_dez2017_p.pdf, December 2017
B.Prime; Prime Watch, https://bprime.pt/wp-content/uploads/2015/04/PrimeWatchH1.pdf, October 2017.
CAIA Association. 2012. Real assets. In K. Black, H. Kazemi & D. Chambers (Eds.), CAIA Level II:Advanced Core Topics in Alternative Investments: 321-352. New York: John Wiley & Sons Inc.
Craf, T. M. 2001. The role of private and public real estate in pension plan portfolio allocation choices. Journal of Real Estate Portfolio Managemen, 7(1): 17-23.
CBRE; Real Estate Market Outlook Portugal 2017,
http://cbre.vo.llnwd.net/grgservices/secure/CBRE%20Portugal%20Outlook%202017.pdf?e15 12650177&h=a52214fcb0fdd336de4f86ab3f06256c, September 2017.
CBRE; Highlights 2016, http://news.cbre.pt/highlights-by--cbre-2016/, May 2017.
Chun, G. H., Sa-aadu, J., & Shilling, J. D. 2004. The role of real estate in an institutional investor’s portfolio revisited. Journal of Real Estate and Economics. 29(3): 295-320.
Conner, P. & Liang, Y. 2005. Income and cap rate effects on property appreciation. The Journal of Portfolio Management, 31(5): 70-79.
Cushman & Wakefield; Marketbeat Potugal, http://www.cushmanwakefield.pt/pt/research-and-insight/2017/marketbeat-portugal-2017, February 2017.
Cushman & Wakefield; Marketbeat Potugal, http://www.cushmanwakefield.pt/pt/research-and-insight/2013/marketbeat-portugal-spring-2013/, April2013.
Fuerst, F. & Marcato, G. 2009. Style analysis in real estate markets: beyond the sectors and regions dichotomy. Journal of Portfolio Management. 33(5): 104-117.
Geuters, T. & Jaffe, A. 1996. Risk and real estate investment: an international perspective. Journal of Real Estate Research. 11(2): 117-130.
INREV; Investment Style Classification: Revised Version.
https://www.inrev.org/system/files/2016-12/INREV_Fund_Style_Classification_Report.pdf, February 2012.
JLL; Portugal Real Estate Market 360º, http://www.jll.pt/portugal/pt-
JLL; Portuguese Real Estate Market Q2 2016, Market Pulse, http://www.jll.pt/portugal/pt- pt/Research/EMEA_Portugal_Market%20Pulse_2016_Q2_PT.pdf?7ebee0f9-eea2-4804-ab1f-7d70f303755c, June 2016.
JLL; Portuguese Real Estate Market Q4 2015, Market Pulse, http://www.jll.pt/portugal/pt- pt/Research/EMEA_Portugal_Market%20Pulse_2015_T4_PT.pdf?2e043f3c-74d4-4291-922f-a6e32700ce6a, January 2016.
JLL; Portuguese Real Estate Market Q4 2014, Market Pulse, http://www.jll.pt/portugal/pt-pt/Research/Market%20Pulse_2014_T4_PT.pdf?7c0222a5-5b9a-4967-9e24-c6dcdce89334, January 2015.
Kaiser, R. W. 2005. Investment styles and style boxes in equity real estate: can the emerging model succeed in classifying real estate alternatives?. The Journal of Real Estate Portfolio Management. 11(1): 5-12.
Kemp, M., Richardson, M. & Wilson, C. 2000. Investment manager styles analysis. A paper presented at the Faculty and Institute of Actuaries Investment Conference, Hatfield Heath. Lee, S. 2005. Gauging the investment potential of international real estate markets. A paper presented at the Annual European Real Estate Society Meeting, Dublin.
Lieser, K. & Groh, A. P. 2011. The determinants of international commercial real estate
investment. Working Paper no. 935, IESE Business School – University of Navarra.
Hoesli, M., Lekander, J. & Witkiewicz, W. 2004. International evidence on real estate as a portfolio diversifier. Journal of Real Estate Research, 26(2): 161-206.
Hoesli, M. & Lekander, J. 2007. Real estate portfolio strategy and product innovation in europe. Journal of Property Investment & Finance, 26(2): 162-176.
Horst, J. R., Nijman, T. E. & De Roon, F. A. 2004. Evaluating style analysis. Journal of Empirical Finance, 11(1): 29-53.
Maketa Investment Group. Why non-core real estate”,
http://www.meketagroup.com/documents/WhyNon-CoreRealEstateWP_002.pdf, September 2009.
O’Hara, M. 1995 Market Microstructure Theory, Boston, Basil Blackwell Inc.
Peyton, M. Is commercial real estate a hedge against real estate?,
https://www.tiaa.org/public/pdf/tcam_iscommrehedgeagainstinflation.pdf, September 2011.
Roos, L., & Mancuso, J. Structuring a private real estate portfolio,
https://russellinvestments.com/media/files/au/insights/2011_april_privrealestate.pdf, April 2011.
Sirmans, C. F. & Worzala, E. 2003. International direct real estate investment: A Review of the Literature. Urban Studies, 40(5): 1081-1114.
Szelyes, Z. Real Estate as an Asset Class, https://www.credit- suisse.com/media/production/asset-management/docs/real-estate/white-paper-real-estate-as-an-asset-class.pdf, October 2014.
Wilson, P. J. & Zurbruegg, R. 2003. International diversification of real estate assets: is it worth it? Evidence from the literature. Journal of Real Estate Literature, 11(3): 259-277.
Wilson et al. 2005. Why real estate?. The Journal of Portfolio Management, 31(5): 12-21. Wong, P. Y., Higgins, D. M. & Wakefield, R. 2017. Chinese investors investment strategies in the Australian residential property market. Pacific Rim Property Research Journal, 23(3): 227-247.
Xing, G. 2009. An analysis of U.K property funds classified according to U.S styles: core, value-added and opportunistic. Unpublished master thesis dissertation, Massachusetts Institute of Technology, Massachusetts.