Departamento de Ciências e Tecnologias da Informação
Gait Rehabilitation Monitor
Paulo Leite
Dissertação submetida como requisito parcial para obtenção do grau de
Mestre em Engenharia de Telecomunicações e Informática
Orientador(a): Octavian Postoloche
Instituto de Telecomunicações/ISCTE-IUL
Abstract
This work presents a simple wearable, non-intrusive affordable mobile framework that allows remote patient monitoring during gait rehabilitation, by doctors and physiotherapists. The system includes a set of 2 Shimmer3 9DoF Inertial Measurement Units (IMUs), Bluetooth compatible from Shimmer, an Android smartphone for collecting and primary processing of data and persistence in a local database.
Low computational load algorithms based on Euler angles and accelerometer, gyroscope and magnetometer signals were developed and used for the classification and identification of several gait disturbances. These algorithms include the alignment of IMUs sensors data by means of a common temporal reference as well as heel strike and stride detection algorithms to help segmentation of the remotely collected signals by the System app to identify gait strides and extract relevant features to feed, train and test a classifier to predict gait abnormalities in gait sessions.
A set of drivers from Shimmer manufacturer is used to make the connection between the app and the set of IMUs using Bluetooth.
The developed app allows users to collect data and train a classification model for identifying abnormal and normal gait types.
The system provides a REST API available in a backend server along with Java and Python libraries and a PostgreSQL database.
The machine-learning type is Supervised using Extremely Randomized Trees method. Frequency, time and time-frequency domain features were extracted from the collected and processed signals to train the classifier.
To test the framework a set of gait abnormalities and normal gait were used to train a model and test the classifier.
Resumo
Este trabalho apresenta uma estrutura móvel acessível, simples e não intrusiva, que permite a monitorização e a assistência remota de pacientes durante a reabilitação da marcha, por médicos e fisioterapeutas que monitorizam a reabilitação da marcha do paciente. O sistema inclui um conjunto de 2 IMUs (Inertial Mesaurement Units) Shimmer3 da marca Shimmer, compatíveís com Bluetooth, um smartphone Android para recolha, e pré-processamento de dados e armazenamento numa base de dados local.
Algoritmos de baixa carga computacional baseados em ângulos Euler e sinais de acelerómetros, giroscópios e magnetómetros foram desenvolvidos e utilizados para a classificação e identificação de diversas perturbações da marcha. Estes algoritmos incluem o alinhamento e sincronização dos dados dos sensores IMUs usando uma referência temporal comum, além de algoritmos de detecção de passos e strides para auxiliar a segmentação dos sinais recolhidos remotamente pela app desta framework e identificar os passos da marcha extraindo as características relevantes para treinar e testar um classificador que faça a predição de deficiências na marcha durante as sessões de monitorização.
Um conjunto de drivers do fabricante Shimmer é usado para fazer a conexão entre a app e o conjunto de IMUs através de Bluetooth.
A app desenvolvida permite aos utilizadores recolher dados e treinar um modelo de classificação para identificar os tipos de marcha normais e patológicos.
O sistema fornece uma REST API disponível num servidor backend recorrendo a bibliotecas Java e Python e a uma base de dados PostgreSQL.
O tipo de machine-learning é Supervisionado usando Extremely Randomized Trees. Features no domínio do tempo, da frequência e do tempo-frequência foram extraídas dos sinais recolhidos e processados para treinar o classificador.
Para testar a estrutura, um conjunto de marchas patológicas e normais foram utilizadas para treinar um modelo e testar o classificador.
Acknowledgement
Firstly, I would like to thank my Supervisor Professor Octavian Postolache for the guidance, support and encouragement he has given me over the development of this work. I would also like to thank my parents, family and friends for the unconditional support they have given me.
The work was supported by Fundação para a Ciência e Tecnologia, Project TAILORPHY - PTDC/DTP-DES/6776/2014, and Instituto de Telecomunicações.
Table of Contents
Chapter 1 – Introduction ... 9
Chapter 2 – Related Work ... 13
2.1. Gait abnormalities ... 20
2.2. Gait cycle ... 27
Chapter 3 – System description ... 31
3.1. Hardware – Shimmer3 device ... 34
3.1.1. Shimmer3 coordinate system... 34
3.1.2. Shimmer3 calibration ... 34
3.1.3. Shimmer3 key features ... 37
3.2. Software ... 38
3.2.1. Android app ... 38
3.2.2. Shimmer drivers ... 46
3.2.3. Entity - Relationship model ... 49
3.2.4. System backend ... 50
3.2.5. Python data processing ... 51
3.2.6. Euler angles ... 54
3.2.7. Heel strike detection algorithm ... 61
3.2.8. Stride detection algorithm ... 63
3.2.9. Signal filtering ... 67
Chapter 4 – Classification ... 74
4.1. Types of ML algorithms ... 74
4.2. Supervised learning algorithm – Decision trees ... 75
4.2.1. Random Forests ... 77
4.2.2. Extremely Randomized Trees ... 78
4.3. Classification features used in this system ... 78
Chapter 5 – Experimental results ... 83
5.1. Experimental setup ... 83
5.2. Classifier results ... 86
5.3. Gait session results ... 87
Chapter 6 – Conclusion and Future Work ... 89
List of Tables
Table 1 Shimmer3 synchronization – sampling frequency ... 54
Table 2 Gait types ... 84
Table 3 Gait types’ labels ... 85
Table 4 Volunteers’ Biometrics characteristics ... 85
List of Figures
Figure 1 Lateral trunk bending ... 21
Figure 2 Anterior trunk bending ... 22
Figure 3 Posterior trunk bending ... 22
Figure 4 Increased Lumbar Lordosis ... 23
Figure 5 Circumduction ... 23
Figure 6 Hip hiking ... 24
Figure 7 Steppage ... 24
Figure 8 Vaulting ... 25
Figure 9 Excessive knee flexion ... 25
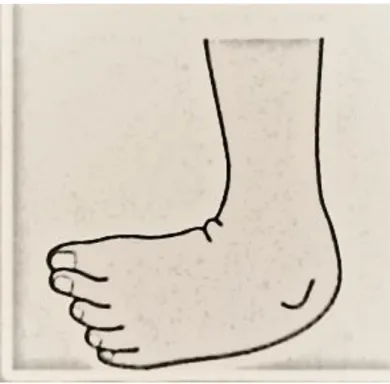
Figure 10 Abnormal foot contact ... 26
Figure 11 Abnormal foot rotation ... 27
Figure 12 Events in a gait cycle ... 28
Figure 13 System architecture ... 31
Figure 14 Shimmer device ... 31
Figure 15 Initial panel of Shimmer mobile software driver - connect to Shimmer ... 32
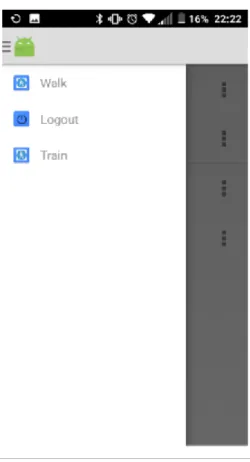
Figure 16 Left side: Gait session menu. Right side: Train classifier menu ... 33
Figure 17 App walk view buttons ... 33
Figure 18 Shimmer3 calibration axis ... 34
Figure 19 Shimmer3 accelerometer calibration parameters ... 35
Figure 20 Shimmer3 gyroscope calibration parameters ... 36
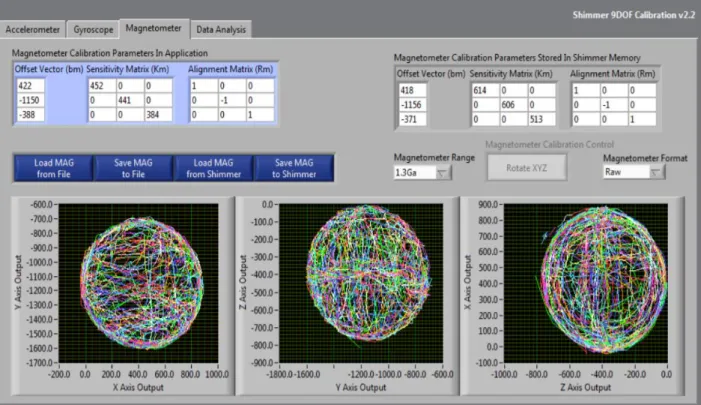
Figure 21 Shimmer3 magnetometer calibration parameters ... 36
Figure 22 Shimmer3 mainboard key features ... 37
Figure 23 App login view ... 38
Figure 24 App register view ... 39
Figure 25 Shimmer driver ... 40
Figure 26 Right and left Euler angles ... 40
Figure 27 Train app view ... 41
Figure 28 Train app view buttons ... 41
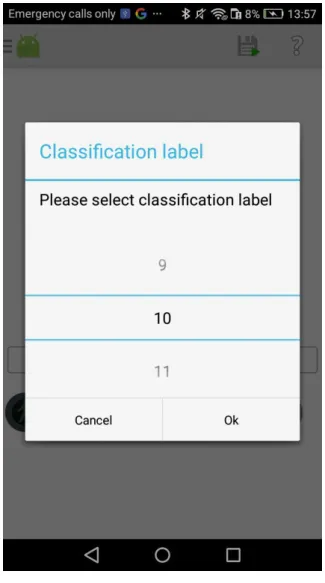
Figure 29 Classification label popup ... 42
Figure 30 Algorithm for training gait classifier ... 43
Figure 31 Dataset upload ... 44
Figure 32 Algorithm for classification of gait ... 45
Figure 33 Gait session result... 46
Figure 34 Shimmer drivers ... 48
Figure 35 Shimmer class. ... 48
Figure 36 Multiple Shimmer connection ... 49
Figure 37 Entity-Relationship model ... 50
Figure 38 REST API services ... 51
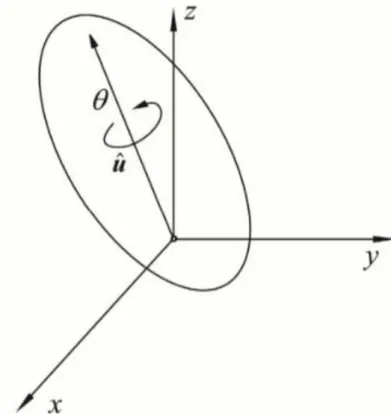
Figure 39 Axis- angle representation ... 55
Figure 40 Proper Euler angles ... 56
Figure 41 Euler angles ... 57
Figure 42 Shimmer3 calibration coordinates ... 57
Figure 43 Pitch, yaw and roll angles ... 58
Figure 44 Gimbal with 3 DoF and gimbal lock situation in which 1 DoF is lost ... 59
Figure 45 Unit quaternion parameters through relation with axis-angle ... 60
Figure 46 Heel strike detection using Euler angle ... 62
Figure 47 Gait cycles from right and left leg ... 64
Figure 48 Stride identification, from (RESNA, 2008) ... 65
Figure 49 Stride segments – Euler YY signal ... 66
Figure 50 Stride segments – Euler XX signal ... 66
Figure 51 Stride segments – Euler ZZ signal ... 66
Figure 52 Butterworth bandpass filter – Top: Frequency response. – Bottom: Right leg XX accelerometer original and filtered signal ... 67
Figure 53 Right leg - Top: YY accelerometer original and filtered signal – Bottom: ZZ accelerometer signal and filtered signal ... 68
Figure 54 Left leg - Top: XX accelerometer original and filtered signal – Bottom: YY accelerometer signal
and filtered signal ... 68
Figure 55 Left leg: ZZ accelerometer original and filtered signal ... 69
Figure 56 Right leg. Top: Low pass filter Frequency response –Bottom: XX Gyroscope original and filtered signal ... 69
Figure 57 Right leg. Top: YY Gyroscope original and filtered signal –Bottom: ZZ Gyroscope original and filtered signal ... 70
Figure 58 Left leg. Top: XX Gyroscope original and filtered signal –Bottom: YY Gyroscope original and filtered signal ... 70
Figure 59 Left leg: ZZ gyroscope original and filtered signal ... 71
Figure 60 Right leg. Top: XX magnetometer original and filtered signal –Bottom: YY magnetometer original and filtered signal ... 71
Figure 61 Right leg – ZZ magnetometer original and filtered signal... 72
Figure 62 Left leg. Top: XX magnetometer original and filtered signal –Bottom: YY magnetometer original and filtered signal ... 72
Figure 63 Left leg - ZZ Magnetometer original and filtered signal ... 73
Figure 64 Steps for applying supervised machine learning ... 76
Figure 65 Random Forests ... 78
List of Equations
Equation 1 Current timestamp ... 54
Equation 2 Unit vector... 59
Equation 3 Quaternion ... 59
Equation 4 q1 relation with the axis angle ... 60
Equation 5 q4 and q1 relation with the axis angle ... 60
Equation 6 q2 and q1 relation with the axis angle ... 60
Equation 7 q3 and q1 relation with the axis angle ... 60
Equation 8 Euler x ... 61
Equation 9 Euler y... 61
Equation 10 Euler z ... 61
Equation 11 Adaptive distance ... 62
Equation 12 Original signal heel strike index ... 63
Equation 13 Standard deviation ... 79
Equation 14 Skewness ... 80
Equation 15 Kurtosis ... 80
Equation 16 Area ... 80
Equation 17 Discrete Fourier Transform ... 81
Equation 18 Discrete wavelet transform ... 81
Equation 19 Approximate DWT coefficients ... 82
Equation 20 Detailed DWT coefficients ... 82
Equation 21 Precision ... 86
Equation 22 Recall ... 86
List of Acronyms
ADC - Analog-to-Digital converter API - Application Programming Interface
BP-ANN - Back propagation artificial neural network BDT - Binary Decision Trees
CART - Classification and Regression Tree DTs - Decision Trees
DWT - Discrete Wavelet Transform DoF Degrees of Freedom
DOI : Digital Object Identifier
DGI - Dynamic Gait Index FFT - Fast Fourier Transform FOG - Freezing of Gait GRF - Ground Reaction Force HS - Heel Strike
HSs - Heel Strikes HO - Heel-Off
IMU : Inertial Measurement Unit IMUs : Inertial Measurement Units IC - Initial Contact
IP - Internet Protocol IQR - Interquartile Range
JIA - Juvenile Idiopathic ArthritisS k-NN - k-Nearest Neighbours ML - Machine Learning
MAD - Mean Absolute Deviation
MEMs - Microelectrical-mechanical Systems MLP - Multilayer Perceptron
NN - Neural Networks
NND - Neurological and Neuromuscular Diseases NWS : Non-wearable Sensors
PD - Parkinson’s Sisease P2P - Peak-to-Peak amplitude PSD - Power Spectral Density RF - Random Forests
RAM - Random-access Memory ROM - Read-only Memory
REST - Representational State Transfer RPY - Roll, Pitch and Yaw
SSH - Secure Shell SPP - Serial Port Profile SL - Supervised Learning SVM - Support Vector Machines TC - Terminal contact
TS - Toe Strike TO - Toe-Off
TCP - Transmission Control Protocol WGAS - Wireless Gait Analysis Sensor WS - Wearable Sensors
Chapter 1 – Introduction
The aim of this work is to study abnormal gait signals, collected from wearable Shimmer3 devices and develop signal processing algorithms for feature extraction to feed machine-learning classifiers using Python, Java and Android languages, to build a wearable, non-intrusive remote low-cost mobile system to help monitor gait rehabilitation.
Gait analysis is an important human locomotion study to recognize normal or pathological patterns of walking, and its results have plenty of applications in medical programs (Lee & Lee, 2002), physical therapy (Kong, Sessa, Cosentino, & Zecca, 2013), and sports training (Muro-De-La-Herran, A., Garcia-Zapirain, & Mendez-Zorrilla, 2014). For example, with detailed gait feature analysis, therapists can quantify the rehabilitation progress of the patients after surgery, and the corresponding treatment and training can be customized according to an individual’s status (Zerin, Majumder, Ahamed, & Smith, 2015).
Wearable inertial sensors can be used to analyse human physical activity for prolonged periods of time and with minimal subject’s discomfort. Within this context, the assessment of gait in terms of quality and quantity is of great relevance since it provides indications of the level of physical mobility, of the risk of fall or of the effects of a therapy (Mannini, Trojaniello, Cereatti, & Sabatini, 2016).
Gait may reflect the motor capabilities of humans (Sun, Wang, & Banda, 2014). The information of the human behaviour in gait rehabilitation such as walking speed, walking distance, and gait pattern is very important for medical diagnosis of ambulation, progress of gait pattern, and estimation of energy consumption (Kong, Sessa, Cosentino, & Zecca, 2013)
From the clinical point of view, the importance of human gait analysis lies in the fact that gait disorders affect a high percentage of the world’s population and may be an expression of neurodegenerative diseases such as multiple sclerosis, amyotrophic lateral sclerosis or Parkinson’s disease, as well as in many others such as myelopathies, spinal amyotrophy, cerebellar ataxia, brain tumours, cranioencephalic trauma, neuromuscular diseases (myopathies), cerebrovascular pathologies, certain types of dementia, heart disease or ageing (Muro-De-La-Herran, A., Garcia-Zapirain, & Mendez-Zorrilla, 2014).
Rehabilitation can help elderly to regain their motor ability through physical training. Its efficacy on relieving pain, improving strength and mobility, and training the subject to perform important everyday tasks, has been demonstrated (Kong, Sessa, Cosentino, & Zecca, 2013). Usually, physical rehabilitation exercises are performed in specific medical centres. However, the high costs of special equipment and human resources, limit the number and availability of rehabilitation centres. As a result, a growing number of people, especially those who live in small communities, cannot enjoy the benefit of rehabilitation programs (Lee & Lee, 2002).
Changes in gait reveal key information about persons’ quality of life. This is of special interest when searching for reliable information on the evolution of different diseases:
(a) neurological diseases such as multiple sclerosis or Parkinson’s;
(b) systemic diseases such as cardiopathies (in which gait is clearly affected); (c) alterations in deambulation dynamic due to sequelae from stroke and
(d) diseases caused by ageing, which affect a large percentage of the population. Accurate reliable knowledge of gait characteristics at a given time, and even more importantly, monitoring and evaluating them over time, will enable early diagnosis of diseases and their complications and help to find the best treatment (Muro-De-La-Herran, A., Garcia-Zapirain, & Mendez-Zorrilla, 2014). The traditional scales used to analyse gait parameters in clinical conditions are subjective (Muro-De-La-Herran, A., Garcia-Zapirain, & Mendez-Zorrilla, 2014). In contrast to this background, progress in new technologies has given rise to devices and techniques which allow an objective evaluation of different gait parameters, resulting in more efficient measurement and providing specialists with a large amount of reliable information on patients’ gaits. This reduces the error margin caused by subjective techniques and permit to evaluate the recovery rithm so as to predict the recovery period duration.
Walking involves a series of complex movements associated with human lower limbs. Over the last few decades, important research has focused on gait analysis. From visual inspection, sensor technology, to motion capture system, various studies have led to different applications (Hsieh, et al., 2012).
The current gold standard that is the most reliable in performing gait analysis is believed to be the combination of motion capture system and force plate system, which
is able to provide both kinematic and kinetic information in spatial coordination, such as the VICON motion capture system and the Kistler force plate system (Hsieh, et al., 2012). Among them, the motion capture system is marker-based, requiring the subject to be placed with numerous markers on the body. It often takes more than an hour to place the markers on the subject. In addition, the force plate is mounted on the floor and is needed to be stepped by the subject correctly to obtain good results. As a result, the subject needed to be trained for the experiment, and the experiment could only be done in the professional motion laboratory that has trained operators and is able to afford the expensive equipment (Hsieh, et al., 2012).
Nowadays, gait analysis system can be classified into non-wearable sensors (NWS) based and wearable sensors (WS). NWS systems usually require optical sensors or pressure sensors on the floor (Hsieh, et al., 2012). Gait features are extracted by processing image or video data. WS systems are based on motion-recording sensors which are attached to moving subjects. Motion-record sensors (e.g., accelerometers, gyrometers, force sensors) are usually attached to various parts of the body such as the ankle, hip and waist (Sun, Wang, & Banda, 2014). Foot switches, plantar pressure sensors, and accelerometers have been used previously to evaluate human gait (Lee & Lee, 2002).
A simple and accurate measurement system is required to evaluate the efficiency of rehabilitation (Lee & Lee, 2002).
Inertial measurement units (IMUs) including combinations of accelerometers and gyroscopes have been successfully used for assessing gait characteristics (i.e., gait spatio-temporal parameters, gait variability) and the quality and quantity of physical activity in both healthy and motor impaired population (Mannini, Trojaniello, Cereatti, & Sabatini, 2016).
In this work, a wearable, non-intrusive affordable mobile system is presented allowing physiotherapy sessions local or remotely helping monitoring gait rehabilitation using a simple algorithm based on Euler angles and data collected from IMU devices positioned in the right leg shank. The Euler angles vary along the gait cycle depending on each type of gait. The algorithm consists on calculating the value of the Euler angles along with data from the accelerometer contained inside the Shimmer3 IMU. These values are used to calculate the standard deviation and the ratios of the Euler angles minimum absolute value to the Euler angles maximum value. The signal representing a person’s gait cycle
may have some differences concerning amplitude, shape, gait cycle duration depending on several characteristics like age, height and gender which makes it difficult to find fixed values of Euler angles and acceleration that can describe a gait type. Hence, rather than establishing fixed values to describe gait, it is important to find ratios. Regardless of the amplitude and cycle duration, experiments in this study showed that gait cycles from different persons tend to have similar ratios concerning same types of gait. For these reasons, the proposed algorithm calculates ratios of Euler angles absolute minimum values to Euler angles maximum values and takes also into consideration the percentage of time during a gait cycle where a typical value above a relative threshold describing a gait type occurs. Statistical measures like standard deviation is also taken into account.
This work contributions are:
• Heel strike detection algorithm. • Stride detection algorithm.
• Data alignment using a System timestamp.
• A simple wearable, non-intrusive affordable mobile framework that allows monitoring and remotely assistance of patients during gait rehabilitation.
• Publication of an article:
- Gait Rehabilitation Monitor: DOI: 10.1109/EHB.2017.7995455, : 2017 E-Health and Bioengineering Conference (EHB)
Chapter 2 – Related Work
Begg, Palaniswami and Owen apply an artificial intelligence technique [support vector machines (SVM)] for the automatic recognition of young-old gait types from their respective gait-patterns (Begg, Palaniswami, & Owen, 2005). One of the aims is to identify gait variables that reflect gait degeneration due to ageing that might have closer linkage to the causes of falls (Begg, Palaniswami, & Owen, 2005). This would help to undertake appropriate measures to prevent falls (Begg, Palaniswami, & Owen, 2005). Like in many other developed countries, falls in older population has been identified as a major health issue in Australia, costing the community ~2.4 $billion per annum (Begg, Palaniswami, & Owen, 2005). It has been suggested that more sensitive gait variables such as foot clearance during walking over the walking surface should be used to describe age-related declines in gait in an effort to find predictors of falls risk (Begg, Palaniswami, & Owen, 2005). Early identification of at-risk gait in older population provides the opportunity to undertake measures to prevent falls (Begg, Palaniswami, & Owen, 2005). At present, research in the area of automatic identification of gait types from their gait features is less prevalent (Begg, Palaniswami, & Owen, 2005). Neural network (NN) technology has been employed to classify various gait types (Begg, Palaniswami, & Owen, 2005). For instance, Barton and Lees applied NN to differentiate simulated gait (e.g., leg length discrepancy) using features from lower-limb joint-angle measures, while Holzreiterand Kohle applied NNs for classification of normal and pathological gait using force platform recordings of foot-ground reaction forces (Begg, Palaniswami, & Owen, 2005).
Seong-Beom Koh et. al investigated gait dynamics and kinematics in patients with Parkinson’s disease (PD) and correlated these features with the predominant clinical features and with the presence of the freezing of gait (FOG) and also measured the temporospatial and kinematic parameters of gait in 30 patients with PD using a computerized video motion analysis system (Koh, Park, Lee, Kim, & Yoon, 2008).
A method for measuring human gait posture using wearable sensors was proposed by Takeda et al. The sensor used consist of a tri-axial acceleration sensor and three gyro sensors aligned on three axes. These are worn on the abdomen and the lower limb segments (both thighs, both shanks and both feet) to measure acceleration and angular velocity during walking (Takeda, Tadano, Todoh, & Yoshinari, 2009). Three dimensional positions of each lower limb joint are calculated from segment lengths and joint angles
(Takeda, Tadano, Todoh, & Yoshinari, 2009). Segment lengths are calculated by physical measurement and joint angles can be estimated mechanically from the gravitational acceleration along the anterior axis of the segments (Takeda, Tadano, Todoh, & Yoshinari, 2009). Because the cyclic patterns of acceleration data can be found during constant walking, a FFT analysis was applied to obtain some characteristic frequencies (Takeda, Tadano, Todoh, & Yoshinari, 2009). Gait analysis is an important clinical tool for diagnosing patients with walking disabilities (Takeda, Tadano, Todoh, & Yoshinari, 2009). Currently, the main method for gait analysis is done by tracking a patient’s movement through camera-based analysis systems, like the Vicon motion analysis system (Vicon Motion Systems, Inc.) (Takeda, Tadano, Todoh, & Yoshinari, 2009).
Secondary quantities such as velocity, displacement and joint angles can be calculated through integration of acceleration and angular velocities (Charry, T.H. Lai, Begg, & Palaniswami, 2009). It is broadly accepted that this procedure is significantly influenced by accumulative errors due to integration, arising from sensor noise, non-linearities and asymmetrical sensitivity/offset signals and bias drifts (Charry, T.H. Lai, Begg, & Palaniswami, 2009). Charry et al. assess the effectiveness of applying band-pass filtering to raw inertial sensor data under the assumption that sensor drift errors occur in the low frequency spectrum. The normalized correlation coefficient ρ of the Fast Fourier Transform (FFT) spectra corresponding to vertical toe acceleration from inertial sensors and from a video capture system as a function of digital band-pass filter parameters is compared. MEMs provide the possibility to measure physical quantities such as accelerations and angular velocities using smaller and cheaper inertial sensors (Charry, T.H. Lai, Begg, & Palaniswami, 2009). These inertial measurement units (IMUs) generally consist of accelerometers and gyroscopes. In gait analysis, reduced sensor sizes promise better portability and opens avenues to research of gait in natural environments (Charry, T.H. Lai, Begg, & Palaniswami, 2009). Recent studies have begun applying inertial sensor technologies to monitoring gait, in particular foot motion (Charry, T.H. Lai, Begg, & Palaniswami, 2009). Charry et al. work revealed that inertial sensors can show good performance comparable to video-based systems (Charry, T.H. Lai, Begg, & Palaniswami, 2009). A simple technique such as band pass filtering instead of low pass filtering can remove a large source of sensor error and potentially minimize the requirement for more complex methods such as gait event detections and strap down integration (Charry, T.H. Lai, Begg, & Palaniswami, 2009). This could reduce the
computational needs of future on-chip implementations of algorithms and portable devices for measuring displacement and velocities from inertial sensors (Charry, T.H. Lai, Begg, & Palaniswami, 2009).
Stéphane Bonnet and Pierre Jallon presented a technique for recognition of different gait conditions from body-worn sensor data. A sensor located at subject’s shank, is a combination of a 3-D accelerometer and a 3-D magnetometer (Bonnet & Jallon, 2010). Stride detection method relies on the use of the sole magnetometer readings (Bonnet & Jallon, 2010). Feature extraction combines both modalities in an original manner and spatial, temporal, and angular parameters are extracted for subsequent classification (Bonnet & Jallon, 2010). Hidden Markov models are employed to identify the types of gait being performed (Bonnet & Jallon, 2010). Different feature modelizations are typically considered with the use of Gaussian mixture laws (Bonnet & Jallon, 2010). Inertial Microelectrical-mechanical systems (MEMs)-based technology is well suited for long-term ambulatory monitoring of physical activity (Bonnet & Jallon, 2010). Indeed, accelerometers and gyroscopes are highly-integrated chips that can be embedded into low-power body-worn sensor nodes with on-board memory capability (Bonnet & Jallon, 2010). Several biomedical applications have been designed with this unique capability of remote (from the hospital) monitoring of physical activity (Bonnet & Jallon, 2010). Several articles have been published on the topic of gait classification from video cameras or from body-worn sensors, where gait features are either based on temporal, spatial or angular gait parameters (Bonnet & Jallon, 2010). The approach proposed by Bonnet and Jallon is carried out in two distinct steps with first the identification of stride events along with their characterization and second the stride classification, i.e., the determination of the associated gait class using hidden Markov models (Bonnet & Jallon, 2010).
Using inertial sensors to track motion is so appealing because the inertial sensors are not confined to the dependence of external auxiliary devices in comparison to the camera-based motion tracking system (Zhou, Chen, & X. Lu, 2013). A self-contained integrated sensor module will satisfy the motion capture requirements (Zhou, Chen, & X. Lu, 2013). Some researchers carry out the motion tracking technique only using accelerometers in a relatively simple way while some others are using a sophisticated method with accelerometers, gyroscopes and magnetometers combinedly (Zhou, Chen, & X. Lu, 2013).
Alcaraz et. al (Alcaraz, Moghaddamnia, & Peissig, 2015) proposed a system using an IMU Shimmer2R and an Android application for mobile gait performance evaluation and feedback where the extraction of important features from accelerometer raw data in both time and frequency domain are considered to be used in gait classification where each peak within a data window is processed to distinguish between normal and abnormal gait.
G. Cola et. al, (Cola, Avvenuti, Vecchio, Z., & Lo, 2015) proposed a method using k-Nearest Neighbours for capturing deviation in gait using a wearable tri-axial accelerometer placed at the waist (Shimmer2R IMU). To this purpose, eleven acceleration-based features were extracted and provided as inputs to an anomaly detection algorithm. Gait is detected by analysing the peaks in the acceleration magnitude, which are generated by the ground reaction force when the foot hits the ground. A new gait segment is detected when eight consecutive steps are found. Feature selection was performed by means of a greedy heuristic approach, starting from a set of 43 features (Cola, Avvenuti, Vecchio, Z., & Lo, 2015). The optimized metric was the average classification accuracy obtained by the anomaly detection algorithm. Mean, median, Peak-to-Peak amplitude (P2P), RMS, standard deviation, and Zero Crossing Rate (ZCR) are statistical measures which have been widely used for activity recognition purposes. Duration is the duration of the gait segment (Cola, Avvenuti, Vecchio, Z., & Lo, 2015). The proposed anomaly detection algorithm is a binary classifier based on k-Nearest Neighbours (k-NN) analysis. Gait instances are either classified as abnormal (positive) or normal (negative) (Cola, Avvenuti, Vecchio, Z., & Lo, 2015).
A. Ramp et al. (Rampp, et al., 2015) presented a method that is able to calculate clinically relevant gait parameters from inertial sensor data of gait sequences. For data collection, the inertial sensor platform Shimmer 2R was used. It consists of a three-axis gyroscope (range: ±500 ◦/s) and a three-axis accelerometer (range: ±6 g). Subjects wore shoes with a sensor placed laterally right below each ankle joint. To apply the stride segmentation, a template of a single stride was defined manually from the gyroscope z-axis. To segment strides, the algorithm searched for parts in the continuous signal that were similar to the template (Rampp, et al., 2015). To generate a step template, the complete data from template dataset was used. This dataset included only gait exercises where subjects walked straight on a ten-meter track for four times. In this special case, peak detection was used to extract steps. Peak detection is done on the gyroscope data from the sagittal plane by searching for local maxima, which corresponded to mid swing
and the minima before and after. With this information the gait cycle was defined, and all extracted steps were interpolated to 200 samples. This was done to build an averaged step out of 25 datasets and 681 resulting steps. At Heel Strike (HS), the foot decelerates abruptly when the heel hits the ground. To detect HS, only the segment between the absolute maximum and the end of the first half of the gyroscope’s z-axis signal was considered. Within this segment, HS was found by searching for the minimum between the point of the steepest negative slope and the point of steepest positive slope in following signal (Rampp, et al., 2015).
Ranveer Joyseeree, Rami Abou Sabha and Henning Mueller presented a machine -learning framework to identify the specific disease afflicting certain patients using only gait analysis data. Classifying such data into disease types consumes valuable clinical time that may be better spent. Effective classification also facilitates its future retrieval (Joyseeree, Sabha, & Müller, 2015). A machine-learning framework to identify the specific disease afflicting certain patients using only gait analysis data is presented (Joyseeree, Sabha, & Müller, 2015). Classifying such data into disease types consumes valuable clinical time that may be better spent (Joyseeree, Sabha, & Müller, 2015).Effective classification also facilitates its future retrieval (Joyseeree, Sabha, & Müller, 2015). To classify the data into one of the three categories: healthy, Neurological and Neuromuscular Diseases (NND), and Juvenile Idiopathic Arthritis (JIA), certain parameters were carefully selected from them and used to train Random Forest (RF), boosting, Multilayer Perceptron (MLP), and SVM classifiers (Joyseeree, Sabha, & Müller, 2015). Gait analysis has been carried out for decades and it involves the measurement and detailed study of quantities associated with human locomotion (Joyseeree, Sabha, & Müller, 2015). Currently, these quantities are collected using a range of sensors and are saved in an appropriate format for future reference (Joyseeree, Sabha, & Müller, 2015). Analysis of the locomotion of patients can greatly help clinicians in the diagnosis of the type of disease afflicting the former (Joyseeree, Sabha, & Müller, 2015). Accurate diagnoses allow the patient to receive the appropriate care as soon as possible, which minimises their suffering and allows them to enjoy an improved quality of life (Joyseeree, Sabha, & Müller, 2015). Automating the process of classifying gait data can therefore allow clinicians to better invest their time in other care-giving activities (Joyseeree, Sabha, & Müller, 2015). The main purpose of Joyseeree, Sabhab and Mueller study is to facilitate the automatic classification of gait data in terms of disease type. Successful classification will facilitate the retrieval of archived gait information to complement new studies. To achieve those objectives, a machine learning algorithm is proposed. It is tested on images of healthy individuals, patients affected by Neurological and Neuromuscular Diseases (NND), and
those affected by Juvenile Idiopathic Arthritis (JIA) (Joyseeree, Sabha, & Müller, 2015). Zheng et al. used Random Forests (RF) and KStar to discriminate between neuro-degenerative diseases (Joyseeree, Sabha, & Müller, 2015).
Gait analysis using wearable wireless sensors can be an economical, convenient and effective way to provide diagnostic and clinical information for various health-related issues (Nukala, et al., 2016). In Nukala, et al work a custom designed low-cost wireless gait analysis sensor that contains a basic inertial measurement unit (IMU) was used to collect the gait data for four patients diagnosed with balance disorders and additionally three normal subjects, each performing the Dynamic Gait Index (DGI) tests while wearing the custom wireless gait analysis sensor (WGAS) (Nukala, et al., 2016). The raw gait data are wirelessly transmitted from the WGAS to a near-by PC for real-time gait data collection and analysis (Nukala, et al., 2016). Algorithms as back propagation artificial neural network (BP-ANN), support vector machine (SVM), k-nearest neighbours (KNN) and binary decision trees (BDT) were used based on features extracted from the raw gait data of the gyroscopes and accelerometers (Nukala, et al., 2016). Nukala et al. results show that gait data collected from their very low-cost wearable wireless gait sensor can effectively differentiate patients with balance disorders from normal subjects in real time using various classifiers, the success of which may eventually lead to accurate and objective diagnosis of abnormal human gaits and their underlying etiologies in the future, as more patient data are being collected. A basic IMU that includes 3D gyroscopes and accelerometers can measure angular velocity and linear acceleration for each of the X/Y/Z axes, respectively, and these inexpensive IMUs have been used as wearable sensors that provide a powerful option for human gait analysis (Nukala, et al., 2016). Aminian et al. and Selles et al. reported methods of measuring both terminal contact (TC) that defines the beginning of the swing phase, as well as the initial contact (IC) that defines the beginning of the gait cycle timing information using those body-worn sensors (Nukala, et al., 2016). On the other hand, Yoshida et al. used an accelerometer/IMU sensor attached to the patient’s waist and observed frequency peaks in the anterior plane to detect leg injury (Nukala, et al., 2016). Boutaayamou et al. developed a signal processing algorithm to automatically extract, on a stride-by-stride basis, four consecutive fundamental events of walking, i.e., HS, toe strike (TS), heel-off (HO) and toe-off (TO), from wireless accelerometers applied to the right and left foot (Nukala, et al., 2016). An ambulatory
monitoring method using an IMU sensor for patients with Parkinson’s disease has also been developed (Nukala, et al., 2016).
In recent years, a weighty research effort which focuses on the monitoring and recognition of human activity patterns which collected via motion sensors has been witnessed (Erdaş, Atasoy, Açıcı, & Oğul, 2016). Various application domains contain activity recognition technologies such as health and elder care or sportive motion tracker devices (Erdaş, Atasoy, Açıcı, & Oğul, 2016). Many previous studies have proposed to use an accelerometer sensor to accomplish the recognition process (Erdaş, Atasoy, Açıcı, & Oğul, 2016). Accelerometers have been widely accepted devices for measuring personal daily activities such as walking, standing and running owing to their minimal size, low power requirements, cost and the ability of producing data directly from the motion (Erdaş, Atasoy, Açıcı, & Oğul, 2016). Previous researches have shown that machine learning methodologies are effective for classification of different activities from sensor data (Erdaş, Atasoy, Açıcı, & Oğul, 2016). They often operate in two steps: First, relevant features are calculated from accelerometer signal data (Erdaş, Atasoy, Açıcı, & Oğul, 2016). Then a classifier algorithm is used to determine the activity corresponding to those features (Erdaş, Atasoy, Açıcı, & Oğul, 2016). The common features involve the statistics extracted from time-domain signal analysis, frequency-domain analysis and wavelet analysis, which is also referred as time-frequency analysis (Erdaş, Atasoy, Açıcı, & Oğul, 2016). Activity recognition problem is considered as a supervised classification task where a subsequence of accelerometer reads is fed into a machine learning classifier (Erdaş, Atasoy, Açıcı, & Oğul, 2016). The input data is normalized as to have a mean of zero and a standard deviation of one. The features are extracted from segmented parts of normalized data where a segment refers to a number of consecutive accelerometers reads (Erdaş, Atasoy, Açıcı, & Oğul, 2016). Fixed length segments are used since no prior knowledge is available about activity boundaries. Assuming that any activity can exhibit at least one of its cycles in 4 seconds, each segment is built to have 208 samples (Erdaş, Atasoy, Açıcı, & Oğul, 2016). An overlap of 50% in length is allowed between two consecutive samples as in previous works (Erdaş, Atasoy, Açıcı, & Oğul, 2016). In classification stage, several machine learning classifiers are employed, i.e., Random Forest, k-Nearest Neighbour (kNN), and Support Vector Machine (SVM) (Erdaş, Atasoy, Açıcı, & Oğul, 2016).
Remote care and telemonitoring have become essential component of current geriatric medicine. Intelligent use of wireless sensors is a major issue in relevant computational studies to realize these concepts in practice (Açıcı, et al., 2017). While there has been a growing interest in recognizing daily activities of patients through wearable sensors, the efforts towards utilizing the streaming data from these sensors for clinical practices are limited (Açıcı, et al., 2017). Açıcı, et al present a practical application of clinical data mining from wearable sensors with a particular objective of diagnosing Parkinson’s Disease from gait analysis through a sets of ground reaction force (GRF) sensors worn under the foots, introducing a supervised learning method based on Random Forests that analyse the multi-sensor data to classify the person wearing these sensors, extracting a set of time-domain and frequency-domain features that would be effective in distinguishing normal and diseased people from their gait signals.
It is important to remotely detect the physical activity of PD patients to treat the patients more adequately and to increase their quality of life (Açıcı, et al., 2017). An accelerometer mounted on the knee has been experimentally demonstrated in several studies where the values recorded from the sensor are significantly different when compared to healthy and PD patients marches and therefore can be used for long-term gait analysis of accelerometer sensors (Açıcı, et al., 2017). 2.1. Gait abnormalities
Normal human walking and running can be defined as a method of locomotion involving the use of the two legs, alternately, to provide both support and propulsion (Levine, Richards, & Whittle, 2012). In order to exclude running, we must add at least one foot being in contact with the ground at all times (Levine, Richards, & Whittle, 2012).
Most people tend to use the words gait and walking interchangeably (Levine, Richards, & Whittle, 2012). However, there is a difference: the word gait describes the manner or style of walking, rather than the process of walking itself (Levine, Richards, & Whittle, 2012).It thus makes more sense to talk about a difference in gait between two individuals than about a difference in walking (Levine, Richards, & Whittle, 2012).
There is an identifiable pattern of walking and a normal range can be defined for all of the variables which can be measured (Levine, Richards, & Whittle, 2012). Pathology of the locomotor system frequently produces gait patterns which are clearly abnormal (Levine, Richards, & Whittle, 2012).
For a person to walk, the locomotor system must be able to accomplish 4 things (Levine, Richards, & Whittle, 2012):
1. Each leg in turn must be able to support the body weight without collapsing (Levine, Richards, & Whittle, 2012).
2. Balance must be maintained, either statically or dynamically, during single leg stance (Levine, Richards, & Whittle, 2012).
3. The swinging leg must be able to advance to a position where it can take over the supporting role (Levine, Richards, & Whittle, 2012).
4. Enough power must be provided to make the necessary limb movements and to advance the trunk (Levine, Richards, & Whittle, 2012).
In normal walking, all of these are achieved without any apparent difficulty and with a modest energy consumption (Levine, Richards, & Whittle, 2012). However, in many forms of pathological gait they can be accomplished only by means of abnormal movements (Levine, Richards, & Whittle, 2012).
Abnormal gait may result from a disorder in any part of the locomotor system, including the brain, spinal cord, nerves, muscles, joints and skeleton and may also result from the presence of pain (Levine, Richards, & Whittle, 2012).
The most common gait abnormalities are (Levine, Richards, & Whittle, 2012): 1. Lateral trunk bending: bending the trunk towards the side of the supporting limb
during the stance phase. Due to inadequate hip abductors, the pelvis drops on the unsupported side when one foot is lifted off the ground. To compensate, the subject bends the trunk over the supporting hip (Levine, Richards, & Whittle, 2012).
2. Anterior trunk bending: subject flexes the trunk forwards early in the stance phase. If only one leg is affected, the trunk is straightened again around the time of opposite initial contact. If both sides are affected, the trunk may be kept flexed throughout the gait cycle (Levine, Richards, & Whittle, 2012).
3. Posterior trunk bending: In normal walking, the line of force early in the stance phase passes in front of the hip; posterior trunk bending brings the line of force behind the hip, to compensate for weak hip extensors (Levine, Richards, & Whittle, 2012).
Figure 2 Anterior trunk bending, from (Levine, Richards, & Whittle, 2012)
4. Increased lumbar lordosis: When there is a fixed flexion deformity of the hip (left panel), the whole pelvis must rotate forwards for the femur to move into a vertical position (right panel) with a resulting increase in lumbar lordosis (Levine, Richards, & Whittle, 2012).
5. Functional leg length discrepancy
• Circumduction: the swinging leg moves in arc, rather than straight forwards, to increase the ground clearance for the swing foot (Levine, Richards, & Whittle, 2012).
Figure 4 Increased Lumbar Lordosis, from (Levine, Richards, & Whittle, 2012)
• Hip hiking: the swing phase leg is lifted by raising the pelvis on that side (Levine, Richards, & Whittle, 2012).
• Steppage: increased hip and knee flexion improve ground clearance for the swing phase leg, in this case necessitated by a foot drop (Levine, Richards, & Whittle, 2012).
Figure 6 Hip hiking, from (Levine, Richards, & Whittle, 2012)
• Vaulting: the subject goes up on the toes of the stance phase leg to increase ground clearance for the swing phase leg (Levine, Richards, & Whittle, 2012).
6. Abnormal hip rotation: abnormal rotation at the hip involves the whole leg, with the foot showing an abnormal toe in or toe out alignment (Levine, Richards, & Whittle, 2012).
7. Excessive knee extension: the normal stance phase flexion of the knee is lost, to be replaced by full extension or even hyperextension, in which the knee is angulated backwards, this best seen from the side (Levine, Richards, & Whittle, 2012). 8. Excessive knee flexion: in late stance phase there is increased knee flexion, caused
by a flexion contracture of the hip (Levine, Richards, & Whittle, 2012).
Figure 9 Excessive knee flexion, from (Levine, Richards, & Whittle, 2012) Figure 8 Vaulting, from (Levine, Richards, & Whittle, 2012)
9. Inadequate dorsiflexion control: may result from weakness or paralysis of the anterior tibial muscles or from these muscles being overpowered by spasticity of the triceps surae (Levine, Richards, & Whittle, 2012). An inability to dorsiflex the foot during the swing phase causes a functional length discrepancy (Levine, Richards, & Whittle, 2012). During load response, the dorsiflexors resist the external plantarflexion moment, thus permitting the foot to be lowered to the ground gently (Levine, Richards, & Whittle, 2012). If they are weak, the foot is lowered abruptly in a foot slap (Levine, Richards, & Whittle, 2012). The dorsiflexors are also active during the swing phase, when they are used to raise the foot and achieve ground clearance (Levine, Richards, & Whittle, 2012). Failure to raise the foot sufficiently during initial swing may cause toe drag (Levine, Richards, & Whittle, 2012).
10. Abnormal foot contact: The foot may be abnormally loaded so that the weight is primarily borne on only one of its four quadrants (Levine, Richards, & Whittle, 2012).
11. Abnormal foot rotation: normal individuals place the foot on the ground approximately in line with the direction of walk, typically with a few degrees of toe out (Levine, Richards, & Whittle, 2012). Pathological toe in or toe out angles may be produced by internal or external hip rotation, torsion (twisting) of the femur or tibia, or deformity of the foot itself (Levine, Richards, & Whittle, 2012).
12. Insufficient push off: the weight is taken primarily on the heel and there is no push-off phase (Levine, Richards, & Whittle, 2012).
13. Abnormal walking base: the foot is placed on the ground wider apart than usual. This can be caused by the fear of falling and instability or by a deformity like abducted hip or valgus knee (Levine, Richards, & Whittle, 2012).
14. Rhythmic disturbances:
• Asymmetrical rhythmic disturbance: difference in the gait timing between the two legs (Levine, Richards, & Whittle, 2012).
• Irregular rhythmic disturbance: differences between one stride and the next (Levine, Richards, & Whittle, 2012).
2.2. Gait cycle
According to Figure 12 the events in a cycle are:
• Initial contact: Right initial contact occurs while the left foot is still on the ground and there is a period of double support (double limb stance) between initial contact on the right and toe off on the left.
• Opposite toe off • Heel rise
• Opposite initial contact • Toe off
• Feet adjacent • Tibia vertical
These seven events subdivide the gait cycle into seven periods, four of which occur in the stance phase, when the foot is on the ground, and three in the swing phase, when the foot is moving forward through the air (Kharb, Saini, Jain, & Dhiman, 2011).
The stance phase lasts from initial contact to toe off and includes the periods (Kharb, Saini, Jain, & Dhiman, 2011):
• Loading response • Mid-stance • Terminal stance • Pre - swing
The swing phase lasts from toe off to the next initial contact and includes the periods (Kharb, Saini, Jain, & Dhiman, 2011):
• Initial swing • Mid-swing
• Terminal swing.
During the swing phase on the left side, only the right foot is on the ground, giving a period of right single support (or single limb stance), which ends with initial contact by the left foot. There is then another period of double support, until toe off on the right side (Kharb, Saini, Jain, & Dhiman, 2011).
Left single support corresponds to the right swing phase and the cycle ends with the next initial contact on the right. In each double support phase, one foot is forward, having just landed on the ground, and the other one is backward, being just about to leave the ground (Kharb, Saini, Jain, & Dhiman, 2011).
The duration of a complete gait cycle is known as the cycle time, which is divided into stance time and swing time (Kharb, Saini, Jain, & Dhiman, 2011).
In each gait cycle, there are two periods of double support and two periods of single support. The stance phase usually lasts about 60% of the cycle, the swing phase about 40% and each period of double support about 10% (Kharb, Saini, Jain, & Dhiman, 2011). The final disappearance of the double support phase marks the transition from walking to running. Between successive steps in running there is a flight phase, also known as the float, double-float or non-support phase, when neither foot is on the ground (Kharb, Saini, Jain, & Dhiman, 2011).
A stride consists of two successive placements of the same foot (Kharb, Saini, Jain, & Dhiman, 2011).
Each stride contains eight functional patterns (functional intervals phases).
The sequential combination of this phases enables the limb to accomplish three basic tasks (Kharb, Saini, Jain, & Dhiman, 2011). The tasks are:
• Weight acceptance task phases:
- Initial contact: heel contact to the ground (Streifeneder ortho.production GmbH, 2018).
- Loading response: shock absorption in knee and ankle joint, load transmission and stability in the hip, forward motion by heel rocker (Streifeneder ortho.production GmbH, 2018).
• Single limb support task phases:
- Mid stance phase: controlled forward motion of the tibia, shifting of the gravity centre to the front by ankle rocker (Streifeneder ortho.production GmbH, 2018).
- Terminal stance phase: controlled dorsal extension at the ankle joint with lifting the heel from the ground (Streifeneder ortho.production GmbH, 2018).
• Limb advancement task phases:
- Pre-swing: passive knee joint flexion of 40°, plantar flexion of the ankle joint (Streifeneder ortho.production GmbH, 2018).
- Initial swing: minimum 55° knee flexion for enough ground clearance (Streifeneder ortho.production GmbH, 2018).
- Mid swing: increasing hip flexion to 25°, dorsal extension of the ankle joint to neutral-zero-position (Streifeneder ortho.production GmbH, 2018). - Terminal swing: knee joint extension to neutral-flexion, preparation for
stance phase (Streifeneder ortho.production GmbH, 2018).
The stride length is the distance between two successive placements of the same foot. It consists of two step lengths, left and right, each of which is the distance by which the named foot moves forward in front of the other one. This definition of a stride is not applicable in some pathological gaits, in which one foot makes a series of hopping movements while the other is in the air (Kharb, Saini, Jain, & Dhiman, 2011).
Chapter 3 – System description
The proposed system is comprised by an Android Smartphone and an Android app developed for the purpose that controls the system, a remote server using Java and Python programming languages for data processing and classification using machine-learning, a database and two Shimmer3 devices.
The system architecture is illustrated in Figure 13. Shimmer3 devices (Figure 14) are IMUs that include an accelerometer, a gyroscope and magnetometer, all tri-axial. In the presented system Shimmer devices are attached to the person’s both legs shanks and are connected to the Android app via Bluetooth.
Figure 13 System architecture
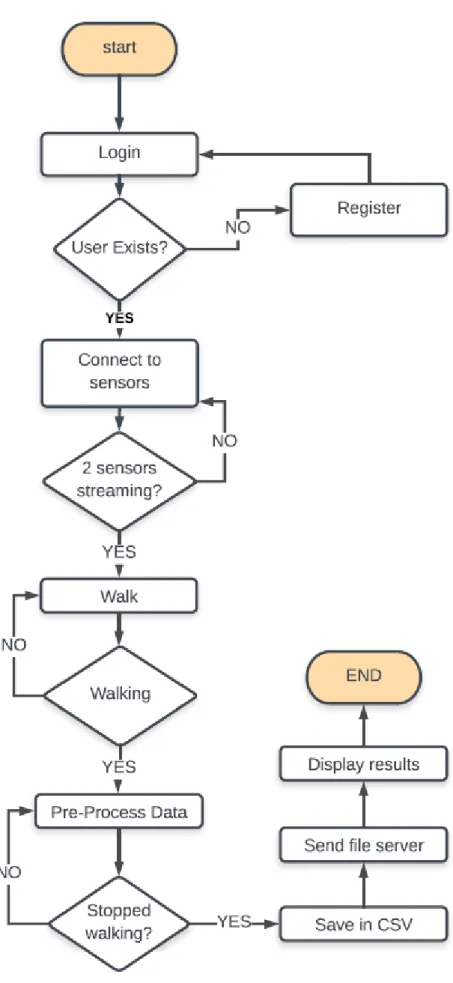
The system smartphone starts the communication with the paired Bluetooth devices. Streaming of both Shimmer devices is initiated by pressing the start streaming app buttons, provided by the open source shimmer drivers software, shown in Figure 15.
From the developed app menus, a user can choose to make a test or train the classifier, as show in Figure 16.
Immediately after user starts walking by pressing the walk app button, Figure 17, the raw data from the tri-axis accelerometer, gyroscope and magnetometer is collected, pre-processed and assembled in a csv file.
Whether it is a gait test session to monitor gait or a gait train session to train the classifier, data is sent over the internet to the server invoking the developed API. The invoked services provided by the available server API manages the file storage and processes data executing python scripts. It also creates a response that is sent back to the client app. The server response includes the test and train results, and the storage successfulness in case of storing files for later processing. The classification model and the test results are persisted in a local PostgreSQL database.
Figure 16 Left side: Gait session menu. Right side: Train classifier menu
3.1. Hardware – Shimmer3 device
The hardware of the system includes 2 Shimmer3 IMU. Shimmer3 is a small wireless sensor device, well suited for wearable applications. The integrated kinematic sensors, large storage and low-power standards-based communication capabilities enable emerging applications in motion capture, long-term data acquisition and real-time monitoring.
3.1.1. Shimmer3 coordinate system
Shimmer3 coordinate system used to calibrate the device is displayed in Figure 18
3.1.2. Shimmer3 calibration
When acquiring data from a Shimmer device the data is output in raw Analog-to-Digital converter (ADC) values. To convert the raw ADC values to standard units, e.g., m/s2, degrees/s, and obtain calibrated data, calibration parameters must be applied to these raw values. Shimmer 9DoF Calibration Application allows the calculation of the calibration parameters for a tri-axial accelerometer, gyroscope and magnetometer (Shimmer, 2017).
If the Shimmer device is calibrated correctly the location of the “−1” and “1” values in the alignment matrix should be as in Figures 19, 20 and 21, as it determines the alignment of the sensors.
The calibration parameters are: the offset vector that defines the zero offset for each axes of the tri-axial sensor, the sensitivity matrix that defines the sensitivity of each axes
The alignment matrix can be used to (Shimmer, 2017):
• allow the user to define to which axes they wish to assign the name x-axis, y-axis and z-y-axis.
• define which direction they wish to be considered the positive direction of the measuring axis
• correct for Shimmer design discrepancies whereby the XYZ outputs of each sensor do not agree.
• correct for any misalignment of axes within each sensor, i.e., the fact that all three axes are not perfectly orthogonal
Figure 19 shows the panel to calibrate the accelerometer. The accelerometer option is set to the default Low Noise option and the default range is +-2g.
The gyroscope calibration panel and calibration parameters are illustrated in Figure 20 with a sensitivity range, in this example, of 500 dps.
Figure 21 depicts the magnetometer panel and calibration parameters. The graphics of the calibrated magnetometer output, in Figure 21, should each display a unit circle centred at (0,0) when the magnetometer is rotated about all of its axes (Shimmer, 2017).
Figure 20 Shimmer3 gyroscope calibration parameters, from (9DoF Calibration Application 2017)
3.1.3. Shimmer3 key features
Figure 22 depicts Shimmer3 mainboard key features:
3.2. Software
This section describes the software developed and used in the described System. 3.2.1. Android app
The developed Android app was developed based on Multi Shimmer Template example and on Shimmer drivers (Shimmer, 2016).
´The app features are: • Login
• Registration
• Shimmer connection • Plot signals
• Train classifier • Gait test session
Login view, Figure 23, holds username, user ID, password, and server IP. Users’ details are persisted in a PostgreSQL database. Users log in into the system with SSH2 implemented via JSch, Java Secure Channel, and port forwarding.
SSH provides support for secure remote login, secure file transfer, and secure TCP/IP and X11 forwarding from port 22 to application server listening port. It can automatically encrypt, authenticate, and compress transmitted data.
For not registered users a register must be done to make login into the system and use the app. The input data is the same as the login and uses the same SSH2 network protocol. The register app view is shown in Figure 24.
Shimmer open-source available drivers are used to connect the app to the Shimmer3 devices. This open-source functionality has been developed by Shimmer and has been integrated in the system app. Figure 25 illustrates this functionality. The red led displayed is lit when the Shimmer3 devices are not connected. The led colour may change to yellow (connecting), green (connected) and to blue (streaming).
The signal collected from Shimmer3 devices may be plotted in a graphic. In Figure 26 Euler angles acquired from right and left Shimmer3 devices are displayed in a graphic.
Figure 25 Shimmer driver
The data transmitted by the Bluetooth devices is assembled by the app in a csv file and sent over to the server using SSH2. The classifier is trained, and the new model becomes automatically active.
Any tests performed after this step will be processed using the new classifier model, persisted in the system database.
Figure 27 shows the train feature app view. This view differs from the walk view in that it has two extra buttons, save button to save the data in the server and train button to train the classifier. In Figure 28 the buttons with legend are displayed.
Figure 27 Train app view
The label button in Figure 28 is an important feature because the system classifier is supervised, and data must be labelled to train the classifier. Figure 29 illustrates the view displayed after pressing label button.
Train classifier feature enables the app to collect data after pressing the start button. After stopping walking and pressing the train button a command to train the classifier is executed based on the performed gait session. The flow that follows in Figure 30 illustrates algorithm for training gait classifier.
The Algorithm for training gait classifier depicted in Figure 30 consists on storing data in database for later processing. When the session is done, the classifier is trained, and the model persisted in database becoming the available model. As soon as the data is stored in database, the server sends back a response, as illustrated in Figure 31:
A gait test session is performed to monitor the user’s gait assuming the classifier has been previously trained, and a classification model is ready and available. For a gait test session to be performed the user must be registered.
As represented in Figure 32 the algorithm for classification of gait starts with the user validation. If the user is not registered, he must register to proceed with login. After logging in, the test data is collected. The result of the test is displayed in the app, after stopping walking. The gait test session result from the server is displayed as illustrated in Figure 33, showing the identified gait.
3.2.2. Shimmer drivers
Data is acquired from the Shimmer3 devices using open-source Shimmer drivers’ class (Shimmer, 2016) to make the connection with the Android Smartphone and transfer data over Bluetooth.
The Shimmer drivers are: • ShimmerDriver
• ShimmerAndroidInstrumentDriver.
Shimmer drivers are illustrated in Figure 34.
The most important java classes from Shimmer drivers in this work are: • ShimmerObject.java
– Abstract class that contains important methods to process and manage threads running the connections with the Shimmer Bluetooth devices. Bluetooth packets are processed and transformed in to clusters (ObjectCluster java objects) which carry all the raw data collected as well as samples’ timestamps. Class from ShimmerDriver.
• ShimmerBluetooth.java
– In ShimmerDriver driver, abstract class that extends ShimmerObject.class and belongs to driver ShimmerDriver. Contains methods related to data streaming over Bluetooth.
• ObjectCluster.java
- represents data from tri-axial accelerometer, gyroscope and magnetometer received from Shimmer3 devices over Bluetooth and have instance variables such as the device name, device Bluetooth address, raw data. This class belongs to driver ShimmerDriver. It is used to encapsulate data from the driver. Contains a MultiMap (PropertyCluster) where each key represents a Property (e.g., Accelerometer; Gyroscope, Magnetometer) and each value the FormatCluster of that property. The FormatCluster is an object which holds the format (e.g., Calibrated), units and data of the property (Shimmer, 2016).
• Shimmer.java
- class that belongs to driver ShimmerAndroidInstrumentDriver and extends ShimmerBluetooth.java. Inherits and implements methods from ShimmerDriver to make the connections between the Android app and the Shimmer3 IMU over Bluetooth.
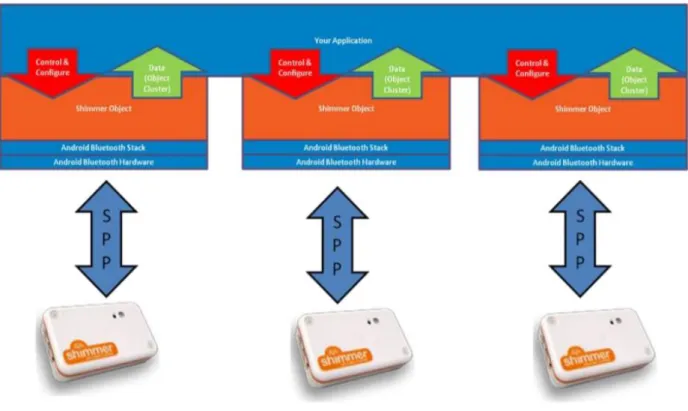
ShimmerDriver and ShimmerAndroidInstrumentDriver drivers are open-source. The Shimmer class, Figure 35, relies on the Bluetooth stack provided by Android to connect with the Shimmer device via the Serial Port Profile (SPP). SPP emulates a serial cable link over Bluetooth wireless technology. Each Shimmer device connected to the Android Device is represented by a Shimmer object which is an instance of the Shimmer class (Shimmer, 2016).
Figure 34 Shimmer drivers
Shimmer device responds with an Acknowledge packet whenever a command is received (Shimmer, 2016).
Multiple Shimmer devices can be connected simultaneously to an Android device using multiple instances of the Shimmer Class object (Shimmer, 2016), as depicted in Figure 36.
In ObjectCluster java class, under the scope of this project and for shimmer devices synchronization datetime fields were added to keep system timestamps, for each received cluster to have an associated system timestamp other than the internal timestamp, which will be useful to align data from multiple Shimmer3.
3.2.3. Entity - Relationship model
The classification model, the test results, the train and test datasets and the users’ information is persisted in the System database.
The database schema has the following 6 tables, illustrated in Figure 37: • gait_classification_test_data: keeps all the test results
• monitorized_test_person: has the user details • train_data_collected: collected train datasets
• test_data_collected: collected test datasets
• classification_models: the models from the several training operations performed
• train_models: holds the available classification algorithms
3.2.4. System backend
The system backend contains a Wildfly 10 Application Server, a REST API, a database and Java and Python scripts to process the datasets. The system REST API available services are:
• insertFile – stores dataset csv files in database • loginPerson – checks if user is valid
• registerPerson – create a new user • trainClassifier - trains the classifier
Figure 38 depicts the system REST API services.
3.2.5. Python data processing
Train and test datasets are processed in Python. Scikit-learn along with Numpy and Scipy are the used libraries. Two Python scripts were implemented to process the data. Both scripts use a common code. Besides the common implemented code, the main differences between the scripts are:
1. test.py: calls the persisted active model to execute a test and persists the results. 2. train.py: trains and persists the classifier in the database.
The common shared code between these scripts has the following steps: 1. Query database to get the not processed records
2. Extraction of user, classifier, file type (if it is a file containing test or train records), Bluetooth address, and label (important for a train file) fields
3. Retrieval from the PostgreSQL database of the csv file stored in a bytea field. It contains data from both Shimmer devices from both right and left legs. Data is then split into right and left leg data