Leila dos Reis Pereira
Improving the biological efficacy and cost-effectiveness
of a premium weaning diet for Senegalese sole (Solea
senegalensis)
Universidade do Algarve
Faculdade de Ciências e Tecnologia
Leila dos Reis Pereira
Improving the biological efficacy and cost-effectiveness
of a premium weaning diet for Senegalese sole (Solea
senegalensis)
Master in Aquaculture and Fisheries
Specialization Aquaculture
Thesis supervision by: Internal coordinator: Doutor Luís Eugénio da Castanheira Conceição
(Centro de Ciências do Mar - CCMAR e SPAROS Lda) External coordinator: Doutor Wilson Gabriel Poseiro Coutinho Pinto
(SPAROS Lda.)
Universidade do Algarve
2016
Improving the biological efficacy and cost-effectiveness
of a premium weaning diet for Senegalese sole (S.
senegalensis)
Declaração de autoria de trabalho:
Declaro ser o(a) autor(a) deste trabalho, que é original e inédito. Autores e trabalhos consultados estão devidamente citados no texto e constam da listagem de referências incluída.
Copyright© Leila dos Reis Pereira
A Universidade do Algarve reserva para si o direito, em conformidade com o disposto no Código do Direito de Autor e dos Direitos Conexos, de arquivar, reproduzir e publicar a obra, independentemente do meio utilizado, bem como de a divulgar através de repositórios científicos e de admitir a sua cópia e distribuição para fins meramente educacionais ou de investigação e não comerciais, conquanto seja dado o devido crédito ao autor e editor respetivos.
i
Acknowledgements
Este trabalho foi apoiado pelo projecto SOLEAWIN (31305/FEP/71), parcialmente financiado pelo programa PROMAR (Portugal) com fundos FEDER.
Ao Doutor Luís Conceição por ter aceite ser meu orientador interno e por todo o acompanhamento nesta etapa.
Ao Doutor Wilson Pinto, por ter aceite ser meu orientador externo, por toda a ajuda prestada durante a parte zootécnica da tese, assim como também durante a parte escrita, pela disponibilidade e apoio, ensinamento e compreensão ao longo de todo o trabalho. Foi sem dúvida incansável a ajuda prestada.
Ao André Santos, por toda a disponibilidade e ajuda que apresentou para comigo no processo laboratorial e análise de dados.
À Vanda Chaveiro, por toda a ajuda e ensinamento na parte zootécnica do trabalho.
Ao Doutor Tomé Silva, por toda a ajuda prestada na parte estatística do trabalho.
A toda a equipa da SPAROS, por me terem incluído na empresa, por toda a ajuda que me deram enquanto lá estive e por todos os bons momentos que me proporcionaram.
Aos meus pais, por mais uma vez terem acreditado nas minhas capacidades e por me terem permitido concluir mais uma etapa da minha vida. Por terem estado comigo, embora longe, quando mais precisei deles.
Aos meus irmãos, que como irmãos mais velhos acabaram por desempenhar também um papel de pais e de melhores amigos. Por todo o apoio incondicional, pelo incentivo, por toda a ajuda, conselhos e motivação que me deram nesta fase. Um especial obrigado ao meu irmão Gonçalo por todos aqueles fins de semana que perdeu para me ajudar, por todo o ensinamento e paciência.
A todos os meus amigos, por me terem sempre apoiado e por serem quem são para mim. Quero agradecer especialmente à Ana Rute por alguns ensinamentos a nível de inglês e por todo o apoio. Quero também agradecer especialmente à Vera, por ter ouvido todos os meus desabafos nos momentos que mais precisei, pelo apoio que me deu e por toda a amizade.
O meu muito obrigado!! Leila Pereira, Setembro 2016
ii
Abstract
This Thesis aims to optimize the cost/benefit of a novel premium weaning diet for Senegalese sole - Winflatplus, developed by Sparos Lda. This objective should be reached through: 1) selecting a new prototype with minor changes on diet ingredient formulation with benefits on fish performance; 2) validate its cost-effectiveness; 3) implement a feed intake assessment method using a new dye added to the fish feeds. Two trials were done where fish performance was determined by analysing dry weight, total length, relative growth rate, feed conversion rate and feed intake. The first trial tested five diets variants of Winflatplus with similar proximal composition, where seven
treatments were performed. A sudden weaning was done at 27 DAH. At the end of the trial, the growth performance of treatments with Winflatplus+F3, F1, F2, F3 and P1 were higher that the remaining treatments. The diet F3 was the diet chosen to be used in trial 2. This choice was based on costs-benefit relationship, being the F3 diet the one with the lowest cost formulation. In the second trial, first-feeding larvae were initially separated into three different feeding regimes. Larvae groups were submitted to a same co-feeding strategy, each with a different inert diet. At 19 DAH each larvae group was split into two co-fed regimes, each with two new different inert diets. Hence, 6 experimental treatments were considered. The weaning was performed at 35 DAH. At the end of the trial the treatments with F3 diet obtained higher growth performance than those treatments with Winflatplus. Feed intake results were used to
verify if it would be possible to predict in advance which diets would provide better results. This method was more efficient in predicting the final results when applied a few days after weaning. At the end, all proposed goals were achieved. In conclusion, it was possible to verify that with diets with the same proximate nutritional composition but with lower production costs, it is possible to improve Senegalese sole growth performance and survival.
Keywords
: Senegalese sole, Solea senegalensis, weaning, inert diet, feed intake, Winflatplusiii
Resumo
Nos últimos 30 anos, o sector de aquacultura sofreu uma grande expansão, resultando num aumento global da produção de peixe. A localização geográfica de Portugal, maioritariamente, devia a sua proximidade com o mar, e o facto de Portugal ser o primeiro país da União Europeia e terceiro em todo o mundo com um maior consumo de peixe per capita, proporciona um grande potencial para o desenvolvimento de aquacultura. A necessidade da Europa diversificar a produção de aquacultura com animais marinhos, levou a que Portugal e outros países do sul da Europa incentivassem a produção de linguado senegalês (Solea senegalensis). Esta espécie apresenta um valor comercial elevado e as suas capturas em mar estão a diminuir. Os primeiros estádios de desenvolvimento larvar estão entre aqueles que mais preocupam os cientistas e produtores desta espécie, estando as condições zootécnicas e fatores bióticos na base da sobrevivência, crescimento e num desenvolvimento saudável. O processo de desmame também tem sido uma barreira no cultivo do linguado senegalês, maioritariamente devido a taxas de sobrevivência e de crescimento muito variáveis. Assim sendo, nos últimos anos, muitos estudos têm sido realizados de modo a descobrir dietas de desmame apropriadas para pós-larvas de linguado senegalês, o que faz com que estas dietas surjam como alternativas mais práticas e mais económicas do que o alimento vivo. Sabe-se que a quantidade de alimento ingerido, assim como também o apetite são dois fatores que apresentam um grande impacto no crescimento e desenvolvimento larvar. Uma maneira de avaliar todo este processo é a utilização de métodos para determinação da quantidade de alimento ingerido. Estudos têm sido feitos de modo a melhorar e desenvolver estes métodos para determinação de alimento ingerido, contudo, apenas se verifica uma melhoria nos métodos usados em juvenis e adultos, sendo que para larvas de peixe não há ainda os métodos standardizados disponíveis. A incorporação de determinados corantes nas rações tem sido estudada como um método de determinação da quantidade de alimento ingerido em larvas. Esta tese tem como objetivo central a otimização da relação custo-benefício para a dieta Winflatplus desenvolvida pela Sparos Lda para o linguado senegalês. Pretende-se atingir este objetivo através da seleção de um protótipo com pequenas alterações nos ingredientes de formulação, que permita
iv
melhorar o desempenho das larvas, demonstrar os ganhos em termos de custo-benefício, e ainda implementar um novo método de determinação da quantidade de alimento ingerido, através da inserção de um corante nos alimentos. De modo a alcançar os objetivos propostos, duas experiências foram executadas. Em ambas as experiências o desempenho de crescimento das pós-larvas de linguado foi avaliado através da determinação do peso seco (DW), comprimento total (TL), taxa de crescimento relativo (RGR) e taxa de conversão alimentar (FCR) e, nas amostragens para determinação da quantidade de alimento ingerido foram utilizadas dietas marcadas. Na primeira experiência foram testadas cinco dietas diferentes, derivadas da dieta Winflatplus mas apresentando uma composição proximal semelhante, formando-se sete tratamentos diferentes. Nesta experiência realizou-se um desmame abrupto aos 27 dias após a eclosão (DAH). No decorrer da experiência foram realizadas quatro amostragens, aos 27, 34, 44 e 53 DAH, onde as amostragens dos 34 e 44 DAH foram usadas tanto para a determinação da performance do crescimento, como também para a determinação da quantidade de alimento ingerido. Aos 53 DAH, fim da experiência, as pós-larvas pertencentes aos tratamentos com as dietas Winflatplus+F3,
F1, F2, F3 e P1 apresentaram um desempenho de crescimento superior às pós-larvas dos tratamentos no qual se estava a administrar Winflatplus e F4. A dieta F3 foi a dieta
escolhida para ser usada na segunda experiência. Esta escolha foi baseada na relação custo-benefício, sendo a dieta F3 aquela que, dentro das dietas que apresentaram melhores performances de crescimento, apresenta um menor custo de formulação. Na segunda experiência, à abertura de boca, as larvas foram divididas em três diferentes regimes alimentares. Cada grupo de larvas foi submetido a uma co-alimentação com alimento vivo e diferentes dietas. Aos 19 DAH cada grupo de larvas foi separado em dois regimes de co-alimentação, um com a dieta Winflatplus e outro com a dieta F3.
Assim, seis tratamentos experimentais ficaram formados. Nesta experiência o desmame foi realizado aos 35 DAH. No decorrer da experiência foram realizadas cinco amostragens, aos 35, 42, 51, 56 e 75 DAH, onde as amostragens dos 42 e 56 DAH foram usadas tanto para a determinação da performance do crescimento, como também para a determinação da quantidade de alimento ingerido. No final da experiência, 75 DAH, a performance de crescimento dos tratamentos com a dieta F3 foi superior à dos tratamentos com a dieta Winflatplus. Os resultados obtidos através do
v
consumo de alimento foram usados para verificar se seria possível prever antecipadamente quais as dietas que poderiam fornecer melhores resultados. Relativamente aos resultados do consumo de alimento para as duas experiências, foi verificado que existe uma melhoria do consumo de alimento, e nas larvas que ingeriram alimento, da primeira para a segunda amostragem, o que poderá estar relacionado com a distância temporal entre as amostragens relativas ao consumo de alimento e o dia em que o desmame foi realizado. Estes resultados podem também ser explicados através da composição das dietas, pois, embora o valor nutricional em macronutrientes seja semelhante em todas as dietas, podem haver diferenças na composição de micronutrientes presentes nas diferentes dietas, o que pode ser responsável pelas diferenças na performance do crescimento. Em suma, com todos os objetivos propostos alcançados, é possível verificar que com dietas com a mesma composição nutricional, mas com baixos custos de produção, é possível melhorar as performances de crescimento e sobrevivência, uma vez que os valores de performance de crescimento obtidos em ambas as experiências nunca tinham sido observados, sendo estes um grande avanço no cultivo do linguado senegalês.
Palavras-chave
: Linguado senegalês, Solea senegalensis, desmame, ração, taxa de alimento ingerido, Winflatplusvi
Table of Contents
Acknowledgements ... i
Abstract ... ii
Resumo ... iii
Table of Contents ...vi
List of Figures ... viii
List of Tables ... x
List of Abbreviations ... xi
1. Introduction ... 1
1.1 World Aquaculture ... 2
1.2 Aquaculture sector in Portugal ... 4
1.3 Senegalese Sole ... 6
1.4 Senegalese sole weaning... 8
1.5 Feed Intake ... 11
1.6 Objectives ... 12
2. Trial 1: Selection of a cost-effective weaning diet prototype for Senegalese sole ... 14
2.1 Methodology ... 15
2.1.1 Dietary treatments ... 15
2.1.2 Fish rearing ... 16
2.1.3 Sampling ... 18
2.1.3.1 Growth and survival ... 18
2.1.3.2 Feed Intake ... 18
2.1.4 Data analysis ... 19
2.2 Results ... 20
2.2.1 Growth and survival ... 20
2.2.2 Feed Intake ... 22
2.3 Discussion ... 27
3. Trial 2: Validation of a cost-effective weaning diet prototype for Senegalese sole ... 32
3.1 Methodology ... 33
3.1.1 Dietary treatments ... 33
3.1.2 Larval rearing ... 34
3.1.3 Sampling ... 35
vii
3.2 Results ... 36
3.2.1 Growth and Survival ... 36
3.2.2 Feed Intake ... 39 3.3 Discussion ... 46 4. Final Conclusions ... 50 5. Bibliography ... 52 6. Annexes ... 57 6.1 Annex I ... 58 6.2 Annex II ... 58 6.3 Annex III ... 59 6.4 Annex IV ... 59
viii
List of Figures
Figure 1 – Aquaculture production in Portugal (Adapted from DGRM, 2014). ... 5 Figure 2 – Main producer countries of Solea senegalensis (FAO, 2016b). ... 7 Figure 3 – Production cycle of Solea spp. (FAO, 2016b). ... 8 Figure 4 – Experimental treatments and respective diets used for each larval period in Trial 1. ... 16 Figure 5 – Dry weight of heads (mg) of S. senegalensis larvae reared under different
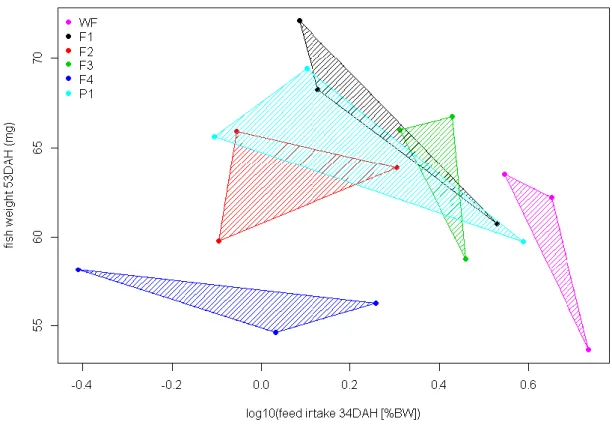
experimental diets. Different superscript letters indicate statistical differences (P< 0.05) between post-larvae from different treatments at the same age. Values refer to head groups (two upper quartiles of weight distribution). ... 21 Figure 6 – Decay test for dye incorporated in experimental diets (F2 used as an example) under light and dark conditions during 60 days. ... 22 Figure 7 – Ingestion and non-ingestion of experimental diets by S. senegalensis at 34 days after hatching. Different superscript letters indicate statistical differences (P< 0.05) between post-larvae from different treatments. ... 23 Figure 8 – Ingestion and non-ingestion of experimental diets by S. senegalensis at 44 days after hatching. ... 24 Figure 9 – Feed intake pattern of S. senegalensis fed on each experimental labeled diet at 34 DAH. All values are presented as means ± standard deviation. ... 25 Figure 10 – Feed intake pattern of larvae that ingested each experimental labeled diet at 44 DAH. All values are presented as means ± standard deviation. ... 25 Figure 11 – Relationship between final weight and feed intake of S.senegalensis at 34 DAH fed different experimental diets. Each spot represent one tank per treatment. The treatment with Winflatplus diet and the treatment with Winflatplus + F3 diet were represented in the figure by
WF. This graphic was obtained by the utilization of mean of heads to each treatment, where a quantile > 0.5 was used to identify that the values of heads used are values above the median. Since the feed intake is obtained through a ratio, it was necessary to apply a logarithm. ... 26 Figure 12 – Relationship between final weight and feed intake of S.senegalensis at 44 DAH fed different experimental diets. Each spot represents one tank per treatment. This graphic was obtained by the utilization of DW mean to each treatment, where a quantile > 0.5 was used. Since the feed intake is obtained through a ratio, it was necessary to apply a logarithm. ... 27 Figure 13 – Experimental treatments and respective diets used for each larval period in Trial 2. ... 33 Figure 14 – Dry weight (mg) of S. senegalensis larvae reared under different feeding regimes, though the trial in all treatments. Different superscript letters indicate statistical differences (P< 0.05) between post-larvae from different treatments at the same age. ... 37 Figure 15 – Dry weight (mg) of S. senegalensis larvae reared under different feeding regimes, at 51 DAH, in all treatments. Different superscript letters indicate statistical differences (P< 0.05) between post-larvae from different treatments at the same age. Values refer to head groups (two upper quartiles of weight distribution). ... 38 Figure 16 – Dry weight (mg) of S. senegalensis larvae reared under different feeding regimes, at 75 DAH, in all treatments. Different superscript letters indicate statistical differences (P< 0.05) between post-larvae from different treatments at the same age. Values refer to head groups (two upper quartiles of weight distribution). ... 38
ix Figure 17 – Ingestion and non-ingestion of experimental diets for S. senegalensis 42 days after hatching. Different superscript letters indicate statistical differences (P< 0.05) between post-larvae from different treatments. ... 40 Figure 18 – Ingestion and non-ingestion of experimental diets for S. senegalensis 56 days after hatching. Different superscript letters indicate statistical differences (P< 0.05) between post-larvae from different treatments. ... 41 Figure 19 – Feed intake of larvae that ingested labeled feed at 42 DAH. Data is divided in 5 classes of different feed intake percentages per larvae DW, and the values represent
percentages of total larvae that ingested labeled feed in each class. All values are presented as means ± standard deviation. ... 42 Figure 20 – Feed intake of larvae that ingested labeled feed at 56 DAH. Data is divided in 5 classes of different feed intake percentages per larvae DW, and the values represent
percentages of total larvae that ingested labeled feed in each class. All values are presented as means ± standard deviation. ... 43 Figure 21 – Relationship between dry weight at 56 DAH and feed intake at 42 DAH of different treatments. Each spot represent one tank per treatment. This graphic was obtained by the utilization of DW mean to each treatment, where a quantile > 0.5 was used. Since the feed intake is obtained through a ratio, it was necessary to apply a logarithm. ... 44 Figure 22 – Relationship between final dry weight and feed intake at 42 DAH of different treatments. Each spot represent one tank per treatment. This graphic was obtained by the utilization of DW mean to each treatment, where a quantile > 0.5 was used. Since the feed intake is obtained through a ratio, it was necessary to apply a logarithm. ... 45 Figure 23 – Relationship between final dry weight and feed intake at 56 DAH of different treatments. Each spot represent one tank per treatment. This graphic was obtained by the utilization of DW mean to each treatment, where a quantile > 0.5 was used. Since the feed intake is obtained through a ratio, it was necessary to apply a logarithm. ... 46
x
List of Tables
Table 1 - Aquaculture production by region (adapted from FAO, 2016d). ... 3 Table 2 – Different methods for determining feed intake used in fish juveniles (Houlihan,
Boujard and Jobling, 2001). ... 12
Table 3 – Theoretical proximal nutritional composition of Winflatplus and remaining
experimental diets. ... 16
Table 4 – Daily routines made during the experiment. ... 17 Table 5 – Total length (TL), survival, feed conversion ratio (FCR) and relative growth rate (RGR)
for S. senegalensis reared under different dietary experimental treatments Survival, FCR and RGR values were obtained at the end of the experiment, 53 DAH. ... 21
Table 6 – Total length, survival, feed conversion ratio (FCR) and relative growth rate (RGR) for
S. senegalensis reared under different feeding regimes. ... 39
Table 7 – Estimated frozen Artemia feeding plan given to each treatment per meal in trial 1.
The amounts are calculated to 1000 larvae. ... 58
Table 8 – Estimated inert diet feeding plan given to each treatment per meal in trial 1. The
amounts are calculated to 1000 larvae. ... 58
Table 9 – Estimated frozen Artemia feeding plan given to each treatment per meal in trial 2.
The amounts are calculated to 1000 larvae. ... 59
Table 10 – Estimated inert diet feeding plan used during the co-feeding phase. The amounts
xi
List of Abbreviations
IPMA: Instituto português do mar e da atmosfera CCMAR: Centro de Ciências do Mar
DAH: Days after hatching
FAO: Feed and Agriculture Organization INE: Instituto Nacional de Estatística
DGRM: Direção-Geral de Recursos Naturais, Segurança e Serviços Marítimos MSY: Maximum sustainable yield
HUFA: Highly unsaturated fatty acids
IFAPA: Instituto de Investigación y Formación Agraria y Pesquera DW: Dry weight
TL: Total length
RGR: Relative growth rate FCR: Feed conversion rate
1
2
1.1
World Aquaculture
Due to the increase of world per capita fish consumption, from an average of 9.9 kg in the 1960s to 19.7 kg in 2013, global fish production is growing. This increase may be happening by a combination of reductions in waste, improved distribution channels, and growing demand linked to population growth (FAO, 2016d). At the moment, fish stocks fished at biologically unsustainable levels have an abundance lower than the level that can produce the maximum sustainable yield (MSY) and are therefore overfished (FAO, 2016d). Aquaculture appears as an activity that mitigates these shortcomings, assuming a growing importance in the global feed supply.
Aquaculture is defined as the farming, in controlled ecosystems, of aquatic organisms, animals or plants. This kind of farming implies some form of intervention in the rearing process to enhance production such as regular stocking, feeding and protection from predators (FAO, 2016a). In the last 30 years, the aquaculture sector has expanded, resulting in the increased production of fish, crustaceans, mollusks, and other marine species. However, the annual rate between 1980 and 1990 (10.8%) is higher than the annual rate between 2000 and 2014 (6.2%). Global aquatic production increased from 32.4 million tons in 2000 to 73.8 million tons in 2012 (FAO, 2016d). In 2012, aquaculture contributed to the world’s fish production with 42.2% of fish catches, approximately 9.41 kg of fish per person (FAO, 2013; FAO, 2014), where the number of species produced in aquaculture and registered in FAO statistics was 580, including finfishes (362 species, including hybrids), molluscs (104), crustaceans (62), amphibians and reptiles (6), aquatic invertebrates (9), aquatic plants (37). For most farmed aquatic species, hatchery and nursery technology have been developed and established (FAO, 2016d).
Throughout these years, Asia has been the continent with the highest aquaculture production, representing in 2014 89% of world’s aquaculture production (Table 1). China and Philippines are the major producers of aquaculture products. China produced, in 2014, 45.5 million tons of fish, representing 61.6% of the global value of aquaculture fish production (FAO, 2013; FAO, 2016d).
3
Table 1 -Aquaculture production by region (adapted from FAO, 2016d).
Europe represents only 4% of the global aquaculture production. Nevertheless, Norway is the sixth country in the world with the highest fish production having produced 1 138 797 tons in 2011 (FAO, 2013) representing thus 45.9% of the European aquaculture production (FAO, 2014). Europe expanded extensively its production over the last decades, however, in 2014 dropped slightly (Imsland et al., 2003; FAO, 2016d). Few species are responsible for this growth, like Atlantic salmon (Salmo salar), European sea bass (Dicentrarchus labrax) and gilthead seabream (Sparus aurata). However, the increase in production of these species led to the market saturation, reducing their prices. Therefore, it is necessary to find new species to improve diversity and to ensure the sustainable development of the industry (Imsland et al., 2003; Borges et al., 2009; Dâmaso-Rodrigues et al., 2010). The European Union produces about 1.28 million tons, representing only 1.5% of world production. Despite its low global representation, European aquaculture has strong characteristics like technological leadership, feed quality assurance and safety, and an appropriate climate for cultivation of specific species. However, the competitiveness of European producers, in the European and world markets, is confronted with productions from other countries, which have lower production costs, due to their bigger production scale and lower labor cost (DGRM, 2014).
Fisheries and aquaculture sector have been a source of income to many millions of people around the world. It is known that in 2014, 56.6 million people were involved in the primary sector of capture fisheries and aquaculture. The total engagement in fisheries and aquaculture has been decreasing during last six years, due to a decrease of about 1.5 million fishers. In the same year, the fisheries and
4
aquaculture sector in Asia was represented by 84 percent of all people employed in this sector, followed by Africa with, approximately, 10 percent and Latin America and the Caribbean with 4 percent. About 33 percent of all people employed in the sector were involved in aquaculture sector, where Asia has more than 94 percent of employers, followed by Latin America and the Caribbean with 1.9 percent and Africa with 1.4 percent (FAO, 2016d).
1.2
Aquaculture sector in Portugal
The geographical location of the Portuguese coast, with the transition of two major oceanographic sub-provinces of the North Atlantic, the subtropical and subtropical/subpolar, allows a wide range of habitats, with great water quality and a high diversity of species. For these reasons the Portuguese coast is considered one of the richest areas in biological terms, providing a unique potential in fisheries and aquaculture activity (Branco, 2003; DGRM, 2014). Nevertheless, due to the geomorphological conditions of the Portuguese coast and Atlantic islands and, above all, the sea conditions in the winter months, the installation of offshore units for ocean aquaculture it is not recommended, requiring the use of adapted technology solutions to the environmental conditions (DGRM, 2014).
Fishing has been an important activity in Portugal since the Neolithic period, suffering a steady development throughout the various civilizations that inhabited the Iberian Peninsula (Cassamo, 2012). However, the fisheries sector has been declining over the last 30 years. In 1960 this sector employed around 0.5 % of total population while in 2011 employed only 0.1% (Ine, 2015). Portugal is the first country in the European Union and third country in the world with highest fish consumption per capita, reaching 57 kg per capita, per year (Barizi-Yeroulanos, 2010).
It is believed that aquaculture was introduced in the Iberian Peninsula by the Romans with simple techniques (Cassamo, 2012). Aquaculture in Portuguese coastal inland waters, estuaries and coastal lagoons has a long standing tradition, using extensive systems of production and recycling the infrastructures of the salt industry (DGRM, 2014). Even though aquaculture is considered an ancient and traditional practice in Portugal, its exploitation has always a familiar production level, never reaching the importance of the strong industrial fisheries. In 1986, after Portugal
5
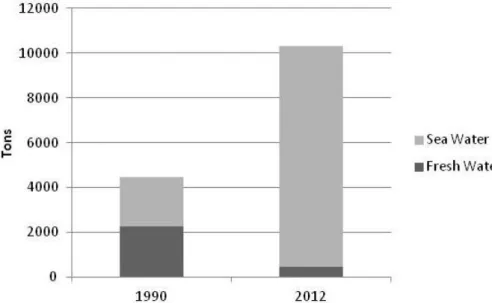
joining the European Community, monetary incentives were given to Portugal for the promotion of the aquaculture in the country. Due to European aid, this activity suffered great developments, like the introduction of treatment and water recirculation systems (Cassamo, 2012). Along 1980’s, the aquaculture of rainbow trout (Oncorhynchus mykiss) and bivalves largely increased, but it was only on 1990’s that the aquaculture sector in Portugal had its greatest growth (DGRM, 2014). However, this sector is still characterized by the existence of a large number of small farms. Throughout this period, aquaculture of freshwater species decreased due to market limitations and reduced consumer demand for such products (Figure 1). Since the early 1990's aquaculture production increased from 4 457 tons in 1990 to 10 791 tons in 2014, representing 50,3 million euros in the last year (DGRM, 2014; Ine, 2015). Today, it is possible to see a few intensive fish farms in the coastline producing turbot (Scophthalmus maximus) and Senegalese sole (Solea senegalensis) (DGRM, 2014). The most produced species are turbot (Scophthalmus maximus), European sea bass (Dicentrarchus labrax), gilthead seabream (Sparus aurata), clams and oysters and recently Senegalese sole (Solea senegalensis) (DGRM, 2014).
Figure 1 – Aquaculture production in Portugal (Adapted from DGRM, 2014).
In any case, in 2011, Portugal did not exceed 2% of the value of European aquaculture production (DGRM, 2014).
6
1.3
Senegalese Sole
Senegalese sole (Solea senegalensis Kaup, 1858) is a flatfish that inhabits throughout the Atlantic and Mediterranean coasts (Dinis et al., 1999; Imsland et al., 2003). It is a gonochoric species and according to Dinis et al. (1999) females mature at the age of 3 years, when total length reaches approximately 32 cm. In the wild, the spawning season occurs during Spring, between March and June, while in captivity the eggs are obtained from wild broodstocks (Dinis et al., 1999). The eggs are pelagic, golden color, have a diameter of 0.87 to 1.00 mm and exhibit a high number of small oil droplets mostly in the equatorial region (Engrola, 2008). The temperature is a very important parameter in the spawning season, because below 16℃ fish stop egg emission (Dinis et al., 1999). Hatching also depends on the temperature, which can vary between 16 and 18℃ (Dinis et al., 1999; Engrola, 2008). After hatching, larvae exhibit a bilateral symmetry and have a total length of 2.4 mm (Dinis et al., 1999; Engrola, 2008). First feeding occurs 2 days after hatching (DAH), when larvae measure around 3 mm (Dinis et al., 1999). At this point, in captivity, larvae are fed with enriched rotifers for few days to guarantee higher levels of highly unsaturated fatty acids in the diet (HUFA), then the Artemia nauplii can already be administrated (Dinis et al., 1999; Imsland et al., 2003; Conceição et al., 2007). This species is strongly influenced by photoperiod (Bayarri et al., 2004) once that, in captivity, exhibits a nocturnal locomotor activity and manifests a nocturnal feeding behavior (Navarro et al., 2009). Senegalese sole larvae development, as in other flatfish, is characterized by an accentuated metamorphosis. Metamorphosis climax occurs usually from 11 to 19 DAH where there is a 90° rotation in body position, migration of the left eye (Dinis et al., 1999; Fernandez-Diaz et al., 2001) and the change of spatial organization of the digestive system (Ribeiro, Sarasquete, & Dinis, 1999). Metamorphosis is associated with the larvae settlement in the bottom and the change from the pelagic phase to benthic phase (Fernandez-Diaz et al., 2001).
Early studies, related to Senegalese sole aquaculture, were made by Rodriguez (1984) in Spain and by Dinis (1986) in Portuguese estuaries (Canavate, 2005; Villanueva and Alonso 2014). This species was mostly studied in these countries because Senegalese sole was well adapted to the warmer waters of temperate climates. In the 1980s, Senegalese sole was already cultured extensively in earthen ponds.
7
The records of sole production (Figure 3) began in Portugal during the 1970s, with only 2 tons per year. In 2007 this production achieved 70 tons. In Portugal, the production of Senegalese sole is currently mainly conducted by a single company. However, there are other farms producing Senegalese sole, but in low volumes and in polyculture systems. Nowadays, Spain, Portugal and France are the leading sole producers and in 2010 the sole production in Europe achieved a total of 347 tons, and in 2015 production was over 700 tons (Conceição, pers. comm.). Outside of Europe, this species is farmed at least in China (FAO, 2016b).
8
Figure 3 – Production cycle of Solea spp. (FAO, 2016b).
Senegalese sole has been proved to be a strong candidate species to improve diversification in marine aquaculture industry in Europe, specifically in the Iberian Peninsula (Imsland et al., 2003; Conceição et al., 2007; Borges et al., 2009; Makridis et al., 2009; Dâmaso-Rodrigues et al., 2010;). This species presents a high commercial value and a decline in wild catches (Imsland et al., 2003). This fact stimulate producers as well as the increasing demand by consumers and the high quality of its flesh (Borges et al., 2009; Dâmaso-Rodrigues et al., 2010). As previously said, there were many advances in the farming of this species, on the culture conditions, like temperature, photoperiod and stocking density, as they are key elements to production optimization of Senegalese sole (Morais et al., 2016). However, there is still incomplete knowledge about nutritional needs during the larval, weaning and juvenile stages (Borges et al., 2009; Dâmaso-Rodrigues et al., 2010; Lobo et al., 2014).
1.4
Senegalese sole weaning
As a strong candidate species for aquaculture, Senegalese sole larvae and post-larvae have an easy rearing compared with other fish species. Due to this, culture
9
protocols were established early and are nowadays relatively standardized, where post-larvae production presents a good growth and a high survival rates (Dinis et al., 1999; Imsland et al., 2003; Conceição et al., 2007). Although, most of research are focused in early life stages, since the nutritional conditions of larvae may have effects on the quality of juveniles. Through the better knowledge of larval nutrition, it is possible solve some problems observed during these stages, like difficulties in weaning or variable growth rates (Morais et al., 2016).
Weaning is characterized by the change of live feed to an inert diet (FAO, 2016c). In the last few years, research has been conducted to find suitable weaning diets for Senegalese sole, as for larvae of other species, arising as more practical and economic alternatives to live feed (Koven et al., 2001; Fletcher et al., 2007). However, it is necessary to have unfailing feeds with well-known designed formulations for advancing larval nutrition (Hamre et al., 2013). In order to grow, larvae should eat and be able to digest the feed. Live preys, such as rotifers and Artemia, are typically given to larvae at first-feeding (Conceição et al., 2003). However, using live feeds can have some disadvantages such as the risk of introduction of pathogenic bacteria, the nutritional value and composition of these preys can be variable and inadequate to sustain growth of larvae at later stages (Conceição et al., 2003) and their nutritional quality is difficult to manipulate, which can affect fish health (Hart and Purser, 1996; Ribeiro, Engrola and Dinis, 2005). Metamorphosis is a phase that strongly affects larvae behavior, feeding and digestive physiology (Fernandez-Diaz et al., 2001) and may be affected by feeding and nutritional conditions (Engrola et al., 2009b; Engrola et al., 2010).
The development of inert diets for fish larvae aims to enable an early weaning, a replacement of live prey from first-feeding and delivering of some specific compounds in the digestive tract of fish larvae (Hamre et al., 2013). Inert diets used to feed fish larvae need to have some structural and physical characteristics. One of them is stability, to prevent the particles disintegration after immersion in water and maintain a good retention of hydrosoluble micronutrients. Another one is the accessibility, where the feed should be available in the water and with a good particle size (Koven et al., 2001; Hamre et al., 2013). Inert diets are mostly used as a strategy to reduce production costs maintaining adequate development and survival. Unlike
10
live feed, inert diets are nutritionally balanced, ready to use, and have a long shelf life. Even so, the early introduction of inert diets without live feeds may cause a decrease on larval growth (Robin and Vincent, 2003; Parma et al., 2013). According to Fletcher et al. (2007), the poor performance of weaning diets is mostly due to low ingestion rates, digestion and absorption. For this purpose, weaning diets should be well ingested and effectively digested by the larval digestive system (Hamre et al., 2013).
Larval weaning is an extremely important phase in production. Weaning has traditionally been a bottleneck in Senegalese sole rearing due to the low survival and low growth rates (Conceição et al., 2007; Fletcher et al., 2007). More recently better growth and survival rates are obtained, but results remain highly variable between batches. The type of inert diet used during weaning period can slow or stimulate digestive maturation in Senegalese sole (Engrola et al., 2007). Two different feeding strategies can be used in Senegalese sole weaning, co-feeding with Artemia metanauplii and sudden weaning (Engrola et al., 2007; Engrola et al., 2009b). However, for Senegalese sole, the choice of feeding strategy to adopt should be based on post-larvae weight (Engrola et al., 2007). A co-feeding strategy with a low Artemia replacement seems to present better results in pelagic or small benthonic post-larvae (below 1 mg dry weight), leading, at a later developmental stage, to a higher efficiency on digestion and absorption of complex nutrients present in microdiets (Engrola et al., 2009b). This was confirmed by Engrola et al. (2009a) who stated that a co-feeding strategy with inert diet starting during the pelagic phase of sole larval rearing can improve post-larval quality. Such a co-feeding strategy is commonly used in other species like Atlantic cod (Godus morhua) (Fletcher et al., 2007), seabream (Sparus aurata) (Kolkovski, Arieli and Tandler 1997; Robin and Vicent, 2003), barramundi (Lates calcarifer) (Curnow et al., 2006) and halibut (Scophthalmus maximus) (Roselund et al., 1997). In most marine species, inert diets fed alone at early life stages have a poor ability to sustain fish larvae growth and development. However, in Senegalese sole larvae with dry weight between 5 and 10 mg (Engrola et al., 2007), sudden weaning is the most common strategy adopted. This strategy has been progressing during the last decades contributing to an earlier weaning. In 1990’s, Senegalese sole weaning was made at 60 DAH and only in 2010 began to get better results in this strategy with weaning at 40 DAH (Luís Conceição, personal communication). At this moment, with
11
this strategy it is possible to achieve survivals close to 100% and growth around 10% per day between 25 and 30 DAH, when fed with high quality weaning diets. Nevertheless, to achieve these results it is necessary that the pelagic larvae are in very good nutritional condition and more developed, to facilitate their weaning. The evolution of weaning diets currently promotes Senegalese sole to reach mean wet weights of 1g only in 70 DAH, while until 2010, Senegalese sole reached 1g in 90 DAH or more.
1.5
Feed Intake
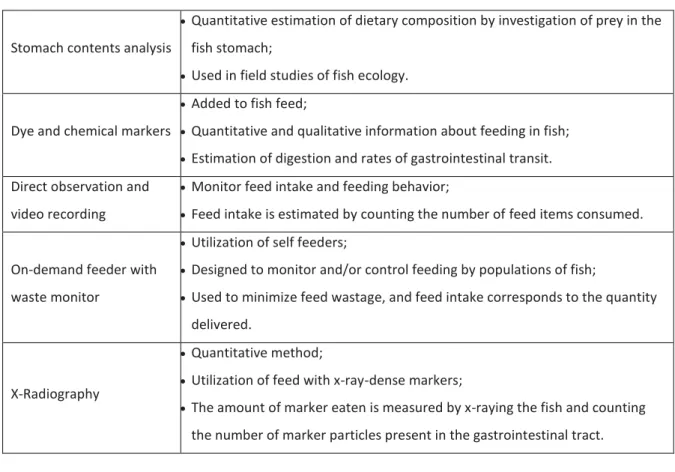
Different methods have been developed to determine feed intake in fish, such as stomach contents analysis, use of dye and chemical markers added to fish feeds, direct observation and video recording, on-demand feeder with feed waste monitoring, and X-radiography (Table 2) (Houlihan, Boujard and Jobling, 2001). However, these methods were developed essentially to be used in juvenile fish studies, while limited information is available about developed methods for determining feed intake in larvae, due to the incomplete knowledge of the factors that control feed intake in larva and the complexity of their study and to the small size and sensitiveness of the larvae. In fact, marine fish larvae are very vulnerable during the first stages of development, having rigorous requirements relative to zootechnical conditions and biotic factors, to survive, grow and develop healthy (Hamre et al., 2013). Feed intake and appetite are two of the factors that have great impact on larval growth and development (Bonacic et al., 2016). Feed particles for fish larvae also have a reduced size, which promotes leaching of water soluble markers due to their high surface to volume ratio. The type of feed intake measurement used depends on the aim of the studies and the type of feed used in the experiment. Feed intake can be measured in a single meal or in a temporal series, for example, to investigate feeding rhythms in chronobiology studies (Houlihan, Boujard and Jobling, 2001). However, the establishment of a reliable feed intake method for fish larvae is still necessary. Such development would be a valuable asset to evaluate the appetence of ingredient formulations on fish larval diets, ultimately aiding to accomplish a more successful transition from live-feeds. The establishment of a reliable feed-intake method could
12
also ultimately be used to predict experimental results when testing weaning diet formulations and feeding strategies on new species for aquaculture.
Table 2 –Different methods for determining feed intake used in fish juveniles (Houlihan, Boujard and Jobling, 2001).
Stomach contents analysis
Quantitative estimation of dietary composition by investigation of prey in the fish stomach;
Used in field studies of fish ecology.
Dye and chemical markers
Added to fish feed;
Quantitative and qualitative information about feeding in fish;
Estimation of digestion and rates of gastrointestinal transit. Direct observation and
video recording
Monitor feed intake and feeding behavior;
Feed intake is estimated by counting the number of feed items consumed.
On-demand feeder with waste monitor
Utilization of self feeders;
Designed to monitor and/or control feeding by populations of fish;
Used to minimize feed wastage, and feed intake corresponds to the quantity delivered.
X-Radiography
Quantitative method;
Utilization of feed with x-ray-dense markers;
The amount of marker eaten is measured by x-raying the fish and counting the number of marker particles present in the gastrointestinal tract.
1.6
Objectives
SPAROS Lda has recently launched in the market a premium weaning diet for Senegalese sole larvae – Winflatplus. Although excellent growth performances and survival results have been achieved during tests of product development, SPAROS recognized that small changes in the feed formulation may optimize the cost/benefit of this novel premium weaning diet for Senegalese sole. Therefore, this Thesis aims to optimize the cost/benefit of a novel premium weaning diet for Senegalese sole. This objective should be reached through: 1) selecting a new prototype with minor changes on diet ingredient formulation with benefits on fish performance; 2) validate its cost-effectiveness; 3) implement a feed intake assessment method using a new dye added to the fish feeds.
13
By increasing the Winflatplus cost-benefit relationship this Thesis aims to ultimately contribute to the competitiveness of this microdiet, but also for the sustainability of the aquaculture industry.
14
2.
Trial 1: Selection of a cost-effective
weaning diet prototype for Senegalese
sole
15
2.1
Methodology
2.1.1 Dietary treatments
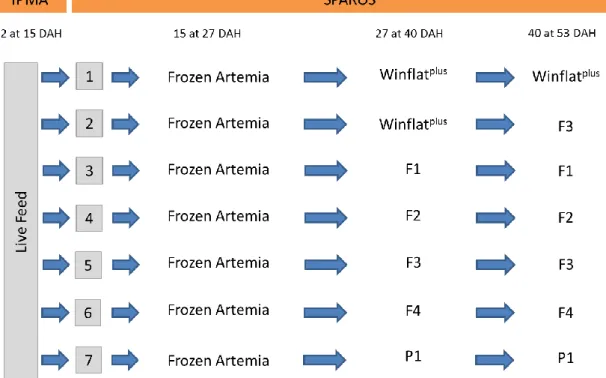
This trial comprised seven dietary treatments that were run in triplicate, using Senegalese sole from 27 days after hatching (DAH) until 53 DAH (end of the experiment). Winflatplus a premium commercial weaning diet developed by Sparos Lda
for flatfish larvae was used as a control diet. The remaining dietary treatments used were: P1, F1, F2, F3, F4 and WinflatPlus+F3. In this last treatment, Senegalese sole
post-larvae fed on Winflatplus between 27 and 40 DAH and F3 diet between 40 and 53 DAH
(Figure 4). All diets were variants of Winflatplus, presenting a similar proximal
composition to Winflatplus (Table 3), but differing in formulation costs and
micronutrient composition. For this purpose, in comparison with Winflatplus, the
formulation costs were reduced as follows: P1<F1<F2<F3<F4 (F4 corresponding to higher reduction). For this purpose, formulation costs were reduced from over 20% (diet P1) to over 50 % (diet F4). All diets were produced at Sparos Lda (Olhão, Portugal), where powder ingredients were initially mixed according to each target formulation in a double-helix mixer, being thereafter ground twice in a micropulverizer hammer mill (SH1, Hosokawa-Alpine, Germany). The oil fraction of the formulation was subsequently added and diets humidified and agglomerated through low-shear extrusion (Dominioni Group, Italy). Upon extrusion, diets were dried in a convection oven (OP 750-UF, LTE Scientifics, United Kingdom) for 4 h at 60 ℃, being subsequently crumbled (Neuero Farm, Germany) and sieved to desired size ranges.
16
Table 3 –Theoretical proximal nutritional composition of Winflatplus and remaining experimental diets.
Crude protein (%) 62 Crude fat (%) 15 Crude ash (%) 11 Gross energy (MJ/Kg) 22.3 Tau (%) 1 Phosphorus (%) 2.5 n-3 HUFA (%) 2.7 Vitamin A (IU/Kg) 33000 Vitamin D3 (IU/Kg) 2900 Vitamin C (mg/Kg) 900 Vitamin E mg/Kg 250 2.1.2 Fish rearing
For this trial, Senegalese sole larvae with 15 DAH provided from Instituto Português do Mar e da Atmosfera (IPMA), at Olhão, Portugal, were reared at SPAROS Lda facilities (Olhão, Portugal). Larvae were initially acclimatized to 21 plastic tanks with 8L each, previously prepared with clean seawater and aeration. Initially, the tanks were maintained in a closed recirculating system with one water volume renewal h-1
but, due to an increase of nitrites concentration in the rearing water, it was necessary
17
to change to a semi-open system and tanks pass to four water renewals h-1. 475 larvae
were distributed to each tank, with larval density of 3000 post-larvae/m2. Larvae were
reared under a natural daily cycle photoperiod. However, under daylight conditions, light intensity was kept to a minimum to promote feed ingestion (Navarro et al., 2009; Pinto et al., 2016). Environmental parameters were measured daily with commercial probes. The temperature was maintained at approximately around 20.1±0,9℃, oxygen saturation level above 95 % in the tanks and 100% in the system, salinity at 35 g l-1 and
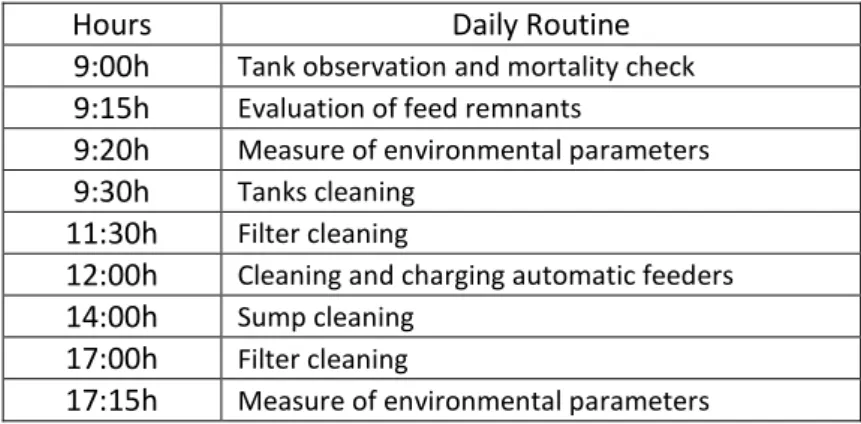
nitrogen compounds <0.1 mg/L. Tanks were cleaned every day using a water siphon to remove the uneaten feed before feeding. The tank walls and the filters were cleaned daily with a sponge from top to bottom. These routines are listed in Table 4.
Table 4 – Daily routines made during the experiment.
Hours Daily Routine 9:00h Tank observation and mortality check 9:15h Evaluation of feed remnants
9:20h Measure of environmental parameters 9:30h Tanks cleaning
11:30h Filter cleaning
12:00h Cleaning and charging automatic feeders 14:00h Sump cleaning
17:00h Filter cleaning
17:15h Measure of environmental parameters
Between 15 DAH and 27 DAH larvae were fed ad libitum with frozen Artemia enriched with commercial products. Frozen Artemia was supplied in four different meals, at 09:30 h, 12:00 h, 14:30 h and 17:00 h and the amounts provided in each meal were adjusted daily, according to the feeding plan present in ANNEX I. At 27 DAH larvae were suddenly weaned to inert diets, being fed Artemia on the former day (17:00 pm) and fasted until 14:00 am of the following day. In all treatments, inert diets were supplied by automatic feeders in 8 meals per day, being each meal distributed during two hours, with one hour interval between each meal, and without hydration of inert diets. The amounts provided in each meal per tank were adjusted daily, according to the amount of feed in the tank when the tank observation was performed. The tanks that did not had feed remains suffered an increase of 10% on feed, and the tanks that had excess of feed suffered a reduction of 10% or 20% in the daily diet, depending
18
on the amount of feed remaining (ANNEX II). In all treatments, inert diets with 400-600 μm granulometry were used between 27 and 53 DAH.
2.1.3 Sampling
2.1.3.1 Growth and survival
Senegalese sole post-larvae were sampled for dry weight (DW) and total length (TL) determination at 27, 34, 44 and 53 DAH. DW measurements were obtained by sampling only the larvae of two upper quartiles in each tank. These larvae have values above the median, and these are the individuals that will typically be farmed in commercial operations. Feed conversion ratio (FCR) and relative growth rate (RGR) and survival were determined at the end of the experiment. In 27 and 53 DAH samplings, to allow the post-larvae to get rid of any rest of feed in their digestive tract until sampling, the automatic feeders were stopped at 0:00 h. In the next day, after tank cleaning routine, 50 larvae were sampled from each tank. In all samplings, post-larvae were harvested to a mesh sieve and then euthanized with a lethal dosage of Phenoxyethanol. Subsequently, post-larvae were washed with distilled water to remove residual feed and salt, collected into an individual white paper and then stored at -20 ℃. Afterwards, post-larval were measured in AxioVison Microscopy software to determine total length and freeze-dried to determine dry weight.
2.1.3.2 Feed Intake
In 34 and 44 DAH larvae were sampled to determine feed intake. In these samplings, all automatic feeders were removed around 9:00 h and all tanks cleaned in order to remove the exceeding inert diet from tanks. At 10:20 h, and after cleaning the tanks, each tank was fed with 1g of inert diet. This quantity of inert diet represents approximately one meal on the automatic feeders. Given the impossibility to do this simultaneously on all tanks, the procedure was performed in each tank with an interval of 5 minutes. One hour later, and also with an interval of 5 minutes, all tanks were cleaned again in order to remove the excess (uneaten) feed, allowing larvae to eat only during 1h. At 14:00 h, another meal was given to post-larvae in each tank, although with labeled feed. These diets were the respective diets of each treatment where a hydrophobic dye was previously added at 10 mg/kg. One hour after feeding the
19
labeled diet, 20 post-larvae were sampled from each tank, with an interval of 5 minutes. Like in growth samplings, all post-larvae were harvested to a mesh sieve and then euthanized with a lethal dosage of Phenoxyethanol and washed with distilled water to remove any residual feed or salt. However, instead of being collected to a white paper, feed intake post-larvae samplings were collected into an individual eppendorf, and then stored at -20 ℃. Afterwards post-larvae were freeze-dried and weighed in a digital scale.
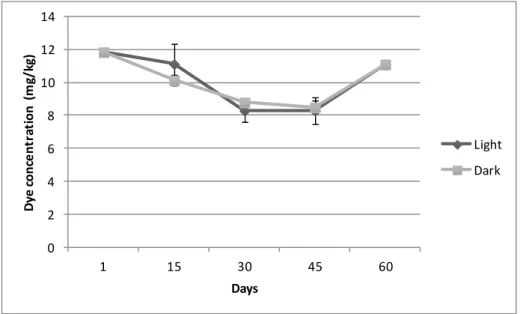
Before determining larval feed intake, a decay test with all labeled feed was done. This test was made every 15 days, during 2 months, to determine if there was decay in the fluorescence of the dye over time. The test was done with labeled feed exposed to ambient light and to dark (Figure 6).
To determine feed intake on each treatment, 10 larvae, per tank were placed in RIA (Radio Immuno Assay) tubes and then 1 ml of solvent was added to each one. The larvae were homogenized for 15 to 20 sec at 20000 rpm ultraturrax with a S10N-5G aste (Ultra Turrax T10, IKA, Staufen, Germany). Afterwards, 1ml of each sample was withdrawn to an Eppendorf, which were then centrifuged at 10 000 × g for 1 minute at room temperature (ScanSpeed 1236R, Labogene, Denmark). The supernatant was removed and 200 µl was applied to a 96-well plate of 96 Well Polypropylene Microplates, Greiner Bio-one. It was necessary to make a calibration curve with feed used in the feed intake sampling of each treatment. To obtain this calibration curve was necessary to make a stock solution of 20 µg/ ml, which was then homogenized and centrifuged under the same conditions used previously on larvae, in order to obtain the supernatant. Whenever necessary, dilutions were made to the supernatants of the larvae in order to obtain concentrations between the minimum value and the maximum value of the curve. The fluorescence of the plate was verified at a specific emission and excitation wavelength, on a wavelength reader Synergy ™ HT (BioTek Instruments, USA).
2.1.4 Data analysis
Results were expressed as means ± standard deviation (SD). Relative growth rate (RGR) was calculated as: 𝑅𝐺𝑅 (%. 𝑑𝑎𝑦−1) = (𝑒𝑔− 1) × 100 , where 𝑔 = (ln 𝑊𝑡 − 𝑙𝑛𝑊0) × 𝑡−1. Wt and W0 correspond to final and initial dry weights,
20
respectively, and t is the chosen period. The feed conversion ratio (FCR) was calculated as: 𝐹𝐶𝑅 =𝑊𝑒𝑖𝑔ℎ𝑡 𝑔𝑎𝑖𝑛 (𝑔)𝐹𝑒𝑒𝑑 𝐼𝑛𝑡𝑎𝑘𝑒 (𝑔).
The data were submitted to a variances homogeneity test in order to verify that they complied with all the one-way ANOVA assumptions. Differences were considered significant when p<0.05. Data were analysed through a Tukey multiple comparison test when mean variances were significantly different across treatments. For the cases in which the one-way ANOVA assumptions were not verified, nonparametric tests were used for K independent samples. Once again, differences were considered significant when p <0.05, and this way it was resorted to non-parametric tests for two independent samples (Mann-Whitney).
In order to determine if significant differences existed between RGR values and FCR values, it was necessary performing an arcsine transformation:
𝑃𝑇 = 𝐴𝑆𝐼𝑁 (𝑆𝑄𝑅𝑇 (𝑣𝑎𝑙𝑢𝑒𝑡𝑟𝑎𝑛𝑠𝑓𝑜𝑟𝑚 100 )).
For feed intake statistical analysis, it was necessary use a chi-square test to analyze differences between post-larvae that feed and post-larvae that did not. All statistical analyses were done in IBM SPSS Statistics 23 software.
2.2
Results
2.2.1 Growth and survival
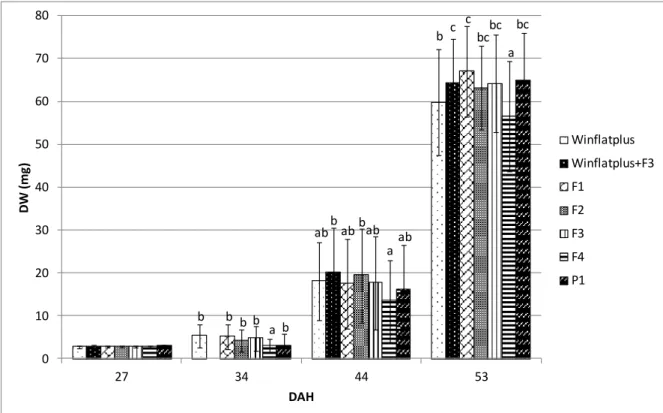
In Figure 5 is represented the DW along the experiment. In this Figure, it was possible to verify that at 27 DAH, when weaning was done, larvae presented an average DW around 2.8 mg, with no significant differences between treatments. At 34 DAH was possible to verify that the treatment with F4 diet presented a significant lower DW, when compared with the others treatments. At the end of the experiment, the treatment with F4 diet presented significant differences between other treatments, with lower values of DW. Treatments with Winflatplus + F3 and F1 diets presented a significantly higher DW comparing with treatments with Winflatplus and F4 diets.
21
Figure 5 – Dry weight of heads (mg) of S. senegalensis larvae reared under different experimental diets.
Different superscript letters indicate statistical differences (P< 0.05) between post-larvae from different treatments at the same age. Values refer to head groups (two upper quartiles of weight distribution).
In Table 5 Senegalese sole post-larvae TL (mm), survival (%), FCR and RGR (%.day-1) for all treatments at the end of the experiment are presented.
Table 5 – Total length (TL), survival, feed conversion ratio (FCR) and relative growth rate (RGR) for S. senegalensis reared under different dietary experimental treatments Survival, FCR and RGR values were
obtained at the end of the experiment, 53 DAH.
Treatments Time
(DAH) Winflatplus
Winflatplus + F3 F1 F2 F3 F4 P1 TL (mm) 27 10.8±1.0a 11.0±1.0ab 11.0±1.0ab 11.0±0.8ab 11.0±0.9ab 11.0±1.0ab 11.2±1.0b 53 28.4±4.8ab 29.3±4.1b 30.0±4.5b 28.1±4.3a 29.2±4.7b 28.1±6.9ab 31.0±4.5c Survival (%) 73.2±9.4b 64.4±6.8ab 64.1±7.3ab 62.7±9.1ab 63.9±3.4ab 48.1±4.0a 63.5±7.5ab FCR 1.3±0,2a 1.2±0.1a 1.1±0.1a 1.2±0.2a 1.2±0.2a 1.9±0.2b 1.2±0.1a RGR (%.day-1) 12.6±0.0 12.8±0.3 13.0±0.3 12.8±0.3 12.8±0.2 12.3±0.2 12.8±0.5
Results are given as mean ± standard deviation, of treatment replicates (n=3). Different superscript letters indicate statistical differences (P< 0.05) between post-larvae from different treatments at the same age. Data for survival, FCR and RGR refer to the end of the experimental period.
Regarding the TL values, at 27 DAH, it was possible to verify significant differences between treatments with Winflatplus and P1 diets, where the last treatment
presented a significantly higher total length. At 53 DAH it was possible to verify
b b b ab b ab c b ab bc b b bc a a bc b ab a 0 10 20 30 40 50 60 70 80 27 34 44 53 D W (mg ) DAH Winflatplus Winflatplus+F3 F1 F2 F3 F4 P1 c
22
significant differences between treatments, where the treatment with F2 diet presented the lowest TL and the treatment with P1 diet presented the highest TL (Table 5).
In Survival results no significant differences were observed between the treatments with Winflatplus+F3, F1, F2, F3 and P1 diets.
Relatively to the FCR values, it was verified that treatment with diet F4 showed significantly higher values than the remaining treatments, whereas no other significant differences were found.
No significant differences were found between treatments for the relative growth rate values of larvae at the end of the experiment (Table 5).
2.2.2 Feed Intake
Figure 6 represents the test made in F2 labeled feed, over a 60 day period. It was verified that the values of incorporated dye obtained were always identical between light and dark labeled feeds. Similar results were obtained for all the different diets.
Figure 6 – Decay test for dye incorporated in experimental diets (F2 used as an example) under light and
dark conditions during 60 days.
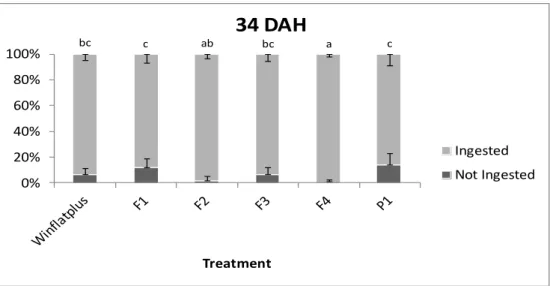
Results for the feed intake analysis have shown that at 34 DAH, significant differences were obtained between treatments for larvae that have or not ingested each experimental diet, where the treatments with Winflatplus, F1, F3 and P1 presented
0 2 4 6 8 10 12 14 1 15 30 45 60 D ye c onc e nt ra ti on (m g/ kg ) Days Light Dark
23
the lower percentage of larvae that ingested labeled feed and the treatments with F2 and F4 diets had a significantly higher percentage of larvae that ingest labeled feed (Figure 7). The remaining treatments did not present significant differences between each other and the percentage of larvae that did not ingest labeled feed, never achieved the twenty percent.
Figure 7 – Ingestion and non-ingestion of experimental diets by S. senegalensis at 34 days after
hatching. Different superscript letters indicate statistical differences (P< 0.05) between post-larvae from different treatments.
At 44 DAH (Figure 8), it was possible to verify that there were no significant differences between treatments. It was also verified that the treatment with Winflatplus
diet had 100% ingestion rate of labeled feed. The remaining treatments had ingestion rates between 93.3% and 98.9%.
bc c ab bc a c 0% 20% 40% 60% 80% 100% Treatment
34 DAH
Ingested Not Ingested24
Figure 8 – Ingestion and non-ingestion of experimental diets by S. senegalensis at 44 days after
hatching.
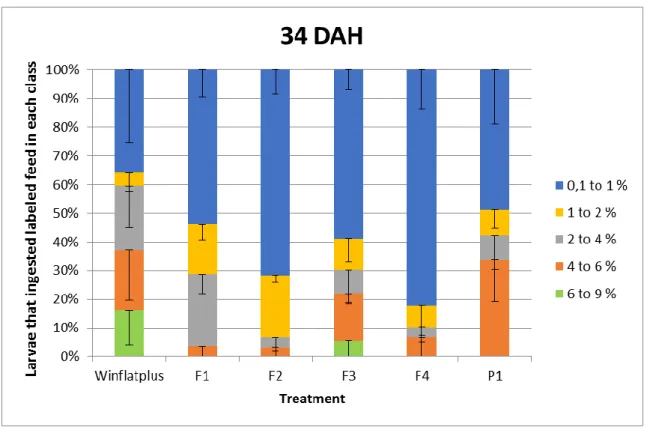
Figures 9 and 10 represent the feed intake data, where the data of each treatment was divided in 5 different classes, each one representing a different percentage range of feed intake per larvae DW. Analyzing Figure 9 and 10 it was possible to verify that in both 34 and 44 DAH no significant differences were found between treatments. It was also verified that in both samplings a higher percentage of larvae ingested labeled feed in class 0.1 to 1. This occurred in all treatments. However, it was verified that the F4 treatment was the only one where, in both 34 and 44 DAH, the percentage of larvae that ingested labeled feed in class 0.1 to 1 was above sixty percent. At 44 DAH (Figure 10), although no significant differences between treatments, the treatment with P1 diet was the one that the percentage of larvae that ingested labeled feed in class 0.1 to 1 do not pass the 20%. In all treatments, except the treatment with Winflatplus diet, it was verified that between the 34 and 44 DAH
there was an increase of feed intake in class “6 to 9”. Overall, it was verified that from 34 to 44 DAH there was a decrease in feed intake in class 0.1 to 1 and an increase in feed intake in all the other classes.
0% 20% 40% 60% 80% 100% Treatment
44 DAH
Ingested Not Ingested25
Figure 9 – Feed intake pattern of S. senegalensis fed on each experimental labeled diet at 34 DAH. All
values are presented as means ± standard deviation.
Figure 10 – Feed intake pattern of larvae that ingested each experimental labeled diet at 44 DAH. All
26
Figure 11 represents the relationship between weight of sole post-larvae at the end of the experiment and feed intake at 34 DAH. It was possible to verify that the treatment with Winflatplus was the one that ingested more labeled feed, however it
was not the treatment with the higher final weight. The treatments with F1, and P1 diets were treatments where larvae ingested a lower quantity of labeled feed but presented a higher final weight. It was also possible to verify that the treatment with F4 diet ingested a lower quantity of labeled feed and had the lowest final weight results.
Figure 11 – Relationship between final weight and feed intake of S.senegalensis at 34 DAH fed different
experimental diets. Each spot represent one tank per treatment. The treatment with Winflatplus diet and
the treatment with Winflatplus + F3 diet were represented in the figure by WF. This graphic was obtained
by the utilization of mean of heads to each treatment, where a quantile > 0.5 was used to identify that the values of heads used are values above the median. Since the feed intake is obtained through a ratio, it was necessary to apply a logarithm.
Figure 12 represents the relationship between final weight of sole post-larvae and feed intake at 44 DAH. In this Figure was also possible to verify that the treatment with F4 diet remained the treatment that ingested a lower quantity of labeled feed and had the lowest final weight results. As seen in the Figure 11, the treatment with Winflatplus diet ingested more labeled feed, however it was not the treatment with the
27
higher final weight. The others treatments presented similar results, however, the treatment with P1 diet and the treatment with F1 diet were the treatments that ingested a lower quantity of labeled feed and presented a higher final weight.
Figure 12 –Relationship between final weight and feed intake of S.senegalensis at 44 DAH fed different experimental diets. Each spot represents one tank per treatment. This graphic was obtained by the utilization of DW mean to each treatment, where a quantile > 0.5 was used. Since the feed intake is obtained through a ratio, it was necessary to apply a logarithm.
2.3
Discussion
This trial aimed to optimize the cost-benefit of formulation for a premium commercial weaning diet developed by Sparos Lda for flatfish larvae, Winflatplus.
During this trial, Senegalese sole presented an exponential growth, and with significant differences between the treatments. At the end of the trial it could be observed the existence of a group of treatments where the growth performances were significantly higher: Winflatplus+F3, F1, F2, F3 and P1 diets. The treatment with P1 diet
was the one that presented the higher growth performance with DW values of 67.1 mg. The treatment with F4 diet was the treatment that presented a lower growth performance, with 56.5 mg. In general, by comparing the values obtained for all treatments, it was verified that the treatment with the premium commercial weaning