TABLE OF CONTENTS
INTRODUCTION
Chapter 1. School type and resources: predictor and moderator effects for non-native students’ achievement
Chapter 2. Evidence Research-Study: a methodology for L2 research
Chapter 3. Understand variables and influence for L2 learners’ achievement
Chapter 4. Schools and resources as the direct effect that explains the performance of non-native students the most
INTRODUCTION
The “school” factor as an educational policy infrastructure is analyzed by the literature as being crucial in the context of the cognitive and linguistic performance of immigrant students. However, there is still a major gap, especially in the European context, regarding the specific effects that schools have on these students’ performance and performance areas, as well as on how the school can moderate the effect (in student performance) of other variables like mother tongue and socioeconomic status (Schnepf, 2007). Likewise, school factor related matters, such as resources and teachers, have not yet been clearly explored. This study aims to examine this effect relationship and the predominance of variables that explain performance and performance differentiation in linguistic minority groups. In the nineties, authors like Thomas and Collier (1997) explicitly identified the type of school and surrounding area, as well as respective resources (education), as one of the most influential factors for the academic success of minorities in American schools, surpassing the explanatory power of factors such as socioeconomic background of immigrant pupils and race differences. Later, other studies (Futrell & Gomez, 2008; Gandara, Rumberger, Maxwell-Jolly et al. 2003; Kraut, Chandler, Hertenstein et al., 2016) conducted a more realistic review of resources in schools and ascertained that non-native students, compared with the natives in the same class, are obtaining fewer qualifications and that teachers are ill-prepared. Above all, another question comes to the fore: the assessment tools are not validated or offer little regarding the real cognitive and language skills of linguistic minorities. Schools with more resources would be the most likely to increase performance and the socioeconomic expectations of students and their families (Portes & MacLeod, 1996). On the contrary, various studies have found that schools with more resources can lead to lower academic achievement and socio-emotional instability in non-native children (Nienaus & Adelson, 2013).
The latter data may be justified by the socioeconomic factors according to which schools are classified, because schools with higher socioeconomic status (but not necessarily with more resources for minorities) show greater inequality between groups
of students (Okamoto, Herda & Hartzog, 2013). However, the socioeconomic aspect of the school and the relationship of immigrant pupils with native peers are the most studied factors with regard to the “school” factor. The racial question per school (types of minorities and representation by districts) is also much looked at and is still one of the factors studied when analyzing different school policies in the US (Edwards, McMillon & Turner, 2015). Aspects like resources and teachers’ perception of them (supporting programs, educational materials, collaboration with families) are not as common in the literature. Focusing on school analysis as an explanatory factor for performance differences, we do not agree with Feniger and Lefstein (2014), who attach greater importance to the cultural background of students (Chinese) than to the host school’s educational system (schools in Australia and New Zealand), when the latter in fact gives students learning conditions at developed countries’ level. One could consider this overestimation of the “cultural background” factor if age and exposure were controlled variables in the study. The results of these Chinese students with higher scores than those of their native counterparts (of different nationalities and background, but in a similar situation in a developed country) are justified by other variables that may be influencing the results, such as the type of school resources (Nilsson & Axelsson, 2013; Waldow, Takayana & Sung, 2014) and mother tongue (Barac & Bialystok, 2012; Collins, Sidhu, Lewis et al., 2014, McLaughlin, 2015).
These are the limitations that we intend to examine in an ongoing research project in Portugal. In the context of European Schools, unlike in the US, the research is still insufficient, and in Portugal the evaluation of the effect of the type of school in the performance of immigrant minorities is almost unknown, (Contini, 2013; Crespo-Cebada Pedraja-Chaparro & Santín, 2014). This study examines whether state schools with different resources within the same district influence, from the point of view of statistical significance, the performance variability of non-native students in the same tests over the same assessment period. It also examines whether the school effect influences the predictive power of other close variables, such as the students’ nationality, mother tongue and the socioeconomic status (SES) of the students’ families. Our general research hypothesis resulted from three evidences from the literature in psychology and education: schools with more resources have higher academic success especially regarding their native students. Not all schools in Europe "customize" proficiency tests to immigrant children, even at pre-school level; the socioeconomic
factor appears as the main predictor, regarding the school type and performance differences between students and between nationality groups; the school and its composition is still an inconspicuous variable regarding its effect and specificities. Thus, the study is based on the following set of relationships: between schools that administer proficiency tests to their non-native students and the best performance of the assessed immigrant children; between schools that do not use such tests and low scores of immigrant children in the tests; between schools with more verifiable support programs (including physical and digital materials) and better performance of non-native students; and between the effect of the school variable and the predictor effect (performance) of the nationality, mother tongue and socioeconomic status variables.
Chapter 1. School type and resources: predictor and moderator effects for non-native students’ achievement
The type of school and students’ academic performance is a proven correlation, but the specifics change when applying this correlation to non-native school population. Several factors can modify the power of the "school" variable with regard to school results and there is well documented data about this relationship in the literature. However, the opposite relationship needs to be examined, that is, how the school variable can modify other factors in explaining school results. And little is known about the schools’ response to school minorities considering existing resources and teachers’ perceptions regarding one of the most decisive resources: proficiency assessment after arrival in the host country. With regard to this study, the “school” variable encompasses conceptual aspects related to the type of education provider, state or private, the type of existing resources, the socioeconomic status of native students and school location (related to more degraded areas or with greater diversity of language minorities). These aspects measure the similarities and differences in the performances of native and non-native students. In this study we intend to focus on physical resources (materials and support programs for non-native population). Older studies (Hao & Bonstead-Bruns, 1998) examined the variables with greater predictive power for performance differentiation of students from minority groups. The most obvious factors included socioeconomic status and parental investment. However, more recent studies (Bouakaz, 2007; Henry, Cavanagh, & Oetting, 2011; Schneider, Teske, & Marschall, 2000) have
shown that, regarding parental investment, it is determined by the type of school and its resources, which promote different forms of family support and parental involvement in their children's learning (Crosnoe & Cooper, 2010). On the other hand, the parental investment explanation advanced still in the nineties was attributed, mainly by non-Western authors, not to the school but to the nationality of the parents (Chao, 1996; Hynie, Guruge & Shakya, 2013) and to habits in relation to reading at home (De Graaf, De Graaf & Kraaykamp, 2000). European studies (Alba, Sloan & Sperling, 2011; Drange & Telle, 2010) have focused on the “school support” to immigrant students in European countries variable, to the detriment of other factors such as nationality or parental investment, and found more positive results when schools have more resources and more instruction time specifically for young immigrant students. Similarly, European authors have recently analyzed how minorities behave in European schools when it comes to choosing further education. Jonsson and Rudolphi (2011) attach greater importance to the vocational provision that schools offer. Recently, Portuguese authors, although with very scarce studies, have assessed the importance of the role and resources of Portuguese schools for their immigrant students (Ribeiro, Malafaia, Neves et al., 2016).
On the contrary, other European authors, specifically analyzing intergenerational mobility and transmission, have found that the socioeconomic factor is the most important in the differentiation of academic performance and career choice of students originating from minorities (Ichou, 2014; Hermansen, 2016). Again, they refer to parental investment but associated with the socioeconomic status that families have which influences the choices of their second generation (Hermansen, 2016). Portuguese authors also focus on the same theme but primarily the SES differences of non-native students (Nunes, Cardoso, Rocha et al., 2015). When we refer to socioeconomic status we mean, according to the indicators of the American Psychological Association (American Psychological Association, APA), the combination of education, income and professional occupation of parents. In the context of minorities (not only referring to immigrants), the SES has additional features that must be taken into account, such as race, ethnic background and migration experience. With regard to immigrant groups, normally they share low SES characteristics but with differences between nationalities, as documented in studies conducted in the nineties mentioned by the APA in the area of counseling (Cheung & Snowden, 1990; Rosado, 1990) and more recently in the field of
education (APA, 2012). This is the area that matters here and the intensive study of the APA (2012) documents in detail how the school is, after all, a major factor in the “achievement gap” of certain minorities. It refers specifically to nationalities, despite other associated features. Among these features, undoubtedly the SES stands out as the more specific and appropriate formula for school linguistic minorities, as in this analysis: family income and parent education (APA, 2012, p. 59). According to the same study, scientific research regarding the school population has changed conceptually since the nineties and started to review the characteristics of minorities and to define the types of socioeconomic groups, establishing idiosyncrasies for the school immigrant group. The focus was, however, on the analysis of the influence of inclusive schools for increased performance and continuation of studies of non-native students (Vigdor & Ludwig, 2008; Guzman & Schofield, 1995).
Three decades of evidence confirm the influence of the type of schools on the academic success of immigrant minorities: "Diversity still matters" (APA, p. 59). But the school type was analyzed not based on the supporting resources provided (including teachers’ perceptions), but on the racial representativeness of schools, with schools with greater racial and ethnic diversity being seen as less segregating. The least diverse schools are classified as promoting less the development and adaptation of minorities. In addition to the racial aspect that can be one of the school type definition criterion, these results exponentially represent American and not European school immigrant populations. This study aims to fill this gap. Does the type of school and its resources matter in the performance of immigrant minorities in educational systems other than the American, such as the Portuguese? Schnepf’s study (2007) in this field is particularly important because, based on an OECD study comparing academic performance of native and non-native students in ten European countries, he added immigrant student population of non-European English-speaking countries to the equation. The author concluded that non-native students of European schools perform significantly better than fellow immigrants, while this disparity does not occur between the same groups of students (native and non-native) in countries outside Europe that have English as the official language. The study concludes that the main difference lies in the explanatory factors: in cases such as the US, the L1 variable is accountable for the distinct performance between immigrant and native students, whereas in Europe there are other factors: the type of school and SES.
Whereas the concept of SES is clear and specified in the context of immigrant populations, it still seems important to clarify at this point the “immigrant populations” nomenclature and consider the concepts inherent to it. When referring to school immigrant population, one thinks of a diversity of linguistic minorities, which hinders the full understanding of the various groups of different students according to nationality and L1, and, very importantly, the characteristics associated with other minorities considered to be groups classified independently and differentiated from the "immigrant population”: ethnic minorities and socioeconomic groups. When we mentioned earlier the characteristics of these two other minorities, we reported what the literature commonly attributes to the immigrant population (including non-school): low socioeconomic status and diversity of ethnic groups (Kaida, 2013; Keels, 2009; Loeb, Soland & Fox, 2014). However, it is important to mention that in this study take the concept refers just to “immigrant population”, i.e. non-native population that has a more or less integrated position in the host country and is an active member, specifically the school population that is our target population, distinct from the other two ethnic and socioeconomic minorities. In this work, we will often refer to the immigrant population also as 'linguistic minorities'. Still, the combined characteristics of several minorities within immigrant population is common and currently classifies it in a fragile and plural way (Bornstein & Bradley, 2014; Hirschman, 2016). It is a conceptual issue that has been discussed since the nineties due to its consequences when interpreting statistical data and considering the negative and ambiguous implications in the care of the immigrant population in various sectors (Williams, 1996), specifically in the field of education (Portes & Macleoud, 1996). However, although it is imperative to recognize the borders, it is important to understand the socioeconomic and ethnic traits associated with the immigrant minority, especially with the purpose of identifying the populations, within the migration, that are more demanding regarding school resources.
From another perspective, Entorf and Minoiu (2005) also stress the importance of the socioeconomic variable to justify the differences in the PISA results. However, the authors highlight another variable external to the school: the type of language spoken at home by students. It is a factor that affects the results of other studies (Winsler, Díaz, Espinosa et al., 1999) that also support the resources of the European schools. The conditions of the school systems come again to the fore. Early intervention with regard to languages taught to non-native students make preschool and 1st cycle
schools the protagonists in controlling differences in academic performance and cognitive development of their new generation of students (Borgna & Contini, 2014; Entorf & Minoiu, 2005). As protagonists, schools really are struggling more with the issue of socioeconomic differences (school stratified composition) in schools (culture of futility) than with the differences of ethnic groups regarding the type of performance (Agirdag, Van Houtte & van Avermaet, 2012). On the one hand, recently authors in the fields of psychology and education have analyzed the predictor effect of school types and regions in which the results of PISA are still to be explained, even considering the school population groups within the same country (Crespo-Cebada et al., 2014). On the other hand, other recent studies have focused on the school differences between distant countries with language similarity (Gibson et al., 2013). Due to discrepancies in the results of PISA, the socio-cultural aspect has been widely analyzed as a mediating variable, but we do not agree with the conclusion of the study by Dronkers and Van der Velden (2013), which does not consider that the school and its socioeconomic status explain the differences in academic performance, especially for the Muslim population. The literature guides us to the hypothesis that better schools (with more preparation perceived by teachers) lead to better student outcomes (Hanushek & Woessmann, 2010). Jackson, Jonsson and Rudolphi (2012) offer another explanation. They have analyzed the schools of two European countries (UK and Sweden) as making a difference as choice-driven schools (“choice-driven”, p. 1) in the heterogeneity of minorities that differ between the two countries. The school and its resources appear to be responsible for making respondents more or less responsive to the system, with the Asian groups figuring higher in terms of academic results. These results are consistent with APA’s data (2012) and also with results of our recent study (Figueiredo, Martins & Silva, 2016) that partially confirms this Asian group primacy. In fact, in our study, the Asian minority (China) has the best scores in most tests, even when compared to their European counterparts. It is also this group that normally has higher SES, especially with regard to the type of school attended (with more resources than schools with Hispanic and African minorities, especially in the US, APA). But the other Asian group (South Asia) has the worst performance. This type of classification and findings should be taken into account in studies in this area, in which there is also a gap in research.
Regarding school resources, it is important to note the use of the diagnostic assessment of immigrant pupils (Figueiredo, Alves Martins & Silva, 2014; Mateus,
2009), although in Portugal we have good research on this matter, albeit almost all published just in Portuguese. Very recent studies point to the discrepancy between tests and test takers, and the lack of preparation of the evaluators (Edele, Seuring, Kristen et al., 2015; Kraut, Chandler, Hertenstein et al., 2016.). Another limitation regarding assessing non-native children lies in the differences in immigration generations that may require different resources and take ownership of different cognitive strategies in academic and language tests (Duong, Badaly, Liu et al., 2016). Duong et al. (2016) introduce in second language (L2) study performance differences depending on the generation of students, but they also stress the need to pay attention to the school’s resources (the tests) and to take distance from the self-assessment that commonly literature mentions to infer the “immigrant advantage”: “immigrant advantage may be overestimated in studies that use self-reported rather than school-reported achievement” (p.1). In fact, the literature that examines the immigrant advantage (Dustmann, Frattini & Lanzara, 2012) combined with the scores of tests based on self-assessment of students becomes ambiguous and suggests differences between minorities and overestimation of groups like the Asian, which should be totally revisited (Duong et al., 2016), as stated above on the classification of Asian minorities. Still on the specifics of these minorities, and in the American context, studies show (Yamamoto & Li) that parents originating from Asian countries value the type of school teachers the most, compared to parents originating from European countries who, on the contrary, value school resources to address the needs of students and their families. The assessment practices are intrinsically connected to the practices and scientific and pedagogical training of primary and secondary school teachers. These practices vary from school to school, especially in the US, with regard to schools differentiated by districts (Hopkins, Lowenhaupt, & Sweet, 2015). American studies closely examine this type of differences from a demographic perspective of immigrant populations and the viewpoint of the specialized training of teachers. During our research in this longitudinal study, we also conducted a comparative analysis of three American districts which resulted in a cluster of differences between schools and teachers’ practices depending on the district where the schools are based. The students’ nationality and parental investment were not conditioning. In the study by Rosenfeld, Leung and Oltman (2001), teachers from different backgrounds and preparation showed clear differences regarding the concept of support provided to non-native students, especially in terms of assessment tasks in proficiency tests. Accordingly, the study by Agirdag, Merry & Van Houtte (2014)
should be noted. It examined the perceptions and practices of teachers from 68 schools in Belgium, focusing on five of these schools, about teaching multicultural classes. The authors detected that the most elitist schools and with a lower percentage of immigrant students are not recognizing the cultural content best methods and are more inexperienced. In this case, the school is the predictor of teachers’ attitudes and practices.
In short, literature indicates that the composition of schools has been widely discussed in American literature and recently European authors have studied the moderating influence of the “school” variable in national or local results (specific schools or groups) of non-native students. On the other hand, the studies point to a counterbalance of other factors that have been overvalued in this relationship with the performance of minorities: socioeconomic status of students, parental investment according to nationalities and to socioeconomic status, and type of languages spoken at home. In most studies, the situation of socioeconomic disadvantage appears as a predictor, after parental investment. However, how the school is a moderating variable to operationalize the effect of these variables has not been studied. Moreover, there is no consensual evidence, based on a specific set of schools, of the relationship between resources (including materials and mother tongue support programs), effectively administered proficiency tests, and student performance (performance in tests to assess language and cognitive performance, e.g. verbal analogies, vocabulary, recall).
In the present study we expect to find performance differences in a set of four schools differentiated according to the type and quality of resources (including the resource “proficiency assessment” within schools) perceived by teachers (i); it is expected that when the effect of the type of school is controlled, that there is an increase in the statistically significant difference in performance of non-native groups (in various language and cognitive tasks in Portuguese as a second language) depending on the students’ mother tongue (ii), their nationality (iii), and their socioeconomic status (iv). It also expected that the probable performance difference is always observed in all the same tests within the set of tests used. Therefore, two samples will be used in the study to respond to the four hypotheses advanced. As the evidence presented earlier suggests, socioeconomic status (Agirdag, Van Houtte & Van Avermaet, 2012; Dronkers & Van der Velden, 2013; Entorf & Minoiu, 2005; Hermansen, 2016; Ichou, 2014; Okamoto,
Herda & Hartzog, 2013), nationality (Dustmann, Frattini & Lanzara, 2012; Feniger & Lefstein, 2014) and mother tongue (Barac & Bialystok, 2012; Collins, Sidhu, Lewis et al., 2014; McLaughlin, 2015) are determinants of the performance of linguistic minorities which may not be affected by the school variable effect. Other authors (Borgna & Contini, 2014; Hanushek & Woessmann, 2012; Jonsson & Rudolphi, 2012) present recent results that confirm the predominance of the school factor (and respective resources or lack of them) to explain performance variability in non-native student groups.
References
Agirdag, O., Merry, M. S., & Van Houtte, M. (2014). Teachers’ Understanding of Multicultural Education and the Correlates of Multicultural Content Integration in Flanders. Education and Urban Society, 0013124514536610.
Agirdag, O., Van Houtte, M., & Van Avermaet, P. (2012). Ethnic school segregation and self-esteem: The role of teacher–pupil relationships. Urban Education. doi: 10.1177/0042085912452154.
Alba, R., Sloan, J., & Sperling, J. (2011). The integration imperative: The children of low-status immigrants in the schools of wealthy societies. Annual Review of Sociology, 37, 395-415.
American Psychological Association, Presidential Task Force on Educational Disparities. (2012). “Ethnic and racial disparities in education: Psychology’s contributions to understanding and reducing disparities”. Retrieved from
http://www.apa.org/ed/resources/racial-disparities.aspx
Barac, R., & Bialystok, E. (2012). Bilingual Effects on Cognitive and Linguistic Development: Role of Language, Cultural Background, and Education. Child Development, 83(2), 413–422.
Borgna, C., & Contini, D. (2014). Migrant achievement penalties in western europe: do educational systems matter? European Sociological Review, jcu067.
Bornstein, M. H., & Bradley, R. H. (Eds.). (2014). Socioeconomic status, parenting, and child development. Routledge.
Bouakaz, L. (2007). Parental involvement in school: What promotes and what hinders parental involvement in an urban school. Malmö högskola, Lärarutbildningen.
Chao, R. K. (1996). Chinese and European American mothers' beliefs about the role of parenting in children's school success. Journal of Cross-Cultural Psychology, 27(4), 403-423.
Collins, F. L., Sidhu, R., Lewis, N., & Yeoh, B. S. (2014). Mobility and desire: International students and Asian regionalism in aspirational Singapore. Discourse: Studies in the cultural politics of education, 35(5), 661-676.
Contini, D. (2013). Immigrant background peer effects in Italian schools. Social science research, 42(4), 1122-1142.
Crespo-Cebada, E., Pedraja-Chaparro, F., & Santín, D. (2014). Does school ownership matter? An unbiased efficiency comparison for regions of Spain. Journal of Productivity Analysis, 41(1), 153-172.
Crosnoe, R., & Cooper, C. E. (2010). Economically disadvantaged children’s transitions into elementary school linking family processes, school contexts, and educational policy. American Educational Research Journal, 47(2), 258-291.
De Graaf, N. D., De Graaf, P. M., & Kraaykamp, G. (2000). Parental cultural capital and educational attainment in the Netherlands: A refinement of the cultural capital perspective. Sociology of education, 92-111.
Donné, N. (2014). European variations in socioeconomic inequalities in students’ cognitive achievement: The role of educational policies. European Sociological Review, 30(3), 329-343.
Drange, N., & Telle, K. (2010). The effect of preschool on the school performance of children from immigrant families: results from an introduction of free preschool in two districts in Oslo.Retrieved from http://hdl.handle.net/11250/180001
Dronkers, J., & Van der Velden, R. (2013). Positive but also negative effects of ethnic diversity in schools on educational performance? An empirical test using PISA data. In Integration and inequality in educational institutions (pp. 71-98). Springer Netherlands. Duong, M. T., Badaly, D., Liu, F. F., Schwartz, D., & McCarty, C. A. (2016). Generational Differences in Academic Achievement Among Immigrant Youths A Meta-Analytic Review. Review of Educational Research, 86(1), 3-41.
Dustmann, C., Frattini, T., & Lanzara, G. (2012). Educational achievement of second-generation immigrants: an international comparison. Economy Policy, 143-185.
Edele, A., Seuring, J., Kristen, C., & Stanat, P. (2015). Why bother with testing? The validity of immigrants’ self-assessed language proficiency. Social science research, 52, 99-123.
Edwards, P. A., McMillon, G. T., & Turner, J. D. (2015). Change is gonna come: Transforming literacy education for African American students. Teachers College Press. Entorf, H., & Minoiu, N. (2005). What a difference immigration policy makes: A comparison of PISA scores in Europe and traditional countries of immigration.German Economic Review, 6(3), 355-376.
Feniger, Y., & Lefstein, A. (2014). How not to reason with PISA data: An ironic investigation. Journal of Education Policy, 29(6), 845-855.
Figueiredo, S., Martins, M., & Silva, C. (2014). Assessment effectiveness for second language learners: predictors, reliability and discriminant profiles. The European Proceedings Social and Behavioural Sciences, 185-200.
Figueiredo, S., Martins, M., Silva, C. (2016). Modern languages and Modern Learners: different scores among Asian immigrant minorities for academic and language skills development. International Journal of Multidisciplinary Research, VI(1), 71-77.
Futrell, M. H., & Gomez, J. (2008). How tracking creates a poverty of learning. Educational leadership, 65(8), 74-78.
Gandara, P., Rumberger, R., Maxwell-Jolly, J., & Callahan, R. (2003). English Learners in California Schools: Unequal resources, Unequal outcomes. Education policy analysis archives, 11, 36.
Guzman, N., & Schofield, R. (1995). Systemic Restructuring for Successful Inclusive Schools: Leadership and a Collaborative Evaluation Model. Retrieved from
http://eric.ed.gov/?id=ED380863
Hanushek, E. A., & Woessmann, L. (2010). The economics of international differences in educational achievement (No. w15949). National Bureau of Economic Research. Hao, L., & Bonstead-Bruns, M. (1998). Parents Child Differences in Educational Expectations and the Academic Achievement of Immigrant and Native Students. Sociology of Education, 71(3), 175-198.
Henry, K. L., Cavanagh, T. M., & Oetting, E. R. (2011). Perceived parental investment in school as a mediator of the relationship between socio-economic indicators and educational outcomes in rural America. Journal of youth and adolescence, 40(9), 1164-1177.
Hermansen, A. S. (2016). Moving Up or Falling Behind? Intergenerational Socioeconomic Transmission among Children of Immigrants in Norway. European Sociological Review. doi: 10.1093/esr/jcw024.
Hirschman, C. (2016). From High School to College: Gender, Immigrant Generation, and Race-Ethnicity. Russell Sage Foundation.
Hopkins, M., Lowenhaupt, R., & Sweet, T. M. (2015). Organizing English Learner Instruction in New Immigrant Destinations District Infrastructure and Subject-Specific
School Practice. American Educational Research Journal, doi:
10.3102/0002831215584780.
Hynie, M., Guruge, S., & Shakya, Y. B. (2013). Family relationships of Afghan, Karen and Sudanese refugee youth. Canadian Ethnic Studies, 44(3), 11-28.
Ichou, M. (2014). Who they were there: Immigrants’ educational selectivity and their children’s educational attainment. European sociological review. doi: 10.1093/esr/jcu071.
Jackson, M., Jonsson, J. O., & Rudolphi, F. (2012). Ethnic inequality in choice-driven education systems a longitudinal study of performance and choice in England and Sweden. Sociology of Education, 85(2), 158-178.
Jonsson, J., & Rudolphi, F. (2011). Weak Performance, Strong Determination: School Achievement and Educational Choice among Children of Immigrants in Sweden. European Sociological Review, 27, 487-508.
Kaida, L. (2013). Do host country education and language training help recent immigrants exit poverty? Social Science Research, 42 (3), 726–741.
Keels, M. (2009). Ethnic group differences in early head start parents’ parenting beliefs and practices and links to children's early cognitive development. Early Childhood Research Quarterly, 24(4), 381-397.
Kilpi-Jakonen, E. (2012). Does Finnish educational equality extend to children of
immigrants? Nordic Journal of Migration Research, 2(2), 167–181.
doi: 10.2478/v10202-011-0039-4
Kraut, R., Chandler, T., & Hertenstein, K. (2016). The Interplay of Teacher Training, Access to Resources, Years of Experience and Professional Development in Tertiary ESL Reading Teachers’ Perceived Self-Efficacy. GIST Education and Learning Research Journal, 12 132-151.
Lavy, V. (2015). Do differences in schools' instruction time explain international achievement gaps? Evidence from developed and developing countries. The Economic Journal, 125(588), 397-424.
Loeb, S., Soland, J., & Fox, L. (2014). Is a Good Teacher a Good Teacher for All? Comparing Value-Added of Teachers With Their English Learners and Non-English Learners. Educational Evaluation and Policy Analysis, 36(4), 457-475.
Mateus, H. (2009). Teste de Diagnóstico do Português Língua Não Materna. Direção-Geral de Educação.
McLaughlin, M. (2015). Linguistic minorities and the multilingual turn: Constructing language ownership through affect in cultural production. Multilingua.
Niehaus, K., & Adelson, J. L. (2013). Self-concept and native language background: A study of measurement invariance and cross-group comparisons in third grade. Journal of Educational Psychology, 105(1), 226.
Nilsson, J., & Axelsson, M. (2013). " Welcome to Sweden...": Newly Arrived Students' Experiences of Pedagogical and Social Provision in Introductory and Regular Classes. International Electronic Journal of Elementary Education, 6(1), 137.
Okamoto, D. G., Herda, D., & Hartzog, C. (2013). Beyond good grades: School composition and immigrant youth participation in extracurricular activities. Social science research, 42(1), 155-168.
Portes, A., & MacLeod, D. (1996). Educational progress of children of immigrants: The roles of class, ethnicity, and school context. Sociology of education, 255-275.
Ribeiro, N., Malafaia, C., Neves, T., & Menezes, I. (2016). Immigration and the Ambivalence of the School Between Inclusion and Exclusion of Migrant Youth. Urban Education, 1-29.
Rosenfeld, M., Leung, S. & Oltman, P. (2001). The reading, writing, speaking, and listening tasks important for academic success at the undergraduate and graduate levels. Princeton: Educational Testing Service.
Schneider, M., Teske, P., & Marschall, M. (2000). Choosing schools: Consumer choice and the quality of American schools. Princeton University Press.
Schnepf, S. V. (2007). Immigrants’ educational disadvantage: an examination across ten countries and three surveys. Journal of population economics, 20(3), 527-545.
Thomas, W. P., & Collier, V. (1997). School Effectiveness for Language Minority Students. NCBE Resource Collection Series, 9.
Vigdor, J. L., & Ludwig, J. (2008). Segregation and the test score gap. Steady Gains and Stalled Progress, 181-211.
Waldow, F., Takayama, K., & Sung, Y. K. (2014). Rethinking the pattern of external policy referencing: media discourses over the ‘Asian Tigers’’PISA success in Australia, Germany and South Korea. Comparative Education, 50(3), 302-321.
Winsler, A., Díaz, R. M., Espinosa, L., & RodrÃguez, J. L. (1999). When learning a second language does not mean losing the first: Bilingual language development in low‐income, Spanish‐speaking children attending bilingual preschool. Child development, 70(2), 349-362.
Chapter 2. Evidence Research-Study: a methodology for L2 research
Students’ sample: To determine the learners’ sample were selected 108 immigrant students from Portuguese schools with Portuguese as L2. Participants were aged between 7 and 18 years of age (M= 13; SD= 2,7). 46 (43%) male and 59 (55%) female, from different countries: 25 (23%) from China, 6 (6%) from Latin American countries, 31 (29%) from Eastern Europe, 19 (18%) from Portuguese-Speaking African Countries (PALOPs), 12 (11%) from Western Europe, 14 (13%) from other Asian countries (other than China). Speakers of 28 home languages (or first language - L1) distributed according to six language groups (determined by language family): 33 speakers of Mandarin, 32 speakers of Romance languages, 14 speakers of Slavic languages, 11 speakers of Portuguese-based creole, 10 speakers of Indo-Aryan languages, and 2 speakers of Afro-Asian languages. Concerning the arrival date (and age of onset), 14 students arrived to Portugal between 2001 and 2005, 21 between 2006 and 2009, 55 between 2010 and 2014. 61% immigrated more recently (the study was initiated in 2013/2014). Students come from lower to middle socioeconomic backgrounds (education and occupation of families was computed, income was not identified). Participants were right-handed (laterality was identified) and attended 11 state schools within the same geographical area: Lisbon.
From the 108 sample 36 participants were chosen from four schools to match the schools from the second sample: teachers. Subjects were classified by schools according to the proficiency levels defined by the Common European Framework of Reference for Languages – CEFR (European Commission, 2001) and our sample includes only the first three groups: A1 (beginner level), A2 (elementary level) and B1 (threshold level). Only 23 students were effectively assessed in school.
This criterion was based on the school match (teachers and students from the same schools to provide the comparison between students’ achievement, school resources and teachers’ perceptions). ANOVA tests were carried out to compare results according to the participants' school and in relation to several variables considered in the study hypotheses. The results were: F(3,39) = 9.956 p = .000 for the students’ nationality; F(3,39) = 3.050, p = .040 for the students’ First Language; F(3,39) = 10.737, p = .000
for parents’ nationality; and F(1,14) = 18.951, p = .001 for proficiency level assessed by the school (school resources). No significant difference was found in the different socioeconomic groups.
Schools’ sample: To classify the schools in order to determine their resources for immigrant students, the answers of 77 teachers, aged between 32 and 62 years (M=47 years, SD=7.4) were examined, of whom 11 (14.3%) were male and 60 (77.9%) female, with an average of 22 years teaching experience (SD=6.7). They represent nine schools/groupings in the district of Lisbon, Only four schools matching students’ schools were selected for this study. 58 (75.3%) have experience of multicultural classes and 16 (20.8%) have never had non-native students in their classes. Respecting the Language Testing measures: only 46 (59.7%) reported to having administered them at the beginning of the year).
From the 77 teachers’ sample, 36 were selected from the same four students’ school to compare school resources as the main variable for this study. In total there are 77 participants, teachers and students in equal numbers, and the four schools were divided by different municipalities in the district of Lisbon: two schools in the center and two others in the periphery. We assigned a number to each school based on its characteristics, which we obtained from univariate analysis of variance in order to compare schools regarding the students’ age, school year according to the students’ country of origin and the host country, host period, L1 instruction and proficiency assessment through school tests. The results were significant for students’ age (F(3,40) = 15.027, p = .000), for the grade level (F(3,40) = 21.176, p = .000), for school grade obtained in the country of origin (F(3,25) = 6,685, p = .002), and for assessed proficiency (F(1,14) = 4.846, p = .046). No significant difference was found in the SES, and the L1 parallel instruction was not applicable considering that these schools do not offer language support for L1 based instruction. As for the homogeneity of variance, the Levene’s test revealed that the variances differ only in groups of assessed and non-assessed students (only two schools meet the requirement to conduct diagnostic assessment). Considering this result, in order to define the characteristics of the schools regarding the assessment variable (school resources), we used the Kruskal-Wallis test for independent samples since the ANOVA cannot be used in this context in which the parameters criteria are not respected (homogeneity of variances) for this type of
statistical tests. Thus, we found that school 1, followed by school 3 and compared to the others, has older students (over 10 and under 17 years of age); students of schools 1 and 3 are in more advanced education levels, as opposed to school 4 that has the youngest immigrant students studying 1st cycle education. Naturally, students of schools 1 and 3 have more schooling completed in their countries of origin, unlike those in schools 2 and 4. However, school 1 has the lowest host period (students arrived in Portugal and to school 1 later) as opposed to school 3. None of the schools provides L1 support to students and only schools 1 and 2 conducted assessment tests. We did the independent sample Kruskal-Wallis test (non-parametric) on these two schools and found that there were differences between the two schools regarding the tests’ results and the median comparison analysis shows that school 1 has higher proficiency students than students from school 2 (p. = 025).
Instruments
Students
A 15-task test (with multiple items) was used to assess L2 learners’ skills in Portuguese, using, for example, verbal reasoning, vocabulary, writing, word recall and retelling tests. The tasks were developed and adapted based on literature review of available and recent tests in international repositories in the field of performance assessment in a foreign language and in second language. The recognized validity of the original tests from which the tests to test the Portuguese population were adapted was one of the criteria to ensure their suitability to groups of students according to low proficiency levels. On the other hand, we were interested in using the tests with several groups classified by the CEFR as low proficiency to check how their performance showed in our tests and comparing them to the levels (A1, A2, and B1) awarded to students by schools. It should be noted that all schools were duly informed about the proficiency levels when there was testing and classification to be given. One of the gaps noted was the absence of tests or speaking diagnostic assessment in schools for minority newcomers. These tests were carefully assessed for internal consistency and correlation (between tests and related items), revealing appropriateness and validity for almost all tests. Some of the tests also indicated non-native students’ level of lexical knowledge in
Portuguese, and we crossed the data collected in all tests and noticed the performance influence on vocabulary tests on the remaining tests, i.e. the more correct the vocabulary or word recall lists, the better the performance observed in different tasks.
The vocabulary chosen for each test followed a criterion found to be the most appropriate: vocabulary difficulty index according to the frequency and difficulty profiles already validated in Portugal for a lexical index - the Corlex (Bacelar, 2001). It should be noted that the proper use of this instrument relates to the need to detect inconsistencies in the tests’ scores for each student and it should be able to identify more correct properties for future tests to be used in schools (Gándara, 2015). According to recent data collected by Edele, Seuring and Kristen (2015), we also followed the assumption that one should use real performance tests more than self-assessment often found in L2 research, which in the last decades has proven to be of limited validity (Brantmeier & Vanderplank, 2012). Moreover, the measures used are not always previously validated (Carter & Dunning, 2015), which we consider to be one of the greatest weaknesses of the existing Core Common Standards in Europe and elsewhere. These guiding documents favor mostly qualitative self-assessment tests that are far from informing about the actual performance of immigrant pupils. On the other hand, as Edele et al. indicate, samples of studies with self-assessment measures are too small (Ross, 1998) or the tests have a few number of points. One of the striking results of the fragility of the validity of the tests used is the huge correlation variability values (although positive) between the tests and/or items. This is one aspect that we noted in this study, which reports positive consistency far from the variability found in other studies. Another problem identified in the area of instruments also by Edele et al. results from the use of Foreign Language tests with L2 students who are different scenarios, because they are distinct populations. The variability of correlations will probably be larger and less valid. Yet another limitation pointed out by the above authors is the little heterogeneity of the samples regarding age. This is another aspect we have tried to keep in the students’ sample as it encompasses a higher age range.
We conducted a series of univariate analyzes of variance for all identified tasks, except for the tests excluded after the Exploratory Factorial Analysis (Table 1), in order to identify performance differences among groups established according to mother tongue (L1; named also as first language or home language), nationality and the SES,
but considering the influence of the School covariate. Differences were found between groups for the tests listed in this section:
Picture Naming
The picture naming test Diagnostic Test for Portuguese as a Non-Native (Mateus, 2009) - Diagnostic Test of Portuguese as Second or Foreign Language - includes 36 pictures and has high internal consistency (.94). Students are asked to name, in writing rather than orally, as in the original test, the pictures as they are sequentially shown over 5 pages. The test originally aims to identify the vocabulary skills of immigrant students in second or foreign language and in a non-complex frequency level. This criterion was established according to CORLEX (Bacelar, 2001), the Portuguese index of vocabulary frequency and difficulty. The total score for this task is 12 points.
Semantic Associations
The 6-item semantic association test was adapted from the Woodcock-Munoz Language Survey-Revised (WMLS-R, 2005). The task adapted to Portuguese showed high internal consistency (.86). Regarding the size of vocabulary, this test aims to assess students’ ability to identify semantic relationships between words at random by completing the six items with the respective synonyms and antonyms of each word in Portuguese. The task is assessed as follows: 2 points for each correct answer (total score: 12 points). Example: word: "rich _____ (synonym) ____ (antonym).
Verbal Analogies
The 6-item verbal analogy test was adapted from Verbal Analogies (Test no. 2) by “Woodcock-Munoz Language Survey-Revised (WMLS-R, 2005) and the Portuguese adapted version has a Cronbach’s alpha of .60. The test aims, within verbal reasoning, to assess how the student, whose mother-tongue is not Portuguese, completes six sentences based on vocabulary and the proposed analogies. The verbal analogy task aims to measure understanding of logical association within random phrase contexts. The test scores as follows: 1 point for each correct answer (total score: 6 points). Example 1: Fill in the missing word by logic association: Star is to sky as fish is to ____.
Morphological Extraction
The morphological extraction test (or morphological change) has 4 items and was adapted from the Morphological Extraction Test by August, Kenyon, Malabonga et al. (2001). In this study, it has a Cronbach's alpha of .53. The test aims to assess individuals’ ability to make modifications and extractions from a derived word in a given sentence context. In the case of L2 learners, it is intended to further check, in terms of vocabulary and verbal reasoning, the influence of transfer between mother tongue and host language during the morphological change process. The change is analyzed in terms of morpheme conversion into new words in the dominant language. The task is calculated as follows: 2 points for each correct extraction, 1 point for partially correct extraction (total score: 8 points). Example: Word: Friendship/Sentence: The classmates are my ______.
Vocabulary Match
The test aims to assess the lexical competence of individuals by choosing the correct answer from five groups of three options, and by completing a series of exercises whose complexity increases gradually per item. The choice of vocabulary followed the order of complexity and frequency content of the CORLEX (Bacelar, 2001). The CORLEX has the frequency and difficulty levels of the lexicon in European Portuguese. For this task, we had words of low and average difficulty. The test has a Cronbach's alpha of .85. Among the options, several distractors using very similar words but with different semantics were used. The score was estimated from 0 to 3, and 3 represents over 9 correct answers in a total of 15 items. Example: Match the appropriate synonym to the word "understand". Correct answer: “realize”.
Text Recall
The recall test was created to evaluate the attention and memory skills of non-native students after their reading of three short. They should remember in writing as many words as they can, as well as the events according to that order that they appear in the original texts previously read. The selected texts are unrelated and they are excerpts from authentic Portuguese books that appear in the contents Program of K-12 levels. Students were instructed on the test procedure: to read a sequence of three short texts in
Portuguese; then to remember as many words they can and report in writing. For the scoring only the words and facts correctly recalled were positively considered (2 points distributed for word recalled and event correctly ordered).
Cognates Awareness Test
The Cognates Test integrates 5 items and was adapted from the Cognates Awareness Test (August, Kenyon, Malabonga et al., 2001). The Portuguese adapted version showed a Cronbach’s alpha of .70 (consistent with the original test). In the verbal reasoning domain, this task examines the decoding ability based on transfer strategies of L2 learners considering a words list containing cognates (similar words in visual-phonological features across L1 and L2). Attending to the heterogeneity of language speakers, we expect better performances for romance language speakers (L1: Spanish, French, Catalan) considering that linguistically the languages with origin in the same family share more similarities in vocabulary and semantics. On the other hand the cognates also are along with the ‘false friends’ (words despite visually similar are distinct in meaning) across approximate languages. The ‘false friends’ are the main obstacle for the cognates identification. Score: 1 point for each correct answer (total score: 5 points), 0 for incorrect answers.
Metaphor Comprehension
This test aims to measure the understanding that non-native students have of different idiomatic expressions (so particular to L2) and how they can write their reasoning in relation to each of four metaphors. It has a Cronbach’s alpha of .60. Students are requested to explain each item literally. The difficulty index of this test is high because it is figurative language, decoded in a language other than the mother tongue. Each metaphor is assigned 1 point if the answer is correct, 0 if it is incorrect (total score: 4 points).
Table 1
Exploratory Factorial Analysis: all the tests of the battery administered to the L2 Portuguese learners
Factor I Factor II Factor III Factor IV Factor V verbal reasoning, recall oral phonological unfamiliar writing and vocabulary comprehension manipulation sounds
Measures Naming task .546 Semantic associations .761 Verbal analogy Extraction Vocabulary match Writing Cognates Metaphor language Syllable awareness Writing comprehension Reading recall Accent detection Non-words Conversion nonwords Blending Retelling Words recall Oral comprehension Comprehensibility .477 .729 .748 .688 .758 .724 .776 .447 .516 .840 .804 .711 .679 .648 .693 .802 .664 % of explained variance .36 .8,7 .8 .7 .65
Questionnaire to identify schools’ resources
For teachers of the schools studied in this work, we used a questionnaire based on the Alberta Education indicators (2012, p. 2) to know the level of evidence of certain school practices and resources (non-existent, emerging or evident resources/practices) in the specific area of support provided to L2 learners of Portuguese (and their families). Following the Alberta Education indicators, we adapted 10 items distributed by the following dimensions and in this order: differentiated practices by groups of individuals (L1), by students at different levels of proficiency, planning of the school's staff in terms of support and definition of practices, support offered to groups with background educational deficit, physical or digital measures that stimulate immigrant students’ parental investment, physical materials for L2, and targeted support to L1 students (see table 2). All items were answered on a scale of 1 to 3 with 1 being equivalent to "missing resource" and 3 "evident resource". Regarding the teachers and school resources, we considered the schools that have implemented, or not, proficiency tests according to the Common European Framework Reference for Languages (European Commission, 2001).
Teachers and students were assessed between 2013 and 2016 in the same primary and high schools in the district of Lisbon. The 108 students were firstly examined, then the 77 teacher completed the questionnaire, further reduced to 36 to match the four schools contemplated in this study. After obtaining the informed consent and the demographic record of the selected school population, the 10-item questionnaire for the teachers was answered and assessed (using points) according to the original test. Only four schools were selected for the statistical analyzes conducted in this study in order to match students and teachers’ schools.
Table 2
Existent resources (perceived by teachers) in each school concerning L2 learners’ education School Different practices for leaners Explicit practices in classroom Support for lower proficiency learners Staff Support for leaners with educational deficit Support to families Didactic materials Support for learners’ L1 Software/ technology resources 1 M 2,00 2,22 2,89 2,44 2,67 1,33 1,78 1,50 1,75 N 9 9 9 9 9 9 9 8 8 SD ,707 ,972 ,333 ,726 ,707 ,707 ,667 ,535 ,707 Median 2,00 3,00 3,00 3,00 3,00 1,00 2,00 1,50 2,00 2 M 1,50 2,00 2,00 2,00 2,00 1,50 1,50 1,50 1,50 N 2 2 2 2 2 2 2 2 2 SD ,707 1,414 1,414 1,414 1,414 ,707 ,707 ,707 ,707 Median 1,50 2,00 2,00 2,00 2,00 1,50 1,50 1,50 1,50 3 M 2,40 2,43 2,33 1,87 1,80 1,53 1,67 1,73 1,79 N 15 14 15 15 15 15 15 15 14 SD ,632 ,756 ,617 ,834 ,862 ,743 ,724 ,799 ,802 Median 2,00 3,00 2,00 2,00 2,00 1,00 2,00 2,00 2,00 4 M 2,14 2,13 2,00 1,50 2,14 1,29 1,75 1,38 1,38 N 7 8 8 8 7 7 8 8 8 SD ,900 ,835 ,756 ,926 ,690 ,488 ,707 ,518 ,518 Median 2,00 2,00 2,00 1,00 2,00 1,00 2,00 1,00 1,00 Data analysis
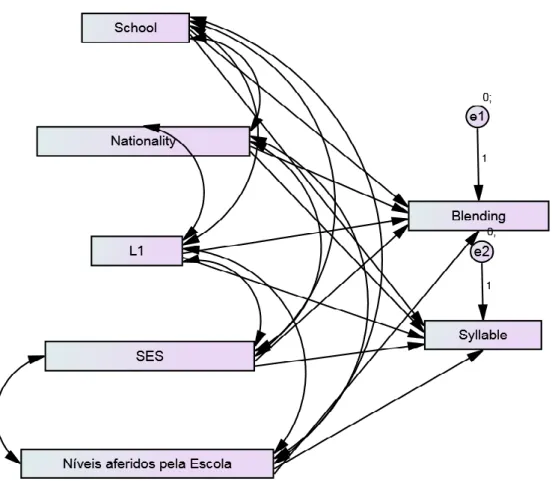
Repeated analyzes of univariate variance tests (effect size included) and covariance test (ANCOVA) were used (SPSS version 23) to identify whether there were significant differences among the four selected schools as regards the existence of resources and non-native student’ performance, and how this difference would be reflected in the groups’ performance established according to mother tongue, nationality and socioeconomic status. We also used the Structural Equation Model (SEM), using
AMOS, to proceed with a Confirmatory Factor Analysis (CFA) to corroborate the univariate analyzes’ information: tests’ scores are significantly impacted by the school variable and its resources for immigrant children. The hypotheses of Part I of this study were:
1. It is expected that the resources of the four schools, perceived by teachers, determine the school's influence on the results of the performances, by test. The conceptual domain “resources” include the proficiency tests used, or not, by each school and respective teachers. From this hypothesis we can specify the following conditions:
- There are differences between schools that do not use the proficiency tests and the low scores of immigrant children in the tests;
- There are differences between schools with more verifiable support programs (including physical and digital materials) and better performance of non-native students;
2. It is expected that when the effect of the type of school is controlled, the mother tongue significantly influences the difference in performance in the tests between groups of participants (students);
3. It is expected that when the school effect is controlled, the nationality of the students significantly influences the difference in performance in the tests between groups of participants (students);
4. It is expected that when the school type effect is controlled, the socioeconomic status significantly influences the difference in performance in the tests between groups of participants (students).
Analysis of Variance (ANOVA’s and Kruskal-Wallis) and One-Way Analysis of Covariance (ANCOVA)
In all the hypotheses, repeated measures of univariate analysis of variance tests were used to identify significant differences among groups and effect sizes, as well as One-Way Analysis of Covariance to establish if the "school" covariate influences and/or increases the effect of other variables with regard to performance in each test. In order to use ANOVA tests and then ANCOVA, the assumptions of the sample to use the
above parametric tests were first reviewed, considering the independent variables (school, L1, nationality, SES and measurement levels) and the dependent variables (tests and school resources). The sample normality criteria were verified (using the Shapiro-Wilk test) as well as the homogeneity variance (through Levene’s test) in the relationship between the independent variables (L1 and school type) and dependent ones (the tests).
It was concluded that for the L1 independent variable, the retelling (recall), naming, semantic relationships and vocabulary tests showed lack of homogeneity (Levene values: p> .05). However, in most of the tests the sample remained homogeneous and parametric tests were conducted to verify the confirmation/rejection of our hypothesis, having ensured the other assumptions (normality). In the case of ANCOVA, it was decided to keep the test considering its statistical feasibility (nonparametric ANCOVA) for, even in cases with non-parametric tests, the test is valid as the studies show due to the robustness of ANCOVA for conditions where normal assumptions are violated (Akritas & Arnold, 2000; Akritas, 2004; Wang & Akritas, 2006).
For the nationality variable, the sample showed lack of homogeneity in only two tests (Levene values: picture naming: p= .038 and extraction: p= .001). The Shapiro-Wilk test revealed normality problems (p. <.05) only in groups with fewer individuals (<10) identified in the Latin America, Eastern Europe and Asia (Southern) groups. However, in most of the tests the sample remained homogeneous and parametric tests were carried out to verify the confirmation/rejection of our hypothesis, the other assumptions having been ensured and the effect sizes examined (according to Cohen’s statistical patterns). For the SES variable, the Levene’s test revealed variance homogeneity in all tests except in reading comprehension. For the normality test, only one of the socioeconomic groups had limitations (the group of families with academic qualifications demanding professions) in general in the various tests. Thus, the tests for all the independent variables with homogeneity and normality problems were taken into account as to their statistical limitation for covariate analysis.
Chapter 3. Understand variables and influence for L2 learners’ achievement
H1. It is expected that the resources of the four schools, perceived by teachers, determine the school's influence on the performance results, by test. The proficiency tests used, or not, by each school and respective teachers are included in the “resources” conceptual domain.
In order to answer this hypothesis, we first had to understand which schools, from the four selected, used proficiency tests, considering that these tests differ from our tests and are prescribed by the Ministry of Education. Knowing the numbers of the study sample (N=23) as to the proficiency for all schools, in order to respect homogeneity presuppositions, we used the nonparametric univariate test for Kruskal-Wallis independent samples and we found a significant difference, in that the four schools were not distributed equally (p. = 026) in the proficiency test. Then, the medians comparison analysis revealed that only two schools (schools 1 and 2) used the tests and with a significant difference between them (p. = .045) as regards the type of classified proficiency. Students from school 1 have greater proficiency (2.00) than students from school 2 (1.00). See Table 3.
Table 3
Achievement results in proficiency tests applied by the schools
Naturally, we expected better results test in school 1, and this was confirmed by the results in the sections below (H2, H3, H4) because school 2 is always in the lower position regarding results, in contrast to the school 1 (see Table 4 and correspondent Graphic). Achievement Results Median SD Z p Schools School 1 2.00 0.00 4.846 .045 School 2 1.00 7.87
Table 4
Achievement differences in tasks considering the four schools
N M SD
95% confidence intervall Lower
bound Upper bound
p
Recall Test School 1 8 4,75 1,982 3,09 6,41 ,807
School 2 5 3,40 1,673 1,32 5,48 School 3 13 4,46 2,634 2,87 6,05 School 4 12 4,00 3,303 1,90 6,10 Total 38 4,24 2,593 3,38 5,09 Picture naming School 1 9 33,4444 4,95255 29,6376 37,2513 ,128 School 2 6 22,3333 15,27962 6,2984 38,3683 School 3 14 32,2143 6,39926 28,5195 35,9091 School 4 13 29,0769 11,13898 22,3457 35,8081 Total 42 30,0952 9,78254 27,0468 33,1437 Semantic associations School 1 10 6,0000 3,01846 3,8407 8,1593 ,050 School 2 6 2,3333 3,38625 -1,2203 5,8870 School 3 14 7,3571 3,47756 5,3493 9,3650 School 4 13 5,3077 4,11065 2,8237 7,7917 Total 43 5,7209 3,80680 4,5494 6,8925 Morphological extraction School 1 10 4,2000 2,09762 2,6995 5,7005 ,019 School 2 6 1,5000 1,51658 -,0915 3,0915 School 3 14 5,0000 2,41788 3,6040 6,3960 School 4 11 3,0909 2,58668 1,3532 4,8287 Total 41 3,7805 2,51508 2,9866 4,5743 Vocabulary School 1 10 11,5000 3,20590 9,2066 13,7934 ,002 School 2 7 6,4286 3,90969 2,8127 10,0444 School 3 14 12,6429 2,84489 11,0003 14,2854 School 4 13 10,6923 3,52100 8,5646 12,8200 Total 44 10,8182 3,81108 9,6595 11,9769 Cognates School 1 10 3,0000 1,63299 1,8318 4,1682 ,035 School 2 7 1,7143 1,60357 ,2312 3,1973 School 3 14 3,9286 1,20667 3,2319 4,6253 School 4 12 3,0833 1,83196 1,9194 4,2473 Total 43 3,1163 1,67913 2,5995 3,6330
Both in terms of nationality and L1, school 1 students’ performance is always higher on the Picture Naming, Metaphor Decoding, Semantic Associations, Morphological Extraction, Cognates, Vocabulary, and Recall tests. As for the SES, there were no significant differences in all the tests conducted in the respective schools. Also, following analysis of the Kruskal-Wallis test to check whether there was the same distribution of socioeconomic groups in all schools, there were no differences between schools in this variable.
We used the t test for independent samples to ascertain which schools (that used the proficiency tests) have teachers with experience of classes with non-native students and which schools have teachers who carry out measures to support these students. The test revealed statistically significant differences (p = .006) between the two schools only regarding the use of measures because they do not differ regarding having multicultural classes, as expected, since the schools were selected according to the criteria that they all had classes with non-native students; but they differ regarding the measures (if any) enforced. School 1 has the higher number of teachers using support measures (specified below) in contrast to school 2.
As support measure we considered the following (put on a questionnaire administered to 77 teachers from the four schools): differentiated learning practices, explicit content practices, practices directed to students with lower proficiency (assessed