CAROTENOIDS BIOPRODUCTION BY
P
haffia
rhodozyma
Água de parboilização do arroz na maximização da bioprodução de carotenoides por Phaffia rhodozyma
Danielle Alves da Silva Rios1, Thais de Matos de Borba1, Susana Juliano Kalil1, Janaína Fernandes de Medeiros Burkert2
ABSTRACT
Theinterest in carotenoid production from natural sources has increased based in their possible use as dyes and their powerful biological antioxidant capacity. This study evaluated the use of rice parboiling wastewater (RPW) as an alternative substrate for the bioproduction of carotenoids using the yeast Phaffia rhodozyma and found it to be promising as the only source of nutrients,
reaching a concentration of 0.6 μg mL-1 (259.1 μg g-1) in 48 h. To increase the potential use of this industrial effluent, a study of
supplementation was carried out to enhance the production of carotenoids using the methodology of experimental design (a 2IV6-2
fractional factorial design sequenced by a 24 central composite design). The conditions for maximizing the production of carotenoids were (g L-1) malt extract (16.25), peptone (8.75), sucrose (15) and rice parboiling wastewater (87.5), with a pH of 5 at 25 °C and 150 rpm for 144 h, which produced a concentration 5.3 μg mL-1 (628.8 μg g-1).
Index terms: Biodye; submerged cultive; response surface methodology; yeast.
RESUMO
O interesse pela produção de carotenoides por fontes naturais é crescente, em decorrência da possibilidade de atuar como corante e sua capacidade antioxidante biológica potente.Neste estudo, avaliou-se o uso da água de parboilização do arroz, como substrato alternativo para a bioprodução de carotenoides, usando a levedura Phaffia rhodozyma que, como única fonte de nutrientes, foi
promissora, alcançando 0,6 µg mL-1 (259,1 µg g-1) em 48 h. Para aumentar o potencial de aproveitamento desse efluente industrial, um
estudo da suplementação do meio de produção foi realizado para incrementar a obtenção dos carotenoides, utilizando a metodologia do planejamento fatorial (um planejamento fatorial 2IV6-2 sequenciado por um planejamento fatorial completo 24). As condições maximizadas de produção de carotenoides foram (g L-1): extrato de malte, 16,25; peptona, 15 e água de parboilização de arroz, 87,5, com pH 5, a 25 ºC, 150 rpm por 144 h, alcançando 5,3 μg mL-1 (628,8 μg g-1).
Termos para indexação: Biocorantes; cultivo submerso; superfície de resposta; levedura.
1Universidade Federal do Rio Grande/FURG – Rio Grande – RS – Brasil
2Universidade Federal do Rio Grande/FURG – Cx. P. 474 – 96201-900 – Rio Grande – RS – Brasil – jfmb@vetorial.net Received in march 6, 2015 and approved in april 27, 2015
INTRODUCTION
Rice is one of the most important cereals in the world and is the main component of the Brazilian diet. Brazil is among the 10 largest producers of rice, and the process of parboiling is one of the most important
methods of preparation. This process involves a significant
use of water, on average up to 4 m3ton-1 of processed grain, which results in a considerable volume of effluent (Zepka et al., 2008). The main components of this effluent
are nitrogen and organic matter, which suggests the possibility of their use as an alternative nutrient source for the production of high value products (Queiroz et al., 2007). Among these, astaxanthin, an oxygenated carotenoid that has a typical orange-pink color, is widely distributed in nature, presenting biological functions that have attracted increasing interest. The largest source of
this carotenoid is the alga Haematococcus pluvialis, but it can also be produced by various yeasts, being the main carotenoid synthesized by the yeast Xanthophyllomyces
dendrorhous, popularly known as Phaffia rhodozyma
(Domínguez-Bocanegra; Ponce-Noyola; Torres-Muñoz, 2007; Rodriguez-Saiz; Fuente; Barredo, 2010).
Because of concern about the use of chemical additives in food, there is increasing interest in carotenoids obtained naturally by biotechnological processes (Valduga et al., 2011). The global market demand for carotenoids grows by 2.9% per year (Gu et al., 2008; Valduga et al., 2011) and is expected to reach almost 10 million tons by 2017 (Venil; Zakaria; Ahmad, 2013).
A significant increase in carotenoid production
as pH, temperature, aeration, and inoculum concentration,
and recovery of these compounds (Ni et al., 2007; Liu;
Wu, 2007; Gu et al., 2008; Ni et al., 2008; Valduga et al., 2011; Cabral et al., 2011; Michelon et al., 2012). In previous work conducted by our research group, the use of a culture medium containing rice parboiling wastewater
(15 g L-1) supplemented with other sources of nutrients for
the production of carotenoids from P. rhodozyma NRRL Y-17268 was investigated (Silva et al., 2012).
Within this context, the objective of this study was to use rice parboiling wastewater (RPW) as an alternative source of nutrients for P. rhodozyma to maximize the production of carotenoids, establishing the conditions of a medium culture.
MATERIAL AND METHODS
Partial characterization of culture medium components
The RPW was provided by a rice milling plant in the city of Pelotas, Brazil. It was centrifuged at 1870xg
for 10 min for particle removal. A partial RPW and yeast malt (YM) medium characterization was performed, and concentrations of carbon (C) and hydrogen (H) were determined using a CHNS/O analyzer (Perkin Elmer,
2400, Germany). For equipment calibration, the certified
reference material acetanilide was used to provide quality control for the determinations. Nitrogen (N) determination was carried out using the Kjeldahl method (AOAC, 2000). The concentration of non-reducing sugars was determined using the DNS method (Miller, 1959), and phosphorus and soluble solid contents were also analyzed (AOAC, 2000).
Microorganism
Theyeast P. rhodozyma NRRL Y-17268 was used for the production of carotenoids. It was provided by the
Northern Regional Research Laboratory (Peoria, IL, USA)
and is certified as GRAS (Generally Recognized as Safe).
Before the experiments, the yeast was suspended in YM
broth containing (g L-1) yeast extract (3), malt extract (3),
peptone (5) and glucose (10), incubated at 25 ºC for 48 h and then maintained in glycerol (10%) at -18 ºC (Silva et al., 2012).
Inoculum
The inoculum was prepared by adding 10 mL of culture in glycerol to 500 mL Erlenmeyer flasks containing 153 mL of culture medium (YM) supplemented with 0.2 g L-1 KNO
3 previously sterilized in an autoclave at
121 °C for 15 min. The suspension was maintained for 48 h
at 25 °C in a rotary incubator at 150 rpm, and growth was monitored by counting in a Neubauer chamber (Michelon et al., 2012).
Shaken flask cultivation
P. rhodozyma NRRL Y-17268 was cultivated in
500 mL Erlenmeyer flasks (153 mL culture medium)
that were sterilized in an autoclave at 121 °C for 15 min.
Each flask was inoculated with a 10% solution of the
yeast suspension previously prepared to achieve 1x10⁷ cells mL-1 at the beginning of cultivation.The flasks
were maintained in an incubator at 25 °C and 150 rpm for 168 h. Culture samples were collected to determine the pH, biomass concentration and the specific and volumetric production of carotenoids every 24 h.
Experimental design and statistical analysis
The initial cultivations were performed in triplicate (n = 3) to evaluate RPW as the sole source of nutrients in the production of carotenoids. Sequential concentrations of the culture medium were established
according to two factorial designs. In the first 2IV 6-2
fractional factorial design (Table 1), the effects of the concentrations of six variables in carotenoid production
were studied. A culture medium containing (g L-1) malt
extract (5), peptone (5), sucrose (10) and RPW (90) with an initial pH of 5 was used to evaluate the concentration
of yeast extract (0.0, 0.5 and 1.0 g L-1). The results
were evaluated by analysis of variance (ANOVA) and Tukey’s test (p < 0.05). A central composite design (CCD 24) with three replicates (n = 3) at the central
point was used to study the four variables selected from the fractional design. The responses evaluated
were maximum biomass concentration and the specific
and volumetric production of carotenoids in each trial. The results were evaluated using Statistica 5.0 software
(Statsoft, Inc., Tulsa, OK, USA).
pH determination
T h e p H o f t h e c u l t u r e s w a s m e a s u r e d potentiometrically by a pH meter (Marte, MB-10, Brazil) (AOAC, 2000).
Biomass concentration
Extraction and determination of total carotenoids
The extraction of total carotenoids was carried out by using 0.05 g of dry cells (35 °C for 48 h) and,
after freezing (-18 °C for 48 h), adding 2 mL of dimethyl
sulfoxide for cell disruption according to Fonseca et al. (2011). After cell disruption, the carotenoids were
extracted by adding 10 mL of acetone. Then, the samples
were centrifuged (Centribio 80-2B, Brazil) at 1870xg for 10 min. The supernatant was separated, and successive extractions were carried out until both the solvent and
cells were colorless. Next, 10 mL of 20% (w/v) NaCl solution and 10 mL of petroleum ether were added.
After agitation and phase separation, the excess water was removed with anhydrous sodium sulfate (Na2SO4). The total carotenoids in the extracts were measured by a spectrophotometer (BIOSPECTRO SP-220) at 474 nm
and quantified (Equation 1) using the specific absorptivity
coefficient of 1600 for xanthophylls
(Domínguez-where S.P.C. is the specific production of carotenoids (µg g-1); A is the absorbance; V is the volume (mL) of acetone (filtrate); and W is the dry cell mass (g).
The carotenoid volumetric concentration (VPC, µg
mL-1) was determined by converting the results of the SPC
(µg g-1) and the biomass concentration (g L-1).
RESULTS AND DISCUSSION
Partial characterization of substrates of culture media
The partial characterization of the substrates of the culture media is described in Table 2, where the total nitrogen and phosphorus concentrations of the rice parboiling wastewater comply with the literature on this agro-industrial residue (Queiroz et al., 2007; Silva et al., 2012). Therefore, the quantities of nitrogen and phosphorus of the RPW turn these materials into potential sources for such nutrients in the culture medium.
Cultivation with rice parboiling wastewater
According to Figure 1, there was a promising production of carotenoids by P. rhodozyma using only RPW as a source of nutrients. In RPW, the yeast synthesized carotenoids in the cells, reaching a maximum specific carotenoids production of 259.1 µg g-1 and a volumetric carotenoids production of 0.6 µg mL-1 in 48 h. The variation in the production
of specific carotenoids most likely occurs due to the simultaneous synthesis of other carotenoids that
interferes in the evaluation of the specific wavelength
necessary for the measurement of a particular carotenoid (An; Cho; Johnson, 1999).
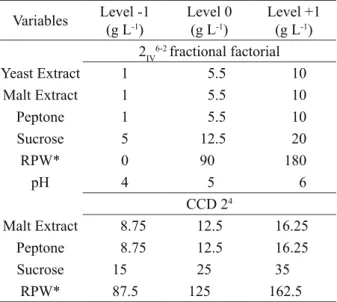
Table 1: Levels and concentrations of the variables studied
at the factorial designs.
Variables Level -1(g L-1)
Level 0 (g L-1)
Level +1 (g L-1)
2IV6-2 fractional factorial
Yeast Extract 1 5.5 10
Malt Extract 1 5.5 10
Peptone 1 5.5 10
Sucrose 5 12.5 20
RPW* 0 90 180
pH 4 5 6
CCD 24
Malt Extract 8.75 12.5 16.25
Peptone 8.75 12.5 16.25
Sucrose 15 25 35
RPW* 87.5 125 162.5
*RPW (rice parboiling wastewater).
(1)
6
. . (10 ) / (100 1600 )
S P C AV x W
Table 2: Partial characterization of substrates of culture media.
Substrates Carbon (%) Hydrogen (%) Nitrogen (%) Total sugars(mg L-1)
Total soluble
solids (g L-1)
Phosphorus
(mg L-1)
Yeast extract 38.40 5.65 10.67 ND ND ND
Malt extract 39.24 6.54 10.93 ND ND ND
Peptone 43.47 6.71 14.47 ND ND ND
RPW* 0.16 2.25 3.02 67.0 3.97 30.7
*RPW (rice parboiling wastewater); ND (not determined).
The maximum biomass concentration reached in
the RPW was 2.7 g L-1 in 48 h (Figure 1), lower than that
obtained by Silva et al. 2012 using the same yeast in a RPW culture medium supplemented with other sources of nutrients. This behavior is most likely associated with
the composition of the culture medium, specifically the
ratio of carbon to nitrogen (C:N), which was very low in the RPW medium (C:N = 0.05). According to Vustin, Belykh and Kishilova (2004), a C:N ratio less than 5 may
influence the synthesis of carotenoids by P. rhodozyma in a negative way, whereas higher ratios indicate a smaller concentration of nitrogen in the culture medium, which causes a large reduction in biomass growth and thereby in the volumetric production of carotenoids. The alga H.
pluvialis responded similar to the observations of this
work, with nitrogen limitation in the medium culture resulting in the reduction of primary metabolism (synthesis of protein and chlorophyll) and affecting the secondary metabolism and biosynthesis of astaxanthin (Ip; Chen, 2005). However, the C:N ratio alone cannot explain the growth and carotenoid production, as other nutrients such as vitamins, amino acids and minerals as well as the types
of carbon and nitrogen sources have a stronger influence
on the metabolism of yeasts (Vustin; Belykh; Kishilova, 2004; Dominguez-Bocanegra et al., 2007; Ni et al., 2008).
Therefore, to increase the biomass concentration and consequently the volumetric production of carotenoids, the next step of this work was to use rice parboiling wastewater supplemented with other nutrients such as yeast extract, malt extract, peptone and sucrose. For this purpose, experimental design was used to determine an association between these nutrients and the rice parboiling
wastewater to enable the joint maximization of the bioproduction of carotenoids and reduction in costs of the production medium.
Fractional factorial design
In the 2IV6-2 fractional factorial design (data
not shown), the biomass and the productions of total carotenoids were determined every 24 h for 168 h. The biomass concentration ranged from 1.8 (trial 1 in 24 h) to
8.1 g L-1 (trial 15 in 168 h), the volumetric production of carotenoids from 0.4 (trial 1 in 120 h) to 3.1 µg mL-1 (trial 15 in 168 h) and the specific production of carotenoids
from 240.3 (trial 1 in 24 h) to 538.4 µg g-1 (trial 6
in 144 h).
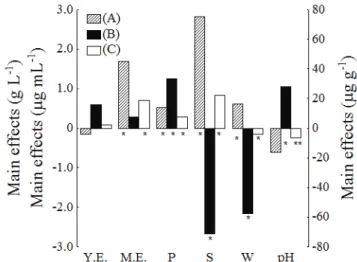
The estimates of the main effects were determined according to Rodrigues and Iemma, 2012. As shown in Figure 2, an increase in the concentration of yeast extract from level -1
(1 g L-1) to level +1 (10 g L-1) was not statistically significant
(p > 0.1) for any response. However, the concentrations of malt extract and peptone within the same concentration
range as the previous variable showed a significant effect (p < 0.1), increasing the concentration of biomass (1.7 g L-1 and 0.5 g L-1, respectively) and the volumetric production of carotenoids (0.7 μg mL-1 and 0.3 μg mL-1, respectively). The increased production of specific carotenoids was significant
(p < 0.1) only concentration of peptone with an increased
of 33.2 μg g-1.
Behavior similar to that observed in this work, with
no significant influence of the presence of yeast extract
together with other sources of nitrogen on the production of carotenoids, were observed with different strains of
Phaffia rhodozyma (Ni et al., 2007, Liu; Wu, 2007), the
presence of yeast extract together with other sources of
nitrogen have been screened out as non-significant factors
of both the cell growth rate and carotenoid biosynthesis of P. rhodozyma in shake-flask cultures.
An increase in the sucrose concentration
from 5 to 20 g L-1 showed the greatest influence
and most significant effect of all of the variables. This effect was positive for biomass and volumetric
production, increasing by 2.8 g L-1 and 0.8 μg mL-1,
respectively. However, the effect was negative for
specific production, decreasing by 71.4 μg g-1 (Figure 2).
High concentrations of carbon sources can inhibit the synthesis of carotenoids (Vustin; Belykh; Kishilova,
2004), as verified in this study and observed by Liu
and Wu (2007). A similar effect was observed upon
increasing the glucose concentration from 15 to 40 g L-1, which increased the biomass by 3.3 g L-1 and decreased the production of carotenoids by 917 μg g-1.
A significant increase of 0.6 g L-1 in biomass
concentration was observed when the RPW concentration
increased from 0 g L-1 (level -1) to 180 g L-1 (level +1).
Moreover, RPW is an excellent source of organic nitrogen (Queiroz et al., 2007) and may preferentially utilized by the yeast, replacing yeast extract. However, the opposite effect was found for the production of carotenoids, which
experienced decreases of 57.4 μg g-1 and 0.1 μg mL-1
(Figure 2).
The pH presented a positive effect on specific
production, increasing by 27.8 µg g-1, a negative effect on volumetric production, decreasing by 0.2 μg mL-1
(Figure 2), and no effect on biomass concentration.
Therefore, it was fixed at the central point (5). For other
strains of P. rhodozyma, pH 5 was appropriate for cell
growth and the production of carotenoids (Liu; Wu, 2007;
Ni et al., 2007), similar to the choice in this work. The results of the 2IV6-2 fractional factorial design show that the presence of yeast extract up to 1 g L-1 was not significant for the production of carotenoids. The use of yeast extract up to 1 g L-1 was studied separately (0, 0.5 and 1 g L-1) and, according to Table 3, also showed no significant difference in the production of
carotenoids. Therefore, the RPW medium for carotenoids production used in these experiments could be used as a source of nitrogen and other nutrients associated with other components of the medium. The absence of yeast extract reduces the costs of the production medium. Thus, the yeast extract was removed from the production environment for study in the CCD 24.
Central composite design (CCD)
The maximization of carotenoid production was carried out using a 24 CCD with four variables selected
from the fractional factorial design. The ranges of the concentrations of malt extract, peptone and sucrose (Table 1 and Table 4) were expanded due to the increase in all studied responses. The concentration range of the RPW was decreased according to the results for the volumetric production of carotenoids. The initial pH of
the culture medium was fixed at a central point (5.0), and
yeast extract was discarded.
Figure 2: Main effects of carotenoids production for the responses biomass concentration (g L-1) (A), specific
production (μg g-1) (B) and volumetric production of carotenoids (μg mL-1) (C). Y.E.: yeast extract, M.E.: malt
Table 3: ANOVA and Tukey’s test for the different yeast extract concentrations (n = 3).
YE (g/L) Y1 (g L-1) Y 2 (μg g
-1) Y
3(μg mL -1)
0 9.3 ± 0.1a 359.5 ± 23.1a 3.0 ± 0.1a
0.5 8.2 ± 0.3b 385.9 ± 5.6a 3.0 ± 0.1a
1 8.8 ± 0.2ab 345.4 ± 31.4a 2.8 ± 0.2a
Means with different superscript letters within the same column are significantly different (p < 0.05). YE [yeast extract (g L-1)];
Y1 [biomass (g L-1)]; Y
2 [specific carotenoids (μg g -1)]; Y
3
[volumetric carotenoids (μg mL-1)].
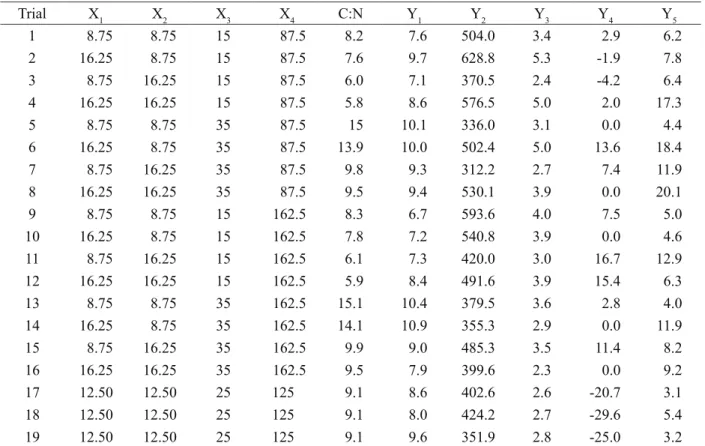
Table 4: 24 Central Composite Design with real values of the variables (X
n), C:N ratio and the maximum responses
(Yn) of biomass concentration, specific production of carotenoids, volumetric production of carotenoids and relative desviation (%) and residual sucrose (%).
Trial X1 X2 X3 X4 C:N Y1 Y2 Y3 Y4 Y5
1 8.75 8.75 15 87.5 8.2 7.6 504.0 3.4 2.9 6.2
2 16.25 8.75 15 87.5 7.6 9.7 628.8 5.3 -1.9 7.8
3 8.75 16.25 15 87.5 6.0 7.1 370.5 2.4 -4.2 6.4
4 16.25 16.25 15 87.5 5.8 8.6 576.5 5.0 2.0 17.3
5 8.75 8.75 35 87.5 15 10.1 336.0 3.1 0.0 4.4
6 16.25 8.75 35 87.5 13.9 10.0 502.4 5.0 13.6 18.4
7 8.75 16.25 35 87.5 9.8 9.3 312.2 2.7 7.4 11.9
8 16.25 16.25 35 87.5 9.5 9.4 530.1 3.9 0.0 20.1
9 8.75 8.75 15 162.5 8.3 6.7 593.6 4.0 7.5 5.0
10 16.25 8.75 15 162.5 7.8 7.2 540.8 3.9 0.0 4.6
11 8.75 16.25 15 162.5 6.1 7.3 420.0 3.0 16.7 12.9
12 16.25 16.25 15 162.5 5.9 8.4 491.6 3.9 15.4 6.3
13 8.75 8.75 35 162.5 15.1 10.4 379.5 3.6 2.8 4.0
14 16.25 8.75 35 162.5 14.1 10.9 355.3 2.9 0.0 11.9
15 8.75 16.25 35 162.5 9.9 9.0 485.3 3.5 11.4 8.2
16 16.25 16.25 35 162.5 9.5 7.9 399.6 2.3 0.0 9.2
17 12.50 12.50 25 125 9.1 8.6 402.6 2.6 -20.7 3.1
18 12.50 12.50 25 125 9.1 8.0 424.2 2.7 -29.6 5.4
19 12.50 12.50 25 125 9.1 9.6 351.9 2.8 -25.0 3.2
X1 [malt extract (g L-1)]; X
2 [peptone (g L -1)]; X
3 [sucrose (g/L)]; X4 [RPW (g L -1)]; Y
1 [biomass (g L -1)]; Y
2 [specific carotenoids
(μg g-1)]; Y
3 [volumetric carotenoids (μg mL -1)]; Y
4 [Relative desviation (%)]; Y5 [Residual Sucrose (%)].
The C:N ratio varied from 5.8 (trial 4) to 15.1 (trial 13), promoting the production of carotenoids in all compositions
of the culture medium (trial 1 to 19). The specific production ranged from 312.2 μg g-1 (trial 7 in 72 h) to 628.8 μg g-1
(trial 2 in 144 h), and the volumetric production ranged
from 2.3 μg mL-1 (trial 16 in 144 h) to 5.3 μg mL-1 (trial 2 in
144 h), with an increase occurring in all responses relative to the 2IV6-2 fractional factorial design. The residual sucrose
varied from 3.1% (trial 17) to 20.1% (trial 8).
ANOVA (data not shown) for the volumetric production of carotenoids showed that the pure error was very low (0.02), indicating a good reproducibility of the experimental data. The Fisher F-test is a ratio of the means square from regression of the means square from the real error (Rodrigues; Iemma, 2012). It shows that the model is predictive, as the calculated F-value (10) was three times higher than the tabulated F-value (F0.95; 6; 12=3.0) at the 5%
level, and that the regression coefficient (0.82) is good
enough (Haaland, 1989). Therefore, the model (Equation 2) Table 4 show the results obtained in the 24 CCD
for the maximum responses (biomass concentration and
specific and volumetric concentrations of carotenoids),
the residual sucrose and the relative deviations from the predicted model (Equation 2). The biomass ranged from
to represent the relationship between the responses and
the significant variables was used to generate the response
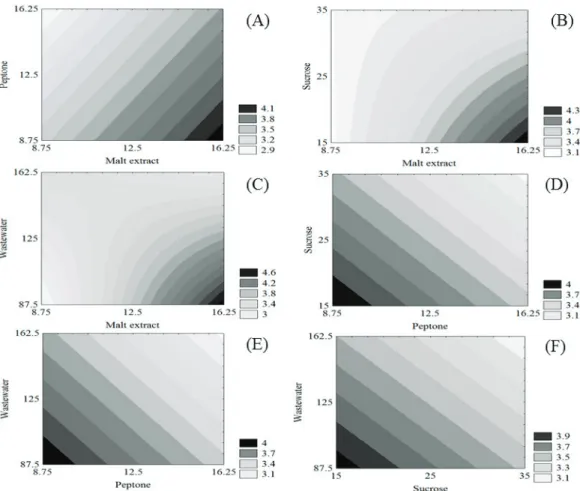
surfaces (Figure 3). The relative deviations between the experimental and predicted results based on the model were less than 15% in most trials (Table 3), showing that Equation 2 predicts the behavior of volumetric production.
sucrose concentration low (Figure 3B) or when the RPW concentration was low and the malt extract concentration high, the volumetric production of carotenoids was above
4.3 μg mL-1 (Figure 3C). Figures 3D, 3E and 3F show that
the volumetric production of carotenoids was from
3.9-4.0 μg mL-1 when the concentrations of peptone and sucrose,
peptone and RPW, and sucrose and RPW, respectively, in the culture medium were low.
The surfaces indicate a high volumetric production of carotenoids by P. rhodozyma NRRL Y-17268 using
a culture medium containing 16.25 g L-1 malt extract, 8.75 g L-1 peptone, 15 g L-1 sucrose and 87.5 g L-1
rice parboiling wastewater (trial 2 in Table 4), with a
C:N ratio of 7.6. Under these conditions, the relative
deviation provided by the model was less than 5%. Figure 4 presents the kinetics of carotenoid production in
Volumetric carotenoids (µg mL-1) = 3.49 + 0.41X 1 -
0.28X2 - 0.24X3 - 0.23X4 - 0.24X1X3 - 0.54 X1X4 (2)
Figure 3 shows the effects of the concentrations of malt extract, peptone, sucrose and RPW on the volumetric production of carotenoids. When the peptone concentration was low and the malt extract concentration high, carotenoids production remained at approximately 3.8-4.1 μg mL-1 (Figure
3A). When the malt extract concentration was high and the
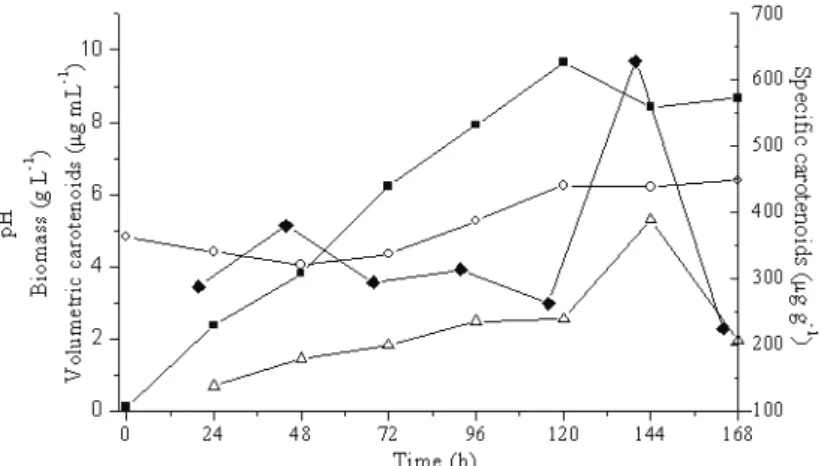
Figure 4: Bioproduction of carotenoids by P. rhodozyma NRRL Y-17268 using culture medium with 16.25 g L-1 malt
extract, 8.75 g L-1 peptone, 15 g L-1 sucrose and 87.5 g L-1 rice parboiling wastewater (trial 2 in Table 3) at 25 ºC and
150 rpm. ■ biomass, ○ pH, ∆ volumetric carotenoids, ♦ specific carotenoids.
this condition. The volumetric and specific carotenoid production increased up to 144 h, reaching 5.3 μg mL-1
and 628.8 μg g-1, respectively. The biomass concentration reached a maximum of 9.7 g L-1 after 120 h, as carotenoid
synthesis is partially associated with cell growth and the production occurs even after the cell death phase of the
microorganism (Vustin; Belykh; Kishilova, 2004, Liu;
Wu, 2007). The pH shows the characteristic behavior of this yeast (Vustin; Belykh; Kishilova, 2004), with an initial fall up to 48 h (5-4) followed by an increase and a constant period.
It was not possible to establish a significant
predictive model for specific carotenoids production and
biomass concentration. The volumetric production of carotenoids was maximized by the CCD study including RPW in the culture medium as a substrate, adding
value to the agroindustrial effluent. The volumetric
production of carotenoids increased by approximately
75%, reaching 5.3 μg mL-1 in 144 h (trial 2 in Table 3),
in relation to the highest value obtained in the fractional
factorial design, 3.1 µg mL-1 in 168 h (trial 15), using the
experimental design methodology and with a reduced process time.
In the present study, the specific production of
carotenoids (628.8 μg g-1) and the volumetric production of carotenoids (5.3 μg mL-1) were higher than those found
in the literature for different culture mediums and various strains of P. rhodozyma. The carotenoids production by P.
rhodozyma 67-385 was reported to be 310 μg g-1 (An; Cho;
Johnson, 1999). P. rhodozyma NRRL Y-10921 and NRRL Y-10922 reached 1.6 µg mL-1 and 3.0 μg mL-1, respectively
(Vázquez; Santos; Parajó, 1997), and P. rhodozyma AS 2.1557 achieved 3.5 μg mL-1 (Wang; Yu; Zhou, 2006). Using the same microorganism as in this work, Vázquez,
Santos and Parajó (1997) reached 3.6 μg mL-1, and Silva et al. (2012) obtained 1.7 µg mL-1.
CONCLUSIONS
The use of rice parboiling wastewater as an alternative substrate for the production of carotenoids by
P. rhodozyma NRRL Y-17268 was observed in this work.
The conditions of the medium culture established for the maximization of the volumetric production of carotenoids
were 16.25 g L-1 malt extract, 8.75 g L-1 peptone, 15 g L-1 sucrose, 87.5 g L-1 rice parboiling wastewater, initial
pH of 5, 25 ºC, and 150 rpm during 144 h of culture.
Under these conditions, the utilization of rice parboiling
wastewater to replace the yeast extract added value to the
agroindustrial effluent, reaching 5.3 μg mL-1 (628.8 µg g-1)
of carotenoids in 144 h.
ACKNOWLEDGEMENTS
The authors thank the research funding agencies Fapergs, Capes and CNPq, for the financial support received for this work.
REFERENCES
AN, G.; CHO, M.; JOHNSON, E. A. Monocyclic carotenoid biosynthetic pathway in the yeast Phaffia
rhodozyma (Xanthophyllomyces dendrorhous). Journal
AOAC- Association of official analytical communities. Official Methods of Analysis. 17 ed. Arlington: AOAC International, 2000.
CABRAL, M. M. S. et al. Carotenoids production from
a newly isolated Sporidiobolus pararoseus strain by submerged fermentation. European Food Research and Technology. 233:159-166, 2011.
DOMÍNGUEZ-BOCANEGRA, A. R; PONCE-NOYOLA, T.; TORRES-MUÑOZ, J. A. Astaxanthin
production by Phaffia rhodozyma and Haematococcus
pluvialis: a comparative study. Applied Microbiology
and Biotechnology. 75:783-791, 2007.
FONSECA, R. A. S. et al. Different cell disruption methods for astaxanthin recovery by Phaffia rhodozyma.
AfricanJournal ofBiotechnology. 10(7):1165-1171, 2011.
GU, Z. et al. Optimization of carotenoids extraction
from Rhodotobacter sphaeroides. LWT - Food Science and Technology. 41:1082-1088, 2008.
HAALAND P.D. (Ed.), Experimental Design in Biotechnology. Marcel Dekker Inc., New York, 1989.
IP, P.; CHEN, F. Production of astaxanthin by the green microalga Chlorella zofingiensis in the dark. Process Biochemistry. 40:733-738, 2005.
KUSDIYANTINI, E. et al. Growth kinetics and
astaxanthin production of Phaffia rhodozyma on glycerol as a carbon source during batch fermentation.
Biotechnology Letters. 20(10):929-934, 1998.
LIU, Y. S.; WU, J. Y. Optimization of cell growth
and carotenoid production of Xanthophyllomyces
dendrorhous trough statistical experiment design.
Biochemical Engineering Journal. 36(2):182-189, 2007.
MICHELON, M. et al. Extraction of carotenoids from
Phaffia rhodozyma: a comparison between different
techniques of cell disruption. Food Science and Biotechnology. 21(1):1-8, 2012.
MILLER, G. L. Use of dinitrosaIicyIic acid reagent for
determination of reducing sugar. Analytical Chemistry. 31:426-428, 1959.
NI, H. et al. Optimization of acidic extraction of astaxanthin from Phaffia rhodozyma.Journal of Zhejiang University - Science B, 9(1):51-59, 2008.
___________. Studies on optimization of nitrogen sources for astaxanthin production by Phaffia
rhodozyma. Journal of Zhejiang University - Science
B. 8(5):365-370, 2007.
QUEIROZ, M. I. et al. The kinetics of the removal of nitrogen and organic matter from parboiled rice effluent
by cyanobacteria in a stirred batch reactor. Bioresource Technology, 98(11):2163-2169, 2007.
RODRÍGUEZ-SÁIZ, M.; FUENTE, J. L.; BARREDO, J. L. Xanthophyllomyces dendrorhous for the industrial production of astaxanthin. Applied Microbiology and Biotechnology. 88(3):645-658, 2010.
RODRIGUES, M. I.; IEMMA, A. F. Experimental design and process optimization. Casa de Espírito Amigo Fraternidade Fé e Amor. 2nd. Campinas, São Paulo, 2012. 352 p.
SILVA, C. M. et al. Carotenoid production by Phaffia
rhodozyma using raw glycerol as an additional carbon
source. International Journal of Food Engineering. 8(4):1-15, 2012.
VALDUGA, E. et al. Evaluation of aeration and
substrate concentration on the production of carotenoids
by Sporidiobolus salmonicolor (CBS 2636) in
bioreactor. European Food Research and Technology. 232:453-462,2011.
VÁZQUEZ, M.; SANTOS, V.; PARAJÓ, J. C. Effect of the carbon source on the carotenoid profiles of Phaffia
rhodozyma strains. Journal of Industrial Microbiology
& Biotechnology. 19:263-268, 1997.
VENIL, C.K.; ZAKARIA, Z.A.; AHMAD, W.A.
Review: bacterial pigments and their applications.
Process Biochemistry. 48:1065-1079, 2013.
VUSTIN, M. M.; BELYKH, E. N.; KISHILOVA,
S. A. Relationship between astaxanthin production and intensity of anabolic processes in the yeast
Phaffia rhodozyma. Microbiology. 73(6):751-757,
WANG, W.; YU, L.; ZHOU, P. Effects of different
fungal elicitors on growth, total carotenoids and astaxanthin formation by Xanthophyllomyces
dendrorhous. Bioresource Technology. 97(1):26-31,
2006.
ZEPKA, L. Q. et al. Production and biochemical profile