Vol.50, n. 2 : pp.349-359, March 2007
ISSN 1516-8913 Printed in Brazil BRAZILIAN ARCHIVES OF
BIOLOGY AND TECHNOLOGY
A N I N T E R N A T I O N A L J O U R N A L
A Comparison between Enzyme Immunoassay and HPLC
for Ochratoxin A Detection in Green, Roasted and Instant
Coffee
Simone Fujii1, Elisabete Yurie Sataque Ono2, Ricardo Marcelo Reche Ribeiro1, Fernanda Garcia Algarte Assunção1, Cássia Reika Takabayashi1, Tereza Cristina Rocha Moreira de Oliveira1, Eiko Nakagawa Itano3, Yoshio Ueno4, Osamu Kawamura5 and Elisa Yoko Hirooka1*
1Departamento de Tecnologia de Alimentos e Medicamentos; 2 Departamento de Bioquímica; 3Departamento de
Ciências Patológicas; Universidade Estadual de Londrina; hirooka@uel.br, C. P. 6001; 86051990; Londrina - PR - Brasil. 4Faculty of Pharmaceutical Science; Science University of Tokyo; Shinjukuku Tokyo - 162-0812 Japan. 5Department of Biochemistry and Food Science; Faculty of Agriculture; Kagawa University; Ikenobe; Miki-cho;
Kita-gun; Kagawa 761-0765 - Japan
ABSTRACT
An indirect competitive enzyme-linked immunosorbent assay (ic-ELISA) for ochratoxin A (OTA) detection in green, roasted and instant coffees was developed using anti-OTA monoclonal antibody. Immunological reagents prepared were OTA-BSA (4.76 µg/mL), anti-OTA.7 MAb (2x10³-fold dilution) and HRP-anti IgG (103-fold dilution). The detection limit was 3.73 ng OTA/g and correlation coefficients (r) between this immunoassay and high performance liquid chromatography were 0.98 for green coffee, 0.98 for roasted and 0.86 for instant. OTA levels detected by ic-ELISA were higher than by HPLC, with ic-ELISA/HPLC ratio of 0.66 - 1.46 (green coffee), 0.96 - 1.11 (roasted) and 0.93 - 1.82 (instant). ELISA recoveries for OTA added to coffee (5 - 70 ng/g)were 81.53 % for green coffee, 46.73 % for roasted and 64.35 % for instant, while recoveries by HPLC were 80.54 %, 45.91 % and 55.15 %, respectively. Matrices interferences were minimized by samples dilution before carrying out the ELISA assay. The results indicate that MAb-based ic-ELISA could be a simple, sensitive and specific screening tool for OTA detection, contributing to quality and safety of coffee products.
Key words: Ochratoxin, immunoassay, HPLC, monoclonal antibody, coffee
* Author for correspondence
INTRODUCTION
The occurrence of ochratoxin A in agricultural staples has been a topic of concern in food assurance due to human and animal health hazard (Petzinger and Weidenbach, 2002). The toxicological properties of OTA, a secondary metabolite produced by Aspergillus and
Penicillium species, include nephrotoxicity,
Blesa et al., 2004; Saez et al., 2004). The maximum limit of OTA has been set in several countries with values ranging from 0.5 to 5 µg/kg for baby food, 5 µg/kg for cereals, 3 µg/kg for cereals products and 5 a 300 µg/kg for animal feed (Commission Regulation, 2002; Berg, 2003; Fonseca, 2005). In Brazil, a specific guideline for OTA has not been established even for food or feed (Prado et al., 2000; Fonseca, 2005).
Regarding the fact that contamination of commodities by ochratoxin A is unavoidable, the effectiveness of its control depends on a rigorous monitoring program. Sensitive and accurate analytical methodologies are essential to minimize the exposure, where the conventional techniques for OTA detection include thin layer chromatography (TLC) (Pittet and Royer, 2002), high performance liquid chromatography (HPLC) (Sibanda et al., 2002; Blesa et al., 2004), liquid chromatography/mass spectrometry (LC/MS) (Lindenmeier et al., 2004) and fluorometry (Chiavaro et al., 2002). HPLC is the most commonly used method for ochratoxin determination (Blesa et al., 2004; Dall’Asta et al., 2004), but it requires extensive clean-up of sample extract, a trained staff, and it is time-consuming in addition to its high cost and use of harmful solvents (Sydenham and Shephard, 1996)
Immunoassays provide an attractive and promising alternative for ochratoxin detection in food due to high specificity, sensitivity, simplicity, potential for automation and possibility of use under field conditions (Chu, 1984; Hefle, 1995). Development of polyclonal (PAb) and monoclonal antibody (MAb) against OTA-protein conjugate allowed immunoassay to become a basic and useful tool for OTA screening (Kawamura et al., 1989; Thirumala-Devi et al., 2000). Kawamura et al. (1989) developed a highly sensitive enzyme linked immunosorbent assay (ELISA) for OTA based on MAb antibodies with detection limit of 50 pg/mL, and low cross-reactivity with analogues and other mycotoxins.
In the present work, an indirect competitive ELISA (ic-ELISA) based on anti-OTA MAb for OTA detection in green, roasted and instant coffees was developed. Its performance was evaluated and compared with HPLC as well as the behavior of matrices components as interferents.
MATERIALS AND METHODS
Reagents and Materials
Anti-OTA.7 MAb (cross-reactivity of 79.4 % for OTC) was prepared at Science University of Tokyo, Japan (Kawamura et al., 1989). OTA standard, ovalbumin (OVA), bovine serum albumin (BSA), horseradish peroxidase (HRP) labeled goat anti-mouse IgG (HRP-anti-IgG), 1-ethyl-3-(3-diethylaminopropyl)-carbodiimide (EDPC) were purchased from Sigma Chemical Co. (St Louis, MO, USA). 3,3',5,5'-tetramethylbenzidine (TMB) was from Dojindo (Japan). Hydrogen peroxide (30 %) was acquired from Merck KGaA (Darmstadt, Germany) and dimethyl sulfoxide was from Trade TCI (Japan). Microtitre plates (96-wells) were from Corning (USA). Glass microfiber filters (GF/C 2.5 cm i.d) were purchased from Whatman International Ltd. (Maistone, England). Immunoaffinity columns for OTA (OchratestTM) were from Vicam Inc. (Watertown, USA). Acetonitrile and acetic acid were HPLC grade (Mallinckrodt Baker, Inc., Phillipsburg, USA). All other chemicals were reagent grade.
Samples
ELISA for OTA analysis was developed using coffee grain at cherry stage of maturation (green coffee) harvested at the university experimental farm. Roasted and instant coffees were commercially acquired and also used for testing the ELISA method. The samples were dried at 50 oC with circulating air to reach 12 % moisture
level.
Preparation of crude extracts (OTA extraction)
methanol-1 % sodium bicarbonate (70:30, v/v) for green coffee and 1 % sodium bicarbonate for roasted and instant coffees. For the HPLC determination, the extracts were then cleaned up by immunoaffinity column. For the ic-ELISA assay the residue was diluted in methanol-phosphate buffered saline (PBS) (1:9, v/v) and directly analyzed without a clean up step.
OTA recovery
Green coffee (non-roasted) and derived products, which were OTA negative by HPLC (< 0.80 ng/g), were spiked with OTA (5.0, 10.0, 25.0, 50.0 and 70.0 ng/g) dissolved in methanol. The samples were extracted after standing for 16 h at 25 ºC. OTA quantitation and recovery tests were carried out by HPLC and ic-ELISA.
Ochratoxin analysis by HPLC
OTA was analyzed essentially according to Pittet et al. (1996). The green coffee residue was dissolved in methanol-1 % sodium bicarbonate (70:30, v/v) and diluted in PBS-0.01 % Tween 20 (PBST, Sigma Chemical Co., USA) (1:4, v/v). For roasted and instant coffees, the residue was dissolved in 1 % sodium bicarbonate solution and diluted in PBST (1:1, v/v). The crude extracts were filtered (glass microfiber filters GF/C 2.5 cm) and 10 mL were applied to an immunoaffinity column (Ochratest, Vicam Inc., USA). After washing the column with PBST (10 mL) followed by ultra-pure water (Milli Q, Millipore Corporation, USA) (10 mL), the ochratoxins were eluted with 1.5 mL of methanol. The eluate was evaporated to dryness under stream of nitrogen at 40 ºC, and the residue was dissolved in acetonitrile-water (1:1, v/v, 1 mL). OTA was analyzed by a reversed-phase, isocratic HPLC system (LC-10 AD pump, RF 535 fluorescence detector, Shimadzu, Japan) using a Nucleosil 100 C18 column 4 x 250 mm (Merck, Germany). Excitation and emission wavelengths were 335 and 475 nm, respectively. The eluent was acetonitrile-water-acetic acid (99:99:2, v/v/v) pH 3.0. The flow rate was 0.80 mL/min. The detection limit for OTA was 0.80 ng/g and OTA concentration was determined using a calibration curve ranging of 10 to 100 ng/mL.
Ochratoxin analysis by ELISA
Standardization of ic-ELISA
Immunological reagents were previously developed and standardized for ic-ELISA. OTA-BSA conjugate (4.76 mg/mL) was prepared by coupling OTA to BSA with water-soluble carbodiimide (EDPC) as described by Kawamura et al. (1989). The protein concentration was determined by Bradford method (Bradford, 1976). The cross-reactivity of provided anti-OTA.7 MAb with OTA analogues was previously determined (Kawamura et al., 1989). Concentration of OTA-BSA (4.76 µg/mL and 2.38 µg/mL), anti-OTA MAb (1000 and 2000-fold dilution) and HRP-anti-IgG (1000 to 3000-fold dilution) were checked by indirect ELISA for standardization purposes (50 % maximal binding, absorbance of 0.7 - 0.9) (Kawamura et al., 1989). The enzyme substrate solution (0.1 mg/mL TMB, 0.005 % H2O2) was prepared immediately before assay, adding 100 µL TMB (10 mg/mL of dimethyl sulfoxide) and 100 µL H2O2 (0.5 % in water, v/v) in 10 mL 0.1 M sodium acetate buffer pH 5.0.
Ic-ELISA procedure
ng OTA/mL), plotting percent binding against OTA concentration.
Interference of green, roasted and instant coffee matrices in ic-ELISA
Matrix interference in ic-ELISA was evaluated using OTA negative coffee (green, roasted and instant) previously analyzed by HPLC (< 0.80 ng/g). The samples were extracted as above, diluted 10 to 2000-fold with methanol-PBST (1:9, v/v) and analyzed by ic-ELISA.
Correlation analysis of ic-ELISA against HPLC
Ochratoxin concentrations in artificially contaminated coffee (green, roasted and instant) detected by ic-ELISA were compared to HPLC analysis using a correlation test (Descriptive Statistic, Statistic software 5.0, StatSoft Inc., USA), to obtain linear regression equation and correlation coefficient.
RESULTS AND DISCUSSION
The ELISA assay for OTA detection in green coffee and derived products were performed using anti-OTA.7 MAb, OTA-BSA conjugate as coating antigen and enzyme-labeled anti-IgG reagent. Monoclonal antibody (anti-OTA.7 MAb) used in this immunoassay exhibited high specificity with low cross-reactivity, unlimited supply using producer hybridoma, low backgroundand constant affinity for a single epitope (Kawamura et al., 1989). Such profiles overcome the polyclonal sera which are a complex mixture of antibodies of different affinities, with fair signal strength, specificity and high background (Harlow and Lane, 1988; Gazzaz et al., 1992; Hefle, 1995).
The cross-reactivity of anti-OTA.7 MAb used in this study with OTA analogues was previously evaluated (Kawamura et al., 1989) regarding the false positive reaction in ELISA caused by chemically related compounds such as OTA precursors, other fungal metabolites, and compounds found in food and feed matrices (Sydenham et al., 1996). Analogue levels which caused 50 % inhibition of binding were calculated from MAb inhibition curve by ic-ELISA. The OTA.7-MAb cross-reacted with ochratoxin C (79.4 %), but (4 R)-4-hydroxy-ochratoxin A
(1.24 %), ochratoxin B (0.07 %) and ochratoxin α (0.06 %) showed low reactivity. Nevertheless, OTC was uncommon in natural contamination suggesting its minor contribution in assay using this anti-OTA.7 MAb. It should be noted that OTC toxicity is much less than OTA (Kawamura et al., 1989).
The OTA-protein conjugate (OTA-BSA) was synthesized using the bifunctional reagent EDPC, which linked OTA via its reactive carboxyl group, and BSA carrier protein via its free amine group, performing an amide bound. The protein concentration of OTA-BSA conjugate was 4.76 mg/mL (data not shown). This reaction was simple, efficient and controllable and produced stable conjugate suitable in performing ic-ELISA (Chu, 1984; Harlow and Lane, 1988; Kawamura et al., 1989; Xiao et al., 1995).
Bovine serum albumin (BSA) was chosen as carrier protein due to its higher stability and OTA-protein molar ratio (16.7:1), when compared with ovalbumin (OVA) (0.3 - 0.5:1), in addition to its lower cost and higher solubility than keyhole limpet hemocyanin (KLH) (Kawamura et al., 1989; Harlow and Lane, 1988).
The levels of immunological reagents adequate for OTA analysis were standardized by i-ELISA (Table 1). The factors affecting sensibility were the amount of antigen bound to solid phase, antigen-antibody avidity, and type/number of labeled moieties used to label the antibody (Harlow and Lane, 1988; Hefle, 1995).
Table 1 – Immunoassay standardization for OTA analysis: concentrations of OTA-BSA conjugate *, anti-OTA
MAb and HRP-labeled anti-IgG tested by i-ELISA.
Dilutions (fold) Experiment
OTA-BSA* anti-OTA-MAb Anti-IgG-HRP
i-ELISA (A450nm) a
1a 1000 1000 1000 0.913
1b 1000 1000 1500 0.727
1c 1000 1000 2000 0.676
1
1d 1000 1000 3000 0.581
2a 1000 2000 1000 0.903
2b 1000 2000 1500 0.692
2c 1000 2000 2000 0.555
2
2d 1000 2000 3000 0.500
3a 2000 1000 1000 0.453
3b 2000 1000 1500 0.318
3c 2000 1000 2000 0.322
3
3d 2000 1000 3000 0.338
4a 2000 2000 1000 0.431
4b 2000 2000 1500 0.433
4c 2000 2000 2000 0.374
4
4d 2000 2000 3000 0.314
* protein concentration of 4.76 mg/mL (Bradford, 1976).
amean of values in triplicate.
The enzyme-labeled anti-immunoglobulin antibody was chosen as secondary reagent for its commercial availability and with the large range of antigens it could be used. Furthermore, it did not modify the primary antibody avoiding loss of activity. In the assay, horseradish peroxidase-labeled anti-IgG antibody was detected using tetramethylbenzidine (TMB) as chromogenic substrate (Harlow and Lane, 1988; Hefle, 1995). The competitive ELISA calibration curve for OTA (0.2 - 10.0 ng/mL) was prepared, and a nonlinear regression was adopted to maximize the assay range and to maintain a high degree of sensitivity (Fig. 1). The calibration curves were highly reproducible, as indicated by low standard deviations (SDs) (Fig. 1).
The detection limit of ic-ELISA for OTA was 0.20 ng OTA/mL and equivalent to 3.73 ng OTA/g sample, minimum concentration over 9.3 % inhibition (Fig. 1). This value corresponded to mean absorbance plus three times the SD of the measurements of three replicate wells of 0 ng OTA/mL (Ono et al., 2000). The sensibility of ic-ELISA was adequate for detecting OTA in coffee samples.
The accuracy and precision of ELISA were determined using OTA standards at 0.2 - 10.0 ng/mL range, where the assays were evaluated
repeatedly in different sets of wells of the same plate (intra-assay), or different plates in different days (inter-assay). Reproducibility and reliability of the ELISA assay were demonstrated by the low coefficient variations (CVs) (Table 2) of 1.78 - 6.95 % and 4.78 - 16.67 % for intra- and inter-assay, respectively.
The green, roasted and instant coffee matrices interferences in ic-ELISA were tested using OTA negative samples (Fig. 2). Matrix effect could be minimized by diluting the sample extract prior to carry out ELISA assay.
0 20 40 60 80 100
0 1 2 3 4 5 6 7 8 9 10
OTA conc. (ng/mL)
B
in
d
in
g
%
Figure 1 – Calibration curve of ic-ELISA for OTA. Circles represent the mean binding from
seven calibration curves obtained on different days over a 1-month period. Bars represent standard deviations. The detection limit was 0.20 ng OTA/mL, which was the minimum concentration over 9.3 % inhibition (three times the SD of 0 ng OTA/mL) detected by ic-ELISA.
Table 2 – Intra- and interassay variations of ELISA assessed over a range of concentrations of OTA standard a.
OTA found
Intraassay (n = 3) Interassay (n = 7)
OTA standard
(ng mL-1) Mean ± SD
(ng mL-1) CV (%)
Mean ± SD
(ng mL-1) CV (%)
0.20 0.35 0.50 1.00 2.00 5.00 10.00
0.23 ± 0.01 0.33 ± 0.01 0.47 ± 0.01 0.81 ± 0.03 1.87 ± 0.13 5.58 ± 0.16 9.55 ± 0.17
4.35 3.03 2.13 3.70 6.95 2.87 1.78
0.20 ± 0.01 0.31 ± 0.04 0.48 ± 0.08 1.10 ± 0.12 2.27 ± 0.30 5.23 ± 0.25 8.81 ± 0.50
5.00 12.90 16.67 10.91 13.21 4.78 5.68
aIntra- and interassay variations were determined by replicate analyses for each concentrations of standards run in the same plate
(n = 3) and by replicate of a set of standards run in different plates on different days (n = 7), respectively.
0 5 10 15 20 25
In
te
rf
e
re
n
c
e
(
%
)
10-fold dilution 100-fold
500-fold 1000-fold
2000-fold 250-fold
a Tukey test to different dilutions in each coffee modality. bTukey test to different coffee modality.
Figure 2 – Matrix interference in ic-ELISA: effect of extract dilution (10 to 2000-fold) on
OTA determination in green, roasted and instant coffees. Green Coffee
b b b b
Roasted Instant a a
c c c c
Ab
B B
Figure 3 – Matrices interferences of green, roasted and instant coffees in HPLC: (A) OTA standard; (B) artificially contaminated green coffee (8.19 ng/g); (C) artificially contaminated roasted coffee (20.59 ng/g); (D) artificially contaminated instant coffee (20.44 ng/g).
Several food matrix components could affect ELISA assay, such as non-specific interaction caused by high protein levels or large molecules causing steric hindrance of antibody-epitope binding leading to overestimate the real toxin level (Hefle, 1995; Pestka et al., 1995).
Fig. 3 shows the HPLC chromatograms of green, roasted, and instant coffee and interfering compounds could be observed in the chromatograms showing that HPLC methods shared the same problems with food matrices as ELISA.
The performance of ic-ELISA for OTA detection in coffee and the correlation between ELISA and HPLC were evaluated using artificially contaminated coffee (5 to 70 ng OTA/g). Fig. 4 correlated the data from OTA determination by
HPLC and by ic-ELISA. Immunoassay recorded higher values of OTA than HPLC in every kind of coffees tested, indicating either recovery losses during sample preparation in HPLC (clean up step) and/or food matrix effect during immunoassay (Petska et al., 1994; Ono et al., 2000). Ochratoxin levels analyzed by ELISA were 0.66 to 1.46-fold higher than HPLC in green coffee (ELISA/HPLC ratio = 1.02), 0.96 to 1.11-fold in roasted coffee (ELISA/HPLC ratio = 1.02) and 0.93 to 1.82-fold in instant coffee (ELISA/HPLC ratio = 1.24) (Fig. 4). The correlation coefficients (r) between the two methods were 0.98 for green coffee, 0.98 for roasted and 0.86 for instant and demonstrate the applicability of immunoassay (Fig. 4).
D
0 5 10 15 20 mV
Tempo (min) OTA OTA
A
0 5 10 15 20 mV
Tempo (min)
OTA
C Matrix
Interference
0 5 10 15 20 mV
Tempo (min)
0 5 10 15 20 mV
Tempo (min)
0 10 20 30 40 50 60 70
0 10 20 30 40 50 60 70
ELISA (ng/g)
H
P
L
C
(
n
g
/g
)
2 4 6 8 10 12 14 16 18 20
4 6 8 10 12 14 16 18
ELISA (ng/g)
H
P
L
C
(
n
g
/g
)
y = 1.526 + 0.833 x r = 0.98
ELISA/HPLC = 1.02
y = 0.497 + 0.971 x r = 0.98
ELISA/HPLC = 1.02
4 6 8 10 12 14 16 18 20 22 24
5 7 9 11 13 15 17 19 21 23
ELISA (ng/g)
H
P
L
C
(
n
g
/g
)
y = 4.920 + 0.773 x r = 0.86
ELISA/HPLC=1.24
Figure 4 – Correlation between HPLC and ic-ELISA data for ochratoxin determination in artificially
contaminated coffee samples (5 - 70 ng/g). Axes x and y show ochratoxin concentration (ng/g) as determined independently by ELISA and HPLC methods. (A) green coffee; (B) roasted coffee; (C) instant coffee.
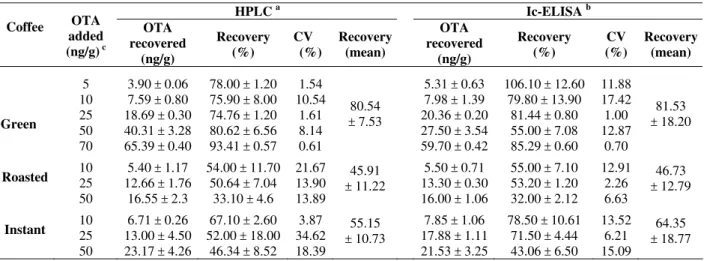
Table 3 shows the overall performance of ic-ELISA and HPLC comparing OTA recoveries. Green coffee spiked with 5 - 70 ng OTA/g exhibited recoveries of 55 - 106.1 % (mean of 81.53 %) by ic-ELISA while by HPLC the values were 74.76 - 93.41 % (mean of 80.54 %), demonstrating that adequate recovery and efficiency were achieved with anti-OTA.7 MAb (Table 3). Sibanda et al. (2001), using flow through enzyme immunoassay obtained OTA recoveries of 70 - 89 % in green coffee grains. Terada et al. (1986) reported OTA recovery of 81.5 % in green coffee grains using Sep-Pak C18 prior to HPLC. Trucksess et al. (1999) obtained mean recovery of 86 % using immunoaffinity column and HPLC. However, coffee based products such as roasted and instant had low OTA recoveries by both ELISA and HPLC (Table 3). In
roasted coffee, OTA levels ranging of 10 - 50 ng/g resulted in recoveries of 32 - 55% (mean of 46.73 %) by ic-ELISA. But HPLC also showed similar data (45.91 %). The same pattern was observed with instant coffee, where mean recoveries were 64.35 % for ELISA and 55.15 % for HPLC (Table 3). In spite of the low recovery for roasted and instant coffees (Table 3), the applicability of immunoassay was supported by ELISA/HPLC ratios of 1.02 and 1.24, and by the correlation coefficients of 0.98 and 0.86 for roasted and instant coffee, respectively (Fig. 4). The correlation between ic-ELISA and HPLC indicated the effectiveness of anti-OTA.7 MAb for OTA determination in roasted and instant coffee and reliability of the immunoassay performed.
A B
Table 3 – Recoveries of OTA added to green, roasted and instant coffees in determinations performed by ic-ELISA
and HPLC.
HPLC a Ic-ELISA b
Coffee OTA added (ng/g) c
OTA recovered (ng/g) Recovery (%) CV (%) Recovery (mean) OTA recovered (ng/g) Recovery (%) CV (%) Recovery (mean) Green 5 10 25 50 70
3.90 ± 0.06 7.59 ± 0.80 18.69 ± 0.30 40.31 ± 3.28 65.39 ± 0.40
78.00 ± 1.20 75.90 ± 8.00 74.76 ± 1.20 80.62 ± 6.56 93.41 ± 0.57
1.54 10.54 1.61 8.14 0.61 80.54 ± 7.53
5.31 ± 0.63 7.98 ± 1.39 20.36 ± 0.20 27.50 ± 3.54 59.70 ± 0.42
106.10 ± 12.60 79.80 ± 13.90
81.44 ± 0.80 55.00 ± 7.08 85.29 ± 0.60
11.88 17.42 1.00 12.87 0.70 81.53 ± 18.20
Roasted 10 25
50
5.40 ± 1.17 12.66 ± 1.76
16.55 ± 2.3
54.00 ± 11.70 50.64 ± 7.04
33.10 ± 4.6
21.67 13.90 13.89
45.91 ± 11.22
5.50 ± 0.71 13.30 ± 0.30 16.00 ± 1.06
55.00 ± 7.10 53.20 ± 1.20 32.00 ± 2.12
12.91 2.26 6.63
46.73 ± 12.79
Instant 10 25
50
6.71 ± 0.26 13.00 ± 4.50 23.17 ± 4.26
67.10 ± 2.60 52.00 ± 18.00
46.34 ± 8.52 3.87 34.62 18.39
55.15 ± 10.73
7.85 ± 1.06 17.88 ± 1.11 21.53 ± 3.25
78.50 ± 10.61 71.50 ± 4.44 43.06 ± 6.50
13.52 6.21 15.09
64.35 ± 18.77
a mean ± SD of 2 repetition in duplicate
bmean ± SD of 2 repetition in triplicate
cknown quantities of OTA added to coffee previously estimated as negative for OTA by HPLC (< 0.80 ng/g).
The low recoveries of roasted and instant coffee could be attributable to inadequate extraction, i.e. acetonitrile-water (3:1, v/v) unable to extract OTA from such a complex matrix. Change of extraction solvent could improve the pattern, and further study was able to achieve OTA recovery of 87.94 % in green coffee using 0.1 M fosforic acid and dichlorometane (Ribeiro et al., 2005). Prado et al. (2000) obtained OTA recoveries of 80 and 82 % by HPLC in roasted and instant coffees, respectively, using methanol - 3 % sodium bicarbonate (1:1, v/v). Leoni et al. (2000) reported values of 99.7 % in roasted coffee and 98 % in instant coffee by HPLC, using 1 % sodium bicarbonate solution. However, the extraction procedures recorded by these authors required an additional clean up step (partition).
Thus, the present anti-OTA.7 MAb-based ic-ELISA could be effectively applied to OTA screening of green, roasted and instant coffee, with advantages of simplicity, sensitivity, without cleanup or concentration steps. The small volume of samples and reagents required to perform ELISA assays could also enable the analysis of a high number of samples using an ecologically safe technique at a relatively low cost.
ACKNOWLEDGEMENTS
The authors would like to thank National Council of Scientific and Technological Development (CNPq, Brazil), CAPES-Brazil, Japan International Cooperation Agency (JICA) and Araucaria Foundation for financial support.
RESUMO
interferência de matriz no imunoensaio foi minimizada pela diluição das amostras previamente à análise por ELISA. O ic-ELISA desenvolvido pode ser considerado uma técnica alternativa simples, sensível e específica para análise de OTA, contribuindo para a qualidade e segurança de produtos de café.
REFERENCES
Accensi F., Abarca M.L., Cabañes F.J. (2004), Occurrence of Aspergillus species in mixed feeds
and component raw materials and their ability to produce achratoxin A. Food Microbiology, 21,
623-627.
Berg B. (2003), How to establish international limits for mycotoxins in food and feed? Food Control,14,
4, 219-224.
Blesa J., Berrada H., Soriano J.M., Moltó J.C., Mañes J. (2004), Rapid determination of ochratoxin A in cereals and cereals products by liquid chromatography. Journal of Chromatography A, 1046, 127-131.
Bradford M.M.(1976), A rapid and sensitive method for the quantification of microgram quantities of protein utilizing the principle of protein binding.
Analytical Biochemistry, 72, 5, 48-274.
Chiavaro E., Lepiani A., Colla A., Bettoni P., Pari E., Spotti E. (2002), Ochratoxin A determination in ham by immunoaffinity clean-up and a quick fluorometric method. Food Additives and Contaminants, 19, 6, 575-581.
Cholmakov Bodechtel C., Wolff J., Gareis M., Bresch H., Engel G., Majerus P., Rosner H., Schneider R. (2000), Ochratoxin A: representative food consumption survey and epidemiological analysis. Archives Fuer Lebensmittelhygiene, 51, 4/5, 111-115.
Chu F.S. (1984), Immunoassays for analysis of mycotoxins. Journal of Food Protection, 47,
562-569.
Commission Regulation (EC) No. 472/2002 of March 2002 Amending Regulation (EC) No. 466/2001 Setting Maximum Levels for Certain Contaminants in Foodstuffs.
Dall’Asta C., Galaverna G., Dossena A., Marchelli R. (2004), Reversed-phase liquid chromatographic method for determination of ochratoxin A in wine.
Journal of Chromatography A,1024, 275-279.
França A.S., Oliveira L.S., Borges, M.L.A., Vitorino M.D. (2001), Evolução da composição do extrato de café durante o processo de torrefação. Revista Brasileira de Armazenamento, Especial Café,
Viçosa, 2, 37-47.
Fujii S. (2002), Imunoensaio na detecção de ocratoxina A em café e efeito de cafeína sobre microbiota fúngica. Dissertação de Mestrado, Universidade Estadual de Londrina, Paraná, Brasil. Gazzaz S.S., Rasco B.A., Dong F.M. (1992),
Application of immunochemical assays to food analysis. Critical Reviews in Food Science and Nutrition,32, 3, 197-229.
Grosso F., Saïd S., Mabrouk I., Fremy J.M., Castegnaro M., Jemmali M., Dragacci S. (2003), New data on the occurrence of ochratoxin A in human sera from patients affected or not by renal diseases in Tunisia. Food and Chemical Toxicology, 41, 8, 1133-1140.
Harlow E., Lane D. (1988), Antibodies: a laboratory manual, ed. E. Harlow, D. Lane. Cold Spring
Harbor Laboratory, New York.
Hefle S.L. (1995), Immunoassay fundamentals. Food Technology,49, 2, 102-107.
IGUAÇÚ - Companhia IGUAÇÚ de Café Solúvel. Available in: < http://www.iguacu.com.br >. Accessed in: 19 May 2005.
Kawamura O., Sato S., Kajii H., Nagayama S., Ohtani K., Chiba J., Ueno Y. (1989), A sensitive Enzyme-Linked Immunosorbent assay of Ochratoxin A based on Monoclonal Antibodies.
Toxicon, 27, 8, 887-897.
Leoni L.A.B., Valente Soares L.M., Oliveira P.L.C. (2000), Ochratoxin A in Brazilian roasted and instant coffees. Food Additives and Contaminants, 17, 10, 867-870.
Lindenmeier M., Schieberle P., Rychlik M. (2004), Quantification of ochratoxin A in food by a stable isotope dilution assay using high performance liquid chromatography tandem mass spectrometry.
Journal of Chromatography A,1023, 57-66.
Fonseca H. MICOTOXINAS on line - Legislação Nacional e Internacional de Micotoxinas. Available in: < http://www.micotoxinas.com.br >. Accessed in: 19 May 2005.
Ono E.Y.S., Kawamura O., Ono M.A., Ueno Y., Hirooka E.Y. (2000), A comparative study of indirect competitive ELISA and HPLC for fumonisin detection in corn of the State of Paraná, Brazil. Food Agricultural Immunology, 12, 1, 5-14. Pestka J.J., Abouzied M.N., Sutikno. (1995),
Immunological assays for mycotoxin detection.
Food Technology, 49, 2, 102-107.
Petzinger E., Weidenbach A. (2002), Mycotoxins in the food chain: the role of ochratoxins. Livestock Production Science,76, 245-250.
Pimenta C.J., Costa L., Chagas S.J.R. (2000), Peso, acidez, sólidos solúveis, açúcares e compostos fenólicos em café (Coffea arabica L.) colhidos em diferentes estádios de maturação. Revista Brasileira de Armazenamento, Especial Café,
Pittet A., Royer D. (2002), Rapid, low cost thin layer chromatographic screening method for the detection of ochratoxin A in green coffee at control level of 10µg/kg. Journal of Agricultural and Food Chemistry,50, 2, 243-247.
Pittet A., Tornare D., Huggett A., Viani R. (1996), Liquid chromatographic determination of ochratoxin A in pure and adulterated soluble coffee using na immunoaffinity column cleanup procedure.
Journal of Agricultural and Food Chemistry, 44,
3564-3569.
Prado G., Oliveira M.S., Abrantes F.M., Santos L.G. dos, Veloso T., Barroso R.E. de S.(2000), Incidência de ocratoxina A em café torrado e moído e em café solúvel consumido na cidade de Belo Horizonte, MG. Ciência e Tecnologia de Alimentos,20, 2, 192-196.
Ribeiro R.M.R., Fujii S., Takabayashi C.R., Nogari A.B., Silva M., Coelho A.R., Bernd L. P., Fungaro M.H.P., Ono E.Y.S., Lebre D.L., Miranda S.G., Kawamura O., Hirooka E.Y. (2005), Produção de ocratoxina A visando obtenção de reagente básico destinado ao controle de qualidade em alimentos. Paper presented at XIV Encontro Nacional de Analistas de Alimentos, 12-16 June, Goiânia, GO, Brazil.
Saez J.M., Medina A., Gimeno-Adelantado J.V., Mateo R., Jiménez M. (2004), Comparation of different sample treatments for the analysis of ochratoxin A in must, wine and beer by liquid chromatography. Journal of Chromatography A,
1029, 1-2, 125-133.
Sibanda L., De Saeger S., Bauters T.G.M., Nelis H.J., Van Peteghem C. (2001), Development of a Flow through enzyme immunoassay and application in screening green coffee samples for ochratoxin A with confirmation by High Performance Liquid Chromatography. Journal of Food Protection, 64,
10, 1597-1602.
Sibanda L., De Saeger S., Van Peteghem C. (2002), Optimization of solid-phase clean-up prior to liquid chromatographic analysis of ochratoxin A in roasted coffee. Journal of Chromatography A,959,
1-2, 327-330.
Sydenham E.W., Shephard G.S. (1996), Chromatographic and allied methods of analysis for selected mycotoxins. In-Progress in Food Contaminants Analysis, ed. J. Gilbert. Blackie
Academic and Professional, London, pp. 65-146. Sydenham E.W., Shephard G.S., Thiel P.G., Bird C.,
Miller, B.M. (1996), Determination of fumonisin in corn: evaluation of competitive immunoassay and HLC techniques. Jounal of Agricultural and Food Chemistry, 44, 159-164.
Taniwaki M.H., Pitt J.I., Teixeira A.A., Iamanaka B.T. (2003), The source of ochratoxin A and Brazilian coffee and its formation and relation to processing methods. International Journal of Food Microbiology,82, 2, 173-179.
Terada H., Tsubouchi H., Yamamoto K., Hisada K., Sakabe Y. (1986), Liquid Chromatographic determination of Ochratoxin A in coffee beans and coffee products. Journal of the Association of Official Analytical Chemists International, 69, 6,
960-964.
Thirumala-Devi K., Mayo M.A., Reddy G., Reddy S.V., Delfosse P., Reddy D.V. (2000), Production of polyclonal antibodies against ochratoxin A and its detection in chilies by ELISA. Journal of Agricultural and Food Chemistry,48, 10, 5079-82. Trucksess M.W., Giler J., Young K., White K.D.,
Page S.W. (1999), Determination and Survey of Ochratoxin A in Wheat, Barley and Coffee.
Journal of the Association of Official Analytical Chemists International, 82, 1, 85-89.
Xiao H., Clarke J., Marquardt R.R., Frohlich A.A. (1995), Improved methods for conjugating selected mycotoxins to carrier proteins and dextran for immunoassays. Journal of Agricultural and Food Chemistry, 43, 2092-2097.