Article
*e-mail: [email protected]
Determination of Ochratoxin A in Wine by High-Performance Thin-Layer
Chromatography using Charged Coupled Device
Juliane E. Welke,*,a Michele Hoeltz,a Horacio A. Dottorib and Isa B. Nolla
aInstituto de Ciência e Tecnologia de Alimentos and bInstituto de Física,
Universidade Federal do Rio Grande do Sul, 91570-901 Porto Alegre-RS, Brazil
Um método foi desenvolvido e validado para a determinação de ocratoxina A (OTA) em vinho. Foi utilizado um sistema contendo um detector de carga acoplada (CCD) para adquirir as imagens luorescentes da micotoxina obtidas a partir das placas de cromatograia em camada delgada de alta eiciência (HPTLC) sob luz ultravioleta. O método desenvolvido mostrou recuperação média de 90,4%. O limite de quantiicação e o limite de detecção foram de 0,1 μg L-1 e 0,016 μg L-1,
respectivamente. Os resultados da validação confirmaram a eficiência do método, que é suicientemente sensível para ser utilizado para quantiicar OTA em vinho. A OTA foi encontrada em uma das amostras de vinho na concentração de 4,5 μg L-1, que é superior ao limite de 2 μg L-1
considerado aceitável pelo Comitê Cientíico das Comunidades Européias. Este estudo demonstrou a aplicabilidade do sistema HPTLC-CCD para determinar OTA em vinho.
A method was developed and validated in-house for determination of ochratoxin A (OTA) in wine using charge coupled device (CCD) to acquire the luorescence images of mycotoxin from high-performance thin-layer chromatography (HPTLC) under UV lamp. The method showed a mean recovery of 90.4%. The quantiication and detection limist were 0.1 μg L-1 and 0.016 μg L-1
per spot, respectively. The results of validation conirmed the eficiency of the method, which is sensitive enough to be used to quantify OTA in wine. The occurrence of OTA in Brazilian wines was evaluated. OTA was found in one sample at a level of 4.5 μg L-1, which is higher than the limit
of 2 μg L-1 considered acceptable by the Scientiic Commission of the European Communities. This
study demonstrated the applicability of HPTLC using CCD as a tool to determine OTA in wine.
Keywords: ochratoxin A, wine, charge-coupled device imaging, high-performance thin-layer
chromatography
Introduction
Ochratoxin A (OTA), 7-(L-b-phenylalanyl-carbonyl)- carboxyl-5-chloro-8-hydroxy-3,4-dihydro-3R-methyl-isocumarin, is a mycotoxin produced by Penicillium verrucosum, Aspergillus ochraceus,1 A. niger and A.
carbonarius.2,3 OTA occurs in several food products such
as in cereals,4 coffee beans,5 beer,6 cacau,7 wheat,8 dried
fruit,9 cheese,10 grape juice and wine.11 Wine represents,
after cereals, the major source (15%) of OTA intake for European population.12
OTA is receiving major attention for its nephrotoxic effects. This toxin is also known for its mutagenic,13
teratogenic,14 immunosuppressive15 and carcinogenic
proprieties.16-19 OTA has been associated with Balkan
Endemic Nephropathy and the development of urinary tract tumors in humans.20,21 The International Agency
for Research on Cancer classiied OTA as a possible carcinogen to humans (group 2 B).22 Thus, because of
possible health effects, there is an increasing need to monitor this mycotoxin in food samples including wine. There are recommendations of Provisional Tolerable Weekly Intakes (PTWI) for OTA of 100 ng kg-1 body
weight.1 The Scientiic Commission of the European
Community established the maximum allowed level of 2 μg L-1 of OTA in wine.23 There is yet no maximum
permissible level established for this mycotoxin in wine in Brazil, but it is necessary to adopt limits for OTA so as to minimize the health hazard risk.
After the irst detection of OTA in wine,24 several
as several methods have been developed for analysis of OTA in foods, including wine.28-30 OTA is usually
extracted with acidiied organic solvents (e.g acidiied chloroform). Clean-up is carried out by liquid-liquid or solid-phase extraction (SPE).31 Monoclonal antibody
based immunoafinity columns (IACs) have also been developed to substitute the traditional solvent clean-up.28-30 However, the relatively expensive and limited
shelf-life of IACs are disadvantageous for use in large survey programs of OTA. Furthermore, because the antibodies used in IACs are fragile proteins, which can readily lose their binding afinity as a result of subtle changes in conditions, such as temperature and pH, experimental and storage conditions need to be carefully controlled and monitored.32 Reversed-phase HPLC and
enzyme-linked immunosorbent assays (ELISA) are used for OTA determination.25,28,33,34 ELISA is a method
expensive due to high price of specific mycotoxin antibodies and high-performance liquid chromatography (HPLC) requires sophisticated and costly equipment, extensive clean-up procedures and high purity solvents. Besides high recovery levels, low detection limit and repeatability, wineries and government in monitoring and survey programs, need inexpensive methods for routine analysis of ochratoxin A in wines. HPTLC is a fast, cheap and eficient method of separation and identiication of many mycotoxins.
Charge-coupled devices (CCDs) are two-dimensional detectors containing an array of sensors that can image an area in fraction of seconds or real time.35 The output
from each sensor pixel on the CCD is a voltage, which is proportional to the intensity of light falling on the sensor and the exposure time. These series of voltages are digitized and transferred to a computer for storage and data processing.36
By coupling CCD detection with HPTLC, the entire HPTLC can be imaged in a single exposure yielding rapid quantiication in shorter analysis time than of slit scanning densitometers.37 CCD detectors have
demonstrated extremely low dark current and read noise characteristics, high sensitivity and excellent linearity. These features have made the CCD an excellent detector for many imaging applications in chemical analysis, such as luorescence detection.38
In this study a method using HPTLC quantiication through the luorescence images from UV lamp recorded by a CCD camera was developed for determination of ochratoxin A in wine. The potential of the method was demonstrated through the analysis of wine samples produced in Brazil.
Experimental
Ochratoxin A standard solution
A stock standard solution of OTA was prepared by dissolving 1 mg of pure crystalline OTA (Sigma-Aldrich) in toluene-acetic acid (99:1, v/v) at a concentration of 40 μg mL-1. The standard solution was kept frozen
(−18 °C). The concentration of the OTA stock solution was determined by measuring the UV absorbance at 366 nm and calculated by using the molar extinction coeficient ε of 5440 m2 mol-1. The concentration of working standard
solution in toluene-acetic acid (99:1, v/v) was 8 μg mL-1.39
Samples
Thirty-four red wines were purchased from retail stores. All samples were produced in Rio Grande do Sul state, Brazil. Bottles were stored at room temperature and opened only before analysis.
Sample preparation
Ochratoxin A extraction
A modified version of the method employed by Zimmerli and Dick.24 A portion of 10 mL of wine was
acidiied to pH 2.0-2.2 using 85% orthophosphoric acid and intensively mixed for 1 min using a vortex mixer. After addition of 5 mL chloroform, the mixture was centrifuged at 2500 g for 5 min. The clear organic phase at the bottom was transferred to a pear-shaped lask and extracted twice with 5 mL of 1.25% NaHCO3 solution. The NaHCO3 phases were combined and adjusted to pH 2.5 with formic acid (approximately 0.5 mL formic acid was needed). This phase was extracted with 5 mL chloroform. The solvent was evaporated and redissolved in 100 μL of toluene-acetic acid (99:1, v/v). All samples were analyzed in triplicate.
Chromatography
Chromatographic separations were performed on 10 cm × 10 cm HPTLC glass plates coated with silica gel 60 (Merck). Four, eight and twelve microliter aliquots of sample extract and OTA standard solution (8 μg mL-1)
were spotted 1 cm apart on HPTLC plates. The spots were dried, and the plates developed in solvent system toluene:ethylacetate:formic acid (6:3:1 v/v/v). Calibration curve was done with OTA standard solution ranging of 0.8 to 32 μg L-1. For conirmation of OTA, the plates were sprayed
room temperature and viewed under long wavelength UV light (366 nm). The luorescence of OTA changed from greenish blue to blue and increased in intensity.
CCD Imaging system
The quantiication of the luorescence intensities from UV lamp were recorded by a CCD camera (Sony, Tokyo, Japan). The HPTLC plate was positioned in system and CCD camera was aligned for optimal pixel resolution of CCD images. The image was analyzed using Image Processing and Analysis in Java package (Image J, http://rsbweb.nih.gov/ij/). The package is freely available and it is very appropriate for the current application. Image J is one of the many image processing tools available and is required for the analysis of images generated by the CCD camera and to carry out the necessary operations. It is a versatile software, which offers a wide array of functionalities that can be customized to meet speciic requirements.40
The simplest way to measure the spots brightness is called diaphragm photometry and we adopted circular diaphragms due to the OTA spots symmetry. To discount the background, several backgrounds around every spot were measures with the same diaphragm.
Method validation
Validation of the analytical method was based on the following parameters: linearity, recovery percentage, precision, limit of detection (LOD) and limit of quantiication (LOQ). The sensitivity of the HPTLC-CCD technique was evaluated by determining LOD for OTA, which was derived from the luorescence of OTA standard with the lowest detectable signal. The result was compared with that obtained for the minimum concentration of OTA that the human eye is capable of detecting in TLC plates under UV light. The LOQ was obtained as the least amount of OTA in samples that can be quantitatively determined with accuracy and precision. Linearity was determined by analysis of seven point calibration curves using the intensity of OTA luorescence versus OTA concentration. Ten calibration curves were done. The precision of OTA determination on HPTLC plates using CCD camera to take images and Image J software was evaluated by taking ive successive HPTLC images by CCD camera of ten plates containing 0.8, 1.6, 3.2, 4.8, 6.4, 8.0 and 12.8 μg L-1 of OTA. Then, the precision
was calculated by the relative standard deviation (RSD) for intra- and inter-plates determinations. Repeatability of the OTA extraction method and the accuracy of the HPTLC-CCD technique were assessed by measuring the percentage recovery of OTA-free wine samples spiked with the toxin.
Recovery was determined by analyzing of ten wine samples spiked with 0.3, 0.5, 1.5, 2.0, 3.5, 5.0 and 8.0 μg L-1 of OTA.
This procedure was done in triplicate. Within-day precision was determined by analyzing ten replicates of spiked wines at levels of 0.3, 0.5, 1.5, 2.0 and 5.0 μg L-1 of OTA, and
between-day precision was determined by analyzing ten replicates over a 10-day period at the same levels.
Results and Discussion
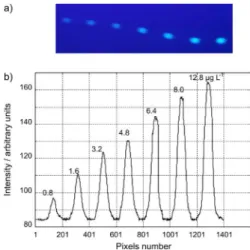
This technique is based in use of CCD to acquire the luorescence images of OTA from HPTLC plate under UV lamp. Under acid conditions OTA generates blue luorescence at 366 nm. The ability of the CCD array detector to take analytical information is demonstrated in Figure 1a. A chromatogram can be generated by positioning of cursors on luorescent spots which correspond to different OTA concentrations of each analyzed wine sample (Figure 1b). Each peak corresponds to a concentration of extract of wine spotted on HPTLC plate. The CCD camera system is suficiently sensitive to see small changes in luorescence intensity caused by illumination gradients from the UV light source. The change in luorescence signal intensity corresponds to the different concentrations of OTA standard. Seven OTA levels ranging from 0.8 to 12.8 μg L-1 were
spotted on the same HPTLC plate to evaluate intra-plate precision (Table 1). In addition, this procedure was repeated using ten plates to evaluate inter-plate precision. The RSD of measurements for all OTA levels was lower than 9.9% and 11.5% for the intra and inter-plate assay, respectively.
The procedure used to extract OTA from wine was simple and practical. Reduced amounts of chloroform were used to extract OTA, considering a current trend towards minimizing the amounts of toxic solvents for
Figure 1. Image of HPTLC plate acquired by the CCD camera with 0.8, 1.6, 3.2, 4.8, 6.4, 8 and 12.8 μg L-1 of OTA standard solution. (b)
environmental and sanitary reasons. One common problem in chromatographic determination of OTA is the interferences from matrix components (such as lavonoids) that are usually present in red wines.41 These components
were selectively removed from red wine samples before HPTLC-CCD analysis (Figure 2). Figure 3 shows a HPTLC plate that contains spots of wine extract without
the NaHCO3 treatment. Some matrix components dificult OTA quantiication.
Sample clean-up was done using NaHCO3 solution. Then, the use of immunoafinity columns or other clean-up method was not necessary. Techniques based on immunoafinity columns for clean-up sample are frequently used but they have a high cost.25,29,30
The validated in-house method showed good linearity. The linear regression coeficient of standard solution curve (y = 5.067x + 1.6786) for OTA within the concentration ranging from 0.8 to 32 μg L-1 was 0.996. The mean recovery
of OTA was 90.4% with mean standard deviation of 7.7% (Table 2). The LOD value obtained was 0.016 μg L-1 per
spot and the LOQ was 0.1 μg L-1. The results of the within
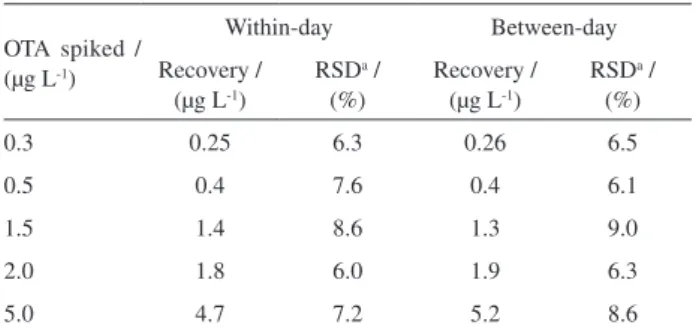
and between-day precision of the assay (Table 3) show that the method has good precision, with RSDs ≤ 9.0.
These results of validation were similar to those of the oficial method used to determine ochratoxin in wine, which found average recoveries from wine samples spiked at levels from 0.04 to 10 μg L-1 ranging from 88% to 103% and the
detection limit was 0.01 μg L-1 using immunoafinity column
clean-up and HPLC.6 Noba et al.42 developed a method
based in the use of immunoafinity column for clean-up
Table 1. Precision of OTA determination on HPTLC plates using CCD camera to take images and Image J software to quantify OTA.
OTA spot / (μg L-1) Intra-plate (n = 5)
RSDa / (%)
Inter-plate (n = 50) RSDa / (%)
0.8 7.6 11.5
1.6 5.2 10.9
3.2 4.8 6.4 8.0
8.8 6.2 8.5 9.9
9.3 8.5 8.3 9.0
12.8 8.7 9.6
aRSD = Relative standard deviation.
Figure 2. (a) HPTLC image of OTA with 5, 8 and 10 μL of sample extract with NaHCO3 treatment, which contain 1.5, 3.1 and 4.5 μg L-1 of OTA;
the last spot corresponds to 14.2 μg L-1 of OTA standard solution. (b)
Chromatogram constructed from HPTLC plate image by Image J software.
Figure 3. (a) HPTLC image of OTA with 11.5 μg L-1 of OTA standard
solution and 5, 8 and 10 μL of sample extract without NaHCO3 treatment. (b) Chromatogram constructed from HPTLC plate image by Image J software showing matrix components interfering in OTA quantiication.
Table 2. Recovery results of the method for determination of ochratoxin A in wine
OTA spiked / (μg L-1)
Recovery / (μg L-1)
Recovery / (%)
RSD / (%)a
0.3 0.25 83 5.0
0.5 0.4 84 5.7
1.5 1.4 87 6.3
2 1.8 90 11
3.5 3.1 89 6.5
5 5.1 102 10.0
8.0 7.4 93 9.5
aRSD = Relative standard deviation.
Table 3. Precision of the method for determination of ochratoxin A in wine using HPTLC-CCD technique
OTA spiked / (μg L-1)
Within-day Between-day
Recovery / (μg L-1)
RSDa /
(%)
Recovery / (μg L-1)
RSDa /
(%)
0.3 0.25 6.3 0.26 6.5
0.5 0.4 7.6 0.4 6.1
1.5 1.4 8.6 1.3 9.0
2.0 1.8 6.0 1.9 6.3
5.0 4.7 7.2 5.2 8.6
and liquid chromatography-tandem mass spectrometry for quantiication of this mycotoxin. The average recoveries of OTA from white and red wine were 95 and 96.7% to spiked OTA level of 0.05 μg L-1. The repeatabilities expressed as
relative standard deviation were 3.8 and 2.4%, respectively. The applicability of the developed method in this work was tested analyzing 34 red wine samples. This survey utilized red wine to study OTA occurrence considering that red wines are the most consumed in Brazil, and previous reports from other countries have indicated that this wine is more susceptible to OTA contamination.24,43
The analyzed wines were produced in Rio Grande do Sul, the southernmost state of Brazil, where are produced approximately 90% of Brazilian wines. OTA was found in only one sample at level of 4.5 μg L-1, which is higher
than the limit of 2 μg L-1 considered acceptable by The
Commission of the European Communities.
During the last decade, the occurrence of OTA in different wines originating from various countries has been reported.25,27,42-46 In Brazil, Rosa et al.47 analyzed 80 samples
of national and imported wines. OTA were detected in 28.75% of samples, at concentrations ranging from 0.021 to 0.071 μg L-1, with an average of 0.037 μg L-1. Shundo et al.48
found OTA contamination in nine of 29 Brazilian red wines with levels ranging from 0.10 to 1.33 μg L-1.
More studies must be conducted on OTA occurrence in wines and grape juices produced in Brazil. Since the wine consumption in this country is increasing, the controlling the levels of OTA is necessary. Moreover, knowledge of the extent of OTA contamination in Brazilian products is important to establish national regulations. This is the irst report of use of HPTLC-CCD system to quantify OTA. This system was used to quantify patulin in apple juice49-51 and alatoxin in peanuts.52 The HPTLC-CCD
method is useful mainly for producers and governments to have a rapid and inexpensive method for quantiication of this mycotoxin, including producers which intend to export their products. This method is important for analysis where the cost is often the irst factor considered before the method is adopted.
This study demonstrated the applicability of HPTLC-CCD technique as a tool to determinate OTA in wine. The method is fast, simple and economical. The use of a single HPTLC plate allows the separation, identiication and quantiication of OTA. The CCD imaging system provides good sensitivity, precision and linearity for the quantitative determination of OTA. The results of validation conirmed the eficiency of the method, which is sensitive enough to be used in studies required to quantify OTA in red wines. The method can be immediately available in laboratories without the necessity of acquiring expensive equipment.
References
1. Joint FAO/WHO Expert Commitee on Food Additives; 56th
Meeting, Geneva, 2001, p. 6.
2. Cabanes, F.; Accensi, F.; Bragulat, M. R.; Abarca, M. L.; Castella, G.; Minguez, S.; Pons, A.; Int. J. Food Microbiol. 2002, 79, 213.
3. Abarca, M. L.; Accensi, F.; Bragulat, M. R.; Castella, G.; Cabañes, F. J.; J. Food Protec. 2003, 66, 504.
4. Rafai, P.; Bata, A.; Jakab, L.; Food Addit. Contam.2000, 17,
799.
5. Pardo, E.; Marín, S.; Ramos, A. J.; Sanchis, V.; Food Sci.
Technol. Int. 2004, 10, 45.
6. Visconti, A.; Pascale, M.; Centonze, G.; J. Chromatogr., A 1999,
864, 89.
7. Amézqueta, S.; González-Peñas, E.; Murillo, M.; De Cerain, A. L.; Food Addit. Contam. 2005, 6, 590.
8. Riba, A.; Mokrane, S.; Mathieu, F.; Lebrihi, A.; Sabaou, N.;
Int. J. Food Microbiol. 2008, 122, 85.
9. Karbanciolu-Guler, F.; Heperkan, D.; Anal. Chim. Acta 2008,
617, 32.
10. Dall’asta, C.; De Dea Lindner, J.; Galaverna, G.; Dossena, A.; Neviani, E.; Marchelli, R.; Food Chem. 2008, 2, 729. 11. Burdaspal, P.; Legarda, T.; Food Addit. Contamin. 2007, 9, 976. 12. Codex Alimentarius Commission; Position Paper on Ochratoxin
A (CX/FAC 99/14); Codex Committee on Food Additives and
Contaminants 31st session; Codex Alimentarius Commission: The Hague, The Netherlands, 1999.
13. Palma, N.; Cinelli, S.; Sapora, O.; Wilson, S. H.; Dogliotti, V.;
Chem. Res. Toxicol. 2007, 7, 1031.
14. Balasaheb, W. P.; Sinha, N.; Dwivedi, P.; Sharma, A. K.;
J. Turkish German Gynecol. Assoc. Ártemis 2007, 4, 357.
15. Rossiello, M. R.; Rotunno, C.; Coluccia, A.; Carratú, M. R.; Di Santo, A.; Evangelista, V.; Semeraro, N.; Colucci, M.; Toxicol.
Appl. Pharmacol. 2008, 229, 227.
16. Schlatter, C. H.; Studer-Rohr, J.; Rasonyi, T. H.; Food Addit.
Contam. 1996, 13, 43.
17. Castegnaro, M.; Mohr, U.; Pfohl-Leszkowicz, A.; Esteve, J.; Stein-Mann, J.; Tillmann, T.; Michelon, J.; Bartsch, H.; Int. J.
Cancer1998, 77, 70.
18. Petzinger, G. Ziegler, K.; J. Vet. Pharmacol. 2000, 23, 91. 19. Brown, A. L.; Odell, E. W.; Mantle, P. G.; Exp. Toxicol. Pathol.
2007,59, 85.
20. European Food Safety Authority; EFSA J. 2006, 365, 1. 21. Marquardt, R. R.; Frolich, A. A.; J. Anim. Sci.1992, 70, 3968. 22. IARC Monographs on the Evaluation of Carcinogenic Risks to
Humans, IARC: Lyon, 1993, vol. 56,p. 489.
23. Commission of the European Communities; Oficial Journal
of the European Union,2006, L364, 5.
26. Blesa, J.; Soriano, J. M.; Moltó, J. C.; Mañes, J.; J. Chromatogr.,
A 2004, 1054, 397.
27. Ng, W.; Mankotia, M.; Pantazopoulos, P.; Neil, R. J.; Scott, P.
M.; Food Addit. Contam. 2004, 10, 971.
28. Aresta, A.; Vatinno, R.; Palmisano, R.; Zambonin, C. G.;
J. Chromatogr., A 2006, 1115, 196.
29. Gonzalez-Peñas, E.; Leache, C.; López De Cerain, A.; Lizarraga, E.; Food Chem. 2006, 97, 349.
30. Meletis, K.; Meniades-Meimaroglou, S.; Markaki, P.; Food
Addit. Contam. 2007, 11, 1275.
31. Jornet, D.; Busto, O.; Guasch, J.; J. Chromatogr., A 2000, 882,
29.
32. Varelis, P.; Leong, S. L.; Hocking, A.; Giannikopoulos, G.; Food
Addit. Contam. 2006, 12, 1308.
33. Alarcón, S. H.; Palleschi, G.; Compagnone, D.; Pascale, M.; Visconti, A.; Barna-Vetró, I.; Talanta 2006, 69, 1031. 34. Zheng, Z.; Hanneken, J.; Houchins, D.; King, R. S.; Lee, P.;
Richard, J. L.; Mycopathol. 2005, 159, 265.
35. Lancaster, M.; Goodall, D. M.; Bergstrom, E. T.; Mccrossen, S.; Myers, P.; Anal. Chem. 2006, 78, 905.
36. Lancaster, M.; Goodall, D. M.; Bergstrom, E. T.; Mccrossen, S.; Myers, P.; J. Chromatogr., A 2005, 1090, 165.
37. Hayakawa, T.; Hirai, M.; Anal. Chem. 2003, 75, 6728. 38. Zhang, L.; Lin, X.; J. Chromatogr., A 2006, 1109, 273. 39. Association of Oficial Analytical Chemists International;
Oficial Methods on Analysis of AOAC International, 17th ed.,
Maryland, USA, 2007, vol. 49, p. 47.
41. Omar, S. N.; Manoj, K. M.; DheevatsaMudigere, B. E.;
J. Bodywork Mov. Ther. 2007, 11, 231.
41. Yu, J. C. C.; Lai, E. P. C.; Food Chem. 2007, 105, 301. 42. Noba, S.; Omote, M.; Kitagawa, Y.; Mochizuki, N.; J. Food
Protec. 2008, 71, 1038.
43. Otteneder, H.; Majerus, P.; Food Addit. Contam. 2000, 9, 793. 44. Pietri, A.; Bertuzzi, T.; Pallaroni, L.; Piva, G.; Food Addit.
Contam. 2001, 7, 647.
45. Berente, B.; Móricz, A.; Otta, M. H.; Zaray, G.; Leko, L.; Rácz,
L.; Microchem. J. 2005, 79, 103.
46. Valero, A.; Marín, S.; Ramos, A. J.; Sanchis, V.; Food Chem.
2008, 2, 593.
47. Rosa, C. A. R.; Magnoli, C. E.; Fraga, M. E.; Dalcero, A. M. Santana, D. M. N.; Food Addit. Contam. 2004, 4, 358. 48. Shundo, L.; De Almeida, A. P.; Alaburda, J.; Ruvieri, V.; Navas,
S. A.; Lamardo, L. C. A.; Sabino, M.; Braz. J. Microbiol. 2006,
4, 533.
49. Welke, J. E.; Hoeltz, M.; Dottori, H. A.; Noll, I. B.; Food Addit.
Contam. 2009, 26, 754.
50. Welke, J. E.; Hoeltz, M.; Dottori, H. A.; Noll, I. B.; Food Control
2009, 20, 48.
51. Welke, J. E.; Hoeltz, M.; Dottori, H. A.; Noll, I. B.; J. Food
Safety, in press.
52. Hoeltz, M.; Welke, J. E.; Dottori, H. A.; Noll, I. B.; Quim. Nova, in press.