Palavras chave: Carbono orgânico Frações do carbono do Solo Composição isotópica Mata atlântica Historic: Received 18/03/2017 Accept 26/06/2017 Keywords: Organic carbon Soil carbon fractions Isotopic composition Atlantic forest
1 Federal Institute of Education Science and Technology of Rio de Janeiro - Pinheiral, Rio de Janeiro, Brazil 2 Federal Rural University of Rio de Janeiro - Seropédica, Rio de Janeiro, Brazil
3 Empresa Brasileira de Pesquisa Agropecuária - Seropédica, Rio de Janeiro, Brazil 4 Empresa Brasileira de Pesquisa Agropecuária - Brasília, Distrito Federal, Brazil 5 Universidade de São Paulo, Piracicaba, São Paulo, Brazil
+Correspondence: [email protected]
DOI: 10.1590/01047760201723032333
Carlos Eduardo Gabriel Menezes
1, Roni Fernandes Guareschi
2, Marcos Gervasio Pereira
2+,
Lúcia Helena Cunha Anjos
2, Maria Elizabeth Fernandes Correia
3, Fabiano Carvalho
Balieiro
4, Marisa de Cássia Piccolo
5ORGANIC MATTER IN AREAS UNDER SECONDARY FORESTS AND PASTURE
ABSTRACT:
The objective of this study was to evaluate the soil carbon stock (Stock C)
and bulk density, the chemical and granulometric fractions of the organic matter and the
isotopic signal of the soil
δ
13C in forest fragments and a mixed managed pasture (MMP).
The study was carried out in the municipality of Pinheiral, State of Rio de Janeiro. The
evaluated areas were: fragment of secondary forest in initial stage (SFIS) with 20 years of
regeneration; fragment of secondary forest in intermediate stage (SFINS), with 25 years of
regeneration; advanced secondary forest fragment (SFAS) with 60 years of regeneration
and mixed pasture managed (MHP).
The attributes related to soil carbon showed
significant responses to the effects of land degradation / recovery processes, especially
for the following indicators: total organic carbon, organic matter stock and particulate
organic matter. No significant alterations for humic substances, and prevalence of the
humin fraction was found. The most significant changes in
δ
13C values occurred up to the
depth of 60 cm. In the grassland area, at 0-10 cm, 67% of the carbon stock comes from
C
4plants, reducing in the subsequent layers. In SFINS and SFAS areas, at 0-10 cm, the
contribution of C
3plants was significant, with minor changes in depth.
MATÉRIA ORGÂNICA EM ÁREAS DE FLORESTAS SECUNDÁRIAS E PASTAGEM
RESUMO:
O objetivo deste trabalho foi avaliar a densidade do solo e o estoque de
carbono (EstC) do solo, as frações químicas e granulométricas da matéria orgânica e o
sinal isotópico do
δ
13C do solo em fragmentos florestais e uma área de pastagem mista
(MMP). O estudo foi realizado no município de Pinheiral, Estado do Rio de Janeiro.
As áreas
avaliadas foram: fragmento de floresta secundária em estádio inicial (FSEI) com 20 anos de
regeneração; fragmento de floresta secundária em estádio intermediário (FSEI), com 25
anos de regeneração; fragmento de floresta secundária em estádio avançado (FSEA) com 60
anos de regeneração e uma pastagem mista manejada (PMM). Os atributos relacionados ao
carbono do solo mostraram respostas significativas aos efeitos dos processos de degradação
/ recuperação da terra, especialmente para os seguintes indicadores: carbono orgânico
total, matéria orgânica e matéria orgânica particulada. Não houve alterações significativas
para as substâncias húmicas e foi encontrada a prevalência da fração humina. As mudanças
mais significativas nos valores de
13C ocorreram até a profundidade de 60 cm. Na área
de pastagem, a 0-10 cm, 67% do estoque de carbono vem de plantas C4, reduzindo nas
camadas subseqüentes. Nas áreas FSEI e FSEA, em 0-10 cm, a contribuição das plantas C3
INTRODUCTION
Deforestation for agricultural crops, followed by
pastures in bustling relief regions, that is, with deep and
dissected narrow valleys, can give rise to a landscape with
different degrees of degradation, and the main indicators
of this process are the decreases in the capacity of soil
water retention, low soil stability favoring an increase
in the erosion process, and reductions in fertility levels
and soil capacity to store carbon (MACHADO et al.,
2010; MACEDO et al., 2008; GUARESCHI et al., 2014).
However, Guareschi et al. (2014) has verified that the plant
successions in the areas of forest under pasture promote
the improvement of the physical and chemical attributes
of the soil through the addition of organic matter.
According to Schedlbauer and Kavanagh (2008),
reductions in soil carbon content from conversion of
rainforest to pasture can often be restored through the
development of secondary forests. However, Coutinho
et al. (2010) when evaluating the impact of pasture
substitution by eucalyptus plantation and secondary
forest area, did not observe differences in soil C stocks
in the forest and eucalyptus areas compared to a pasture
area. Differences in the results found may be occurring,
due to the time of installation of adopted management or
forest recovery. Substantial losses of soil carbon resulting
from the conversion of tropical forest into pasture can
often be restored through the development of secondary
forest (SCHEDLBAUER; KAVANAGH, 2008).
As for soil physical attributes in pasture areas and
secondary forests in the Atlantic Forest, studies have shown
higher values of bulk density (Bd) in pasture areas in relation
to secondary forest (SANTOS et al., 2010; MELLONI et al.,
2008). These results are justified by compaction of the soil
by the trampling of the animals in the pasture area and by
the greater and constant accumulation of vegetal residues
on the soil surface (SVR) of the forest area in relation to
pasture area. However, studies by Coutinho et al. (2010)
and Oliveira et al. (2008) did not find a significant difference
for Bd. This pattern may be due to the small recovery time
of the secondary forest, that is, its regeneration has not
yet been able to reduce the impacts on Bd caused by the
previous PA (OLIVEIRA et al., 2008).
Another technique widely used in the detection
of landscape changes is the isotopic analysis of soil C
compartments. The organic matter decomposition
process shows that there is practically no change in the
δ
13C signal between the source material and the soil
organic matter (MOS). Thus, based on the analysis of
variation in abundance of
δ
13C, it is possible to identify
the origin of MOS. In this way, the isotopic determinations
of the natural abundance of
δ
13C of the MOS are being
used as an indicator of the pre-existing vegetation type,
and of the modifications that an area has undergone in
the past (SALIMON et al., 2007; COUTINHO et al.,
2010; GUARESCHI et al., 2012; LOSS et al., 2014).
Thus, the aim of this study was to characterize
the organic matter and quantify its stocks in areas under
secondary forests and grassland in hill environments in
the municipality of Pinheiral (RJ).
MATERIAL AND METHODS
The study was conducted at the municipality of
Pinheiral, state of Rio de Janeiro, in the Middle Paraíba
Fluminense region, sub-basin of the Cachimbal river,
which comprises the basin of the Paraíba do Sul River,
located at 22°29’03’’ and 22°35’27”S and 43°54’49’’W
and 44°04’05’’W.
According to the Köppen climate classification,
the climate was identified in two different ways in Cwa
- temperate climate with dry winter and rainy summer,
and Am - tropical rainy climate with dry winter. Data
from the old weather station of Piraí, indicate that
the region has an annual rainfall around 1300 mm and
average annual temperature of 21°C.
The region is inserted into the ecological dominance
of the Atlantic Forest, whose original vegetation is called
Submontane Semideciduous Seasonal Forest, with
characteristic of areas with altitudes between 300 and 800
meters. The current dominant vegetation in the region
consists of grasslands, implemented and not managed
spontaneous vegetation, which are at several degradation
stages, level of use and / or abandonment, giving rise to
other forms of vegetation in the area, such as abandoned
pastures and brushwood at different succession stages.
The predominant soils on the slopes are Typic Haplustults,
Typic Haplustox and Typic Dystrocryepts.
To characterize the organic matter contents and
carbon storage, areas with different succession stages were
selected, which were inserted in an Atlantic Forest remnant
with about 190 ha. For purposes of statistical comparison
of the areas to be studied, they should be in the same slope
position (upper third), located under the same soil and
climatic conditions such as slope position (exposure face
and slope) and soil class (Typic Dystrocryepts).
From this analysis, secondary forest areas were
selected, which had their vegetal coverage classified into
of regeneration) and a mixed managed pasture (MMP).
A plot of a 20 x 20m was delimited in each area, opening
fi ve trenches up to one meter of depth, where soil samples
were collected (with the aid of a kopeck ring) and deformed
at regular intervals of 10 cm up to 100 cm deep. After
collected, the samples were taken to the laboratory, being
air dried and harrowed, resulting in the air-dried fi ne soil
(ADFS), material on which the analyses were carried out.
Total organic carbon contents were
determined by oxidizing organic matter with
potassium dichromate in a sulfuric acid medium and
titration with ammonium ferrous sulfate 0.1 mol.L
-1,
as recommended by (DONAGEMA et al., 2011).
The organic matter grain size fractionation was
determined only in samples from the fi rst three layers
(0-10, 10-20 and 20-30 cm). The method described by
(CAMBARDELLA; ELLIOTT, 1992) was adopted, where,
as the fi rst stage, approximately 20 g of soil and 70 ml of
sodium hexametaphosphate (5 g.L
-1) were homogenized
for 15 hours in horizontal shaker. Then, the suspension
was sieved through 53 mm sieve with the aid of water
jet. The material retained in the sieve, which consists of
particulate organic matter, was dried in an oven at 50°C,
measuring the mass, and being ground in a porcelain
mortar and analyzed in relation to the organic matter
content. The carbon associated with minerals was
calculated as the difference between total organic carbon
and particulate organic carbon contents (> 53 mm).
The quantitative extraction and fractionation of
humic substances was carried out according to differential
solubility technique established by the International
Humic Substances Society. The organic carbon contents
of fulvic acids (C-FAF), humic acids (C-FAH) and humin
fractions (HUM-C) were quantifi ed. The C-FAH/C-FAF
and C-AL/C-HUM ratios were calculated, as well as
the percentage of each fraction in relation to the total
organic carbon (TOC), as %FAF, %FAH, %HUM.
Samples were collected at regular intervals
from 10 cm to 100 cm of depth and sent to the Stable
Isotope Laboratory of the Center for Nuclear Energy in
Agriculture (CENA / USP), where the natural abundance
of
13C was analyzed.
The results obtained with the average of three
replicates were expressed by the relative unit “
δ
”,
determined in relation to international standard PDB
(limestone of Pee Dee formation) according to the
following equation (1), where: R
sampleis the
13C \
12C
isotope ratio and R
standardof the sample and
13C \
12C is the
isotope ratio of the standard.
The contribution of the remaining forest carbon
(C
3) and that introduced by grassland (C
4) in each area was
calculated using the following equations (2) and (3), where:
C
4(%) is the carbon coming from grassland and C
3(%) is
the carbon coming from the forest in the soil of the study
unit to be assessed,
δ
13C represents the
δ
13C values of soil
samples from the area to be assessed,
δ
13Csfas represents
the
δ
13
C of the soil of the secondary forest at advanced
stage (SFAS) and
δ
13C grass represents the
δ
13C of grass
plant material collected in the grassland area (10.16‰).
(1)
(2) (3)
The carbon stock was evaluated at the different
soil layers up to one meter deep. Soil organic carbon
density data, established according to (DONAGEMA,
2011), were used in its determination.
The carbon stock (Cstock) was calculated from
the following expression (4), where Cstock is the carbon
stock (Mg.ha
-1), C indicates the organic carbon content in
the layer evaluated (g.kg
-1), Bd is the bulk density (Mg.m
-3)
and E is the thickness (cm) of the layer under analysis.
(4)
The results were analyzed for normal distribution
of errors (Lillifors test / SAEG 5.0) and homogeneity of
variances (Cochran and Bartlett tests / SAEG 5.0), and
whenever necessary, their logarithmic transformation was
performed for further comparison of mean values using the
Bonferroni T test, using the Sisvar 4.6 statistical program.
RESULTS AND DISCUSSION
In general, the trend of lower bulk density values
for all areas was observed at a depth of 0-10 cm, with an
increase in the lower layers, but with no signifi cant difference
(ANOVA) in depth. The average soil density values ranged
from 1.43 to 1.63 Mg.m
-3in SFIS, 1.29 to 1.63 Mg.m
-3in
SFINS, 1.31 to 1.57 Mg.m
-3in SFAS and 1.41 to 1.65 Mg.m
-3in
MMP, without, however, signifi cant differences (ANOVA) for
these attributes between areas in any of the depths studied.
Similar results are presented in the studies of Coutinho et
al. (2010) and Oliveira et al. (2008), which also did not fi nd
a signifi cant difference for Bd. This pattern may
be due to
the small recovery time of the secondary forest, that is, its
regeneration has not yet been able to reduce the impacts on
the Bd caused by the pasture area that preceded it.
Although no signifi cant differences (ANOVA)
formations, variations in these attributes are associated
with the greater amount of litter found in these areas.
The total organic carbon levels (TOC), particulate
organic carbon (POC) and carbon associated with fi ne
mineral particles (silt and clay) (CAM) are shown in Table 1.
The percentage that these levels represent of the total soil
organic carbon (TOC) (between 15 and 30% for POC and
70 to 85% for CAM) are similar to those found in literature
(OKORE et al., 2007), in studies on soil organic fractions at
different regions of subtropical and tropical climates.
Unlike TOC results, the POC values showed
signifi cant differences only in the surface layer (0-10 cm),
and as the CAM values, they showed no difference in any
of the layers studied. In the 0-10 cm layer, coinciding with
the pattern of TOC values, the highest POC values were
found in soil under secondary forest at intermediate
stage (SFINS), intermediate in those under secondary
forest at initial stages (SFIN) and mixed managed pasture
(MMP) and lower under secondary forest at advanced
stage (SFAS). Comparing the values between areas under
forest cover at different succession stages, the lowest
TOC and POC values were found in the surface layer
(0-10 cm) under SFAS, which can be attributed to the
carbon associated with the vegetal biomass and to the
high decomposition rates of the litter-forming material.
The highest relative alterations (with SFAS as
reference) of POC values in relation to TOC and CAM
stood out (Table 2), confi rming the fi ndings of different
authors (OKORE et al., 2007), who studied the soil organic
matter dynamics in regions of tropical and subtropical
climates and concluded that this fraction (POC), for being
more labile, seems to be more sensitive to the management
or vegetal coverage of soils than the other fractions.
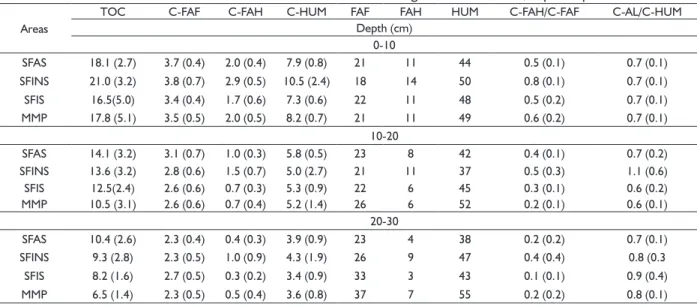
The carbon content of soil organic matter fractions
- carbon of fulvic acid (C-FAF), humic acid (C-FAH) and
humin fractions (C-HUM), their percentages and humic
TABLE 1 Total carbon (TOC) values(1), carbon in particulate
organic carbon fractions (POC) and organic matter associated with silt and clay (CAM) at the different study areas and depths.
Areas(2) TOC POC CAM
g.kg -1 g.kg -1 g.kg -1 % %
Depth (cm) 0-10
SFIS 18.03 ab 4.36 ab 13.67 a 24 76
SFINS 21.01 a 5.81 a 15.20 a 28 72
SFAS 16.45 b 3.73 b 12.72 a 23 77
MMP 17.52 ab 5.29 ab 12.23 a 30 70
10-20
SFIS 14.11 a 2.83 a 11.28 a 20 80
SFINS 13.57 ab 3.44 a 10.13 a 25 75
SFAS 12.48 ab 1.86 a 10.62 a 15 85
MMP 10.49 b 2.38 a 8.11 a 23 77
20-30
SFIS 10.40 a 2.84 a 7.56 a 27 73
SFINS 9.42 ab 2.86 a 6.56 a 30 70
SFAS 8.22 ab 1.41 a 6.81 a 17 83
MMP 6.50 b 1.33 a 5.17 a 21 79
1 Average of fi ve replicates. Values with same letter in column do not differ
through the Bonferroni T test at 5%. 2 Legend: SFIS - secondary forest at initial
stage; SFINS - secondary forest at intermediate stage; SFAS - secondary forest at advanced stage; MMP - mixed managed grassland.
TABLE 2 Total carbon (TOC) values(1), particulate organic carbon (POC) and carbon associated with silt and clay (CAM) at
different areas (2) and depths, with relative alterations (∆) (3). Areas
TOC POC CAM ∆ TOC ∆ POC ∆ CAM
Depth (cm) 0-10
SFAS 16.45 b 3.73 b 12.72 a - - -
-SFINS 21.01 a 5.81 a 15.20 a 4.56 28 2.08 56 2.48 19
SFIS 18.03 ab 4.36 ab 13.67 a 1.58 10 0.63 17 0.95 7
MMP 17.52 ab 5.29 ab 12.23 a 1.07 7 1.56 42 - 0.49 - 4
10-20
SFAS 12.48 ab 1.86 a 10.62 a - - -
-SFINS 13.57 ab 3.44 a 10.13 a 1.09 9 1.58 85 - 0.49 - 5
SFIS 14.11 a 2.83 a 11.28 a 1.63 13 0.97 52 0.66 6
MMP 10.49 b 2.38 a 8.11 a - 1.99 16 0.52 28 - 2.51 - 24
20-30
SFAS 8.22 ab 1.41 a 6.81 a - - -
-SFINS 9.42 ab 2.86 a 6.56 a 1.2 15 1.45 103 - 0.25 - 4
SFIS 10.40 a 2.84 a 7.56 a 2.18 27 1.43 101 0.75 11
MMP 6.50 b 1.33 a 5.17 a - 1.72 - 21 - 0.08 -6 - 1.64 -24
1 Average of fi ve replicates. Values with same letter in column do not differ through the Bonferroni T test at 5%. 2 Legend: SFIS - secondary forest at initial stage; SFINS -
secondary forest at intermediate stage; SFAS - secondary forest at advanced stage; MMP - mixed managed pasture.3 Different letters between EUs have SFAS vales as reference.
acid and fulvic acid fractions ratio (C-FAH/FAF) and
carbon of the alkaline layer and humin (C-AL/C-HUM)
are shown in Table 3.
There were no signifi cant differences (ANOVA)
of humic substances in the three soil layers between the
study areas. However, alterations between fractions,
especially at the surface layer (0-10 cm) were observed.
TABLE 3 Parameters estimates of the omnidirectional and cross semivariograms Vol = volume, Exp = Exponential.
Areas
TOC C-FAF C-FAH C-HUM FAF FAH HUM C-FAH/C-FAF C-AL/C-HUM
Depth (cm) 0-10
SFAS 18.1 (2.7) 3.7 (0.4) 2.0 (0.4) 7.9 (0.8) 21 11 44 0.5 (0.1) 0.7 (0.1)
SFINS 21.0 (3.2) 3.8 (0.7) 2.9 (0.5) 10.5 (2.4) 18 14 50 0.8 (0.1) 0.7 (0.1)
SFIS 16.5(5.0) 3.4 (0.4) 1.7 (0.6) 7.3 (0.6) 22 11 48 0.5 (0.2) 0.7 (0.1)
MMP 17.8 (5.1) 3.5 (0.5) 2.0 (0.5) 8.2 (0.7) 21 11 49 0.6 (0.2) 0.7 (0.1)
10-20
SFAS 14.1 (3.2) 3.1 (0.7) 1.0 (0.3) 5.8 (0.5) 23 8 42 0.4 (0.1) 0.7 (0.2)
SFINS 13.6 (3.2) 2.8 (0.6) 1.5 (0.7) 5.0 (2.7) 21 11 37 0.5 (0.3) 1.1 (0.6)
SFIS 12.5(2.4) 2.6 (0.6) 0.7 (0.3) 5.3 (0.9) 22 6 45 0.3 (0.1) 0.6 (0.2)
MMP 10.5 (3.1) 2.6 (0.6) 0.7 (0.4) 5.2 (1.4) 26 6 52 0.2 (0.1) 0.6 (0.1)
20-30
SFAS 10.4 (2.6) 2.3 (0.4) 0.4 (0.3) 3.9 (0.9) 23 4 38 0.2 (0.2) 0.7 (0.1)
SFINS 9.3 (2.8) 2.3 (0.5) 1.0 (0.9) 4.3 (1.9) 26 9 47 0.4 (0.4) 0.8 (0.3
SFIS 8.2 (1.6) 2.7 (0.5) 0.3 (0.2) 3.4 (0.9) 33 3 43 0.1 (0.1) 0.9 (0.4)
MMP 6.5 (1.4) 2.3 (0.5) 0.5 (0.4) 3.6 (0.8) 37 7 55 0.2 (0.2) 0.8 (0.1)
1 Average of five replicates. Values with same letter in column do not differ through the Bonferroni T test at 5%. 2 Legend: SFIS - secondary forest at initial stage; SFINS
- secondary forest at intermediate stage; SFAS - secondary forest at advanced stage; MMP - mixed managed pasture.
The analysis of the carbon content of humic
substances in the four areas and layers studied indicates
predominance of the humin fraction (37-50%) on C-FAF
(18 to 37%) and C-FAH (3 to 14%) fractions, with
C-FAF presenting percentages greater than C-FAH. In
Rhodic Hapludox under continuous
Brachiaria decumbes
pasture in the city of Maracajú - MS (FONTANA et al.,
2006) found predominance of humin and higher C-FAH
values compared to C-FAF.
Only the humin fraction showed higher and
significant values in forest areas compared to grassland
area in three layers evaluated and the humic acids fraction
in the 10-20 cm layer.
The predominance of the humin fraction can be
attributed to the low solubility and resistance to biological
degradation due to the formation of metal complexes
and to the constant input of organic material and less
human interference (FONTANA et al., 2006; EBELING
et al., 2011) characteristic of the systems studied.
The low and similar values of the C-AL/C-HUM
ratio confirm the predominance of the humin fraction
(more resistant) compared to fulvic and humic acid
fractions in the three layers of the four areas. The low
and similar values of the C-FAH/C-FAF ratio confirm the
higher percentage of fulvic acids on humic acids, which may
indicate that systems of the different areas are, similarly,
favoring the degradation of more stable fractions or even
impairing their formation (FONTANA et al., 2006).
The total carbon stock values in the different
soil layers at different areas are shown in Table 4. No
significant differences were observed in the carbon
stocks in the first two layers (0-10 and 10-20 cm) of the
different areas. However, significant differences were
found from the 20-30 cm layer, where the lowest values
were observed in MMP when compared to those found
in SFAS, SFINS and SFIS, as well as a tendency of higher
values in SFIS and SFINS, especially at the 20-30 cm layer.
The total soil carbon stock values in the depth
assessed (100 cm) showed an increasing trend from
MMP area (100.53 Mg ha
-1) to SFAS (111.07 Mg ha
-1)
SFINS (127.5 Mg ha
-1) and SFIS areas (132.47 Mg ha
-1).
The carbon stock results when correlated with
total organic carbon (Table 1) allow inferring that the
carbon contribution from the vegetation covers of the
TABLE 4 Carbon stock (Mg.ha-1) values (1) in the different
study areas and depths. Depth
(cm)
Areas (2)
SFIS SFINS SFAS MMP
0-10 25.97 a 26.71 a 21.37 a 25.03 a
10-20 21.48 a 20.05 a 17.45 a 16.03 a
20-30 16.16 a 13.67 ab 12.40 b 10.38 c
30-40 12.69 a 12.74 a 10.12 ab 9.74 b
40-50 11.17 a 10.34 ab 10.09 ab 8.36 b
50-60 10.13 a 9.11 a 9.31 a 6.81 b
60-70 10.08 a 8.72 ab 8.93 ab 7.04 b
70-80 9.17 a 8.17 ab 8.28 ab 5.71 b
80-90 7.91 a 7.19 ab 6.50 ab 5.44 b
90-100 7.81 a 10.18 a 6.62 a 5.94 a
Total 132.47 a 127.50 a 111.07 ab 100.53 b
1 Average of five replicates. Values with same letter in column do not differ
through the Bonferroni T test at 5%. 2 Legend: SFIS - secondary forest at initial
four areas do not differ in the first layers due to the
important contribution of litter provided by the forest
systems and to the abundant and dynamic root system of
grasses in the grassland area. However, the comparison
of the total carbon stock between the four areas has
indicated the importance of the developing secondary
forest formations (SFIS and SFINS) in stocking larger
amounts of carbon in the soil.
In areas under secondary forest in advanced
succession stage (SFAS) and intermediate stage (SFINS),
the d
13C values increased from 0-10 to 10-20 cm layers
(SFINS = -26.7 ‰ to -25.2 ‰ and SFAS = 27.2 ‰ to
-26.5 ‰) leveling off in the other layers up to 100 cm.
Dissimilar patterns are observed in area under secondary
forest in initial stage (SFIS), where there is a decreased
d
13C in depth with a tendency to level off from the 20 to
30 cm layer (from -21.8 ‰ at 0-10 cm to - 23.5 ‰ in 20
to 30 cm) and under managed grassland (MMP), where
the decrease is more significant and reaches greater
depth (from -16.1 ‰ at 0-10, -18.6 ‰ at 10-20, -21.1
‰ at 20-30 and -22.4 ‰ at 30-40 cm). This pattern in
depth, as well as the
δ
13C values, similar to those found
by other authors in Atlantic forest (TARRÉ et al., 2001)
and Amazon areas (MELO, 2003; VIDOTTO et al., 2007)
express the higher influence of C
3photosynthetic cycle
plants in the contribution of organic matter in the soil
surface layers in areas under intermediate and advanced
stages of forest succession and of C
4cycle plants in areas
under initial succession stage and grassland.
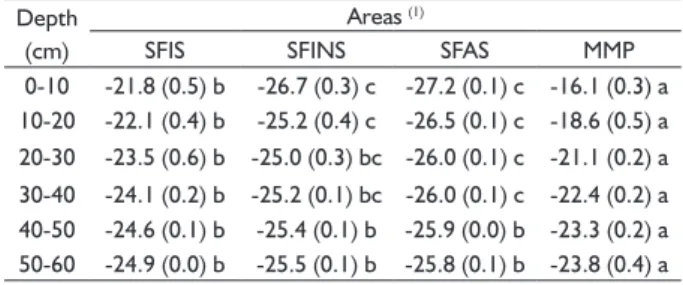
The delta
13C values between the different layers
up to the depth of 60 cm are shown in Table 5. The results
show in the first two layers (0-10 and 10-20 cm) significantly
higher values in MMP, intermediate values in SFIS and lower
values in SFINS and SFAS; in the two subsequent layers
(20-30 and 30-40 cm), a similar behavior, but with greater
tendency to equality between the values found in SFINS,
SFAS and SFIS; and in the last two layers (40-50 and
50-60 cm), the results show a similarity of soil carbon isotope
values between the four areas. These results confirm the
assumption that at the extent that the secondary forest
formations, which are encroaching on abandoned pasture
areas, developed, there is a progressive decrease of d
13C
values in the soil surface layers. This fact is due to the
increased input of organic material from C
3plants (poorer
in
13C) that predominate in the floristic composition of
these formations.
The pattern observed in depth is confirmed by
results of other studies (TARRÉ et al., 2001; MELO,
2003), showing that the most significant alterations of
d
13C values are observed up to the depth of 60 cm, with
a tendency to stabilize in subsequent layers.
TABLE 5 Natural abundance of 13C (1) and respective
standard errors (2) up to the depth of 60 cm in the different areas (3).
Depth (cm)
Areas (1)
SFIS SFINS SFAS MMP
0-10 -21.8 (0.5) b -26.7 (0.3) c -27.2 (0.1) c -16.1 (0.3) a 10-20 -22.1 (0.4) b -25.2 (0.4) c -26.5 (0.1) c -18.6 (0.5) a 20-30 -23.5 (0.6) b -25.0 (0.3) bc -26.0 (0.1) c -21.1 (0.2) a
30-40 -24.1 (0.2) b -25.2 (0.1) bc -26.0 (0.1) c -22.4 (0.2) a 40-50 -24.6 (0.1) b -25.4 (0.1) b -25.9 (0.0) b -23.3 (0.2) a 50-60 -24.9 (0.0) b -25.5 (0.1) b -25.8 (0.1) b -23.8 (0.4) a
1 Average of five replicates. Values with same letter in column do not differ through
the Bonferroni T test at 5%. 2 Legend: SFIS - secondary forest at initial stage; SFINS
- secondary forest at intermediate stage; SFAS - secondary forest at advanced stage; MMGP - mixed managed pasture. (Brachiaria decumbens and Paspalum notatun).
3 Values between parenthesis show the mean standard error of three replicates.
Studying different succession stages of tropical
forests in Costa Rica (SCHEDLBAUER; KAVANAGH, 2008)
found results that confirm those observed in this study. By
using isotope analysis, the authors showed that the increase
in carbon stock from younger succession stages to more
advanced ones was due to the increased contribution of
organic matter by C
3photosynthetic cycle species, which
typically dominate tropical forest formations. The same
authors also emphasized that the onset of the secondary
succession development on abandoned pasture areas leads
to a rapid decrease in
δ13C values, but the continuity of
this development does not significantly change these
values. This finding can be confirmed by the high evolution
of
δ13C data from soil under SFIS to SFINS and to the low
trend of evolution from this to SFAS.
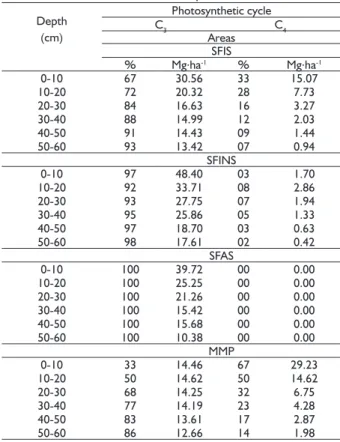
The source of carbon (C
3or C
4cycles) stored in
the soil under the different areas is shown in Table 6.
The study area mixed managed pasture (MMP) has in
the surface layer (0-10 cm) 67% of the total soil carbon
stock coming from C
4photosynthetic cycle plants (29.23
Mg.ha
-1). In subsequent layers, there is a reduction of
this contribution, with a consequent increase in the C
3contribution. The initial succession stage of the forest
on the pre-existing grassland, SFIS, shows in the surface
layer (0-10 cm) a decrease in the contribution of the C
3photosynthetic cycle plants in the amount of carbon in
the soil, represented by 33% (15.07 Mg.ha
-1), which
gradually decreases in depth.
In areas under more mature succession stages (SFAS
and SFINS), the increased contribution of C
3cycle plants
is significant, represented by 97% in SFINS and 100% in
SFAS (reference area), with minor changes in depth.
These results are similar to those found by Melo
(2003) in area under 20 years of
Brachiaria Brizanta
30-recovery processes, especially for the following
indicators: total organic carbon, organic matter stock and
particulate organic matter.
As for the chemical fractionation of soil organic
matter, there were no significant alterations for humic
substances, and prevalence of the humin fraction was found.
The most significant changes in
δ13C values
occurred up to the depth of 60 cm. In the grassland area,
at 0-10 cm, 67% of the carbon stock comes from C
4plants, reducing in the subsequent layers. In SFINS and
SFAS areas, at 0-10 cm, the contribution of C
3plants was
significant, with minor changes in depth.
REFERENCES
ARAÚJO, E. A.; KER, J. C.; MENDONÇA, E. S.; SILVA, I. R.;
OLIVEIRA, E. K. Impacto da conversão floresta - pastagem
nos estoques e na dinâmica do carbono e substâncias húmicas do solo no bioma Amazônico. Acta Amazonica, v.41, n.01, p.103-114, 2011.
CAMBARDELLA, C. A.; ELLIOTT, E. T. Particulate soil organic-matter changes across a grassland cultivation sequence.
Soil Science Society America Journal, v.56, n.01,
p.777-783, 1992.
COUTINHO, R. P.; URQUIAGA, S.; BODDEY, R. M.; ALVES, B. J. R.; TORRES, A. Q. A.; JANTALIA, C. P. Estoque de carbono e nitrogênio e emissão de N2O em diferentes usos do solo na Mata Atlântica. Pesquisa agropecuária
brasileira, v.45, n.02, p.195-203, 2010.
DONAGEMA, G. K.; CAMPOS, D. V. B. de; CALDERANO, S. B.; TEIXEIRA, W. G.; VIANA, J. H. M. (Org.). Manual de
métodos de análise do solo. 2.ed. rev. Embrapa Solos,
2011. 230p. (Embrapa Solos. Documentos, 132).
EBELING, A. G.; ANJOS, L. H. C.; PEREIRA, M. G.; PINHEIRO, E. F. M.; VALLADARES, G. S. Substâncias
húmicas e relação com atributos edáficos. Bragantia, v. 70, n. 1, p.157-165, 2011.
FONTANA, A.; PEREIRA, M. G.; LOSS, A.; CUNHA, T. J. F.; SALTON, J. C. Atributos de fertilidade e frações húmicas de um Latossolo Vermelho no Cerrado. Pesquisa
Agropecuária Brasileira, v.41, n.05. p.847-853, 2006.
GIÁCOMO, R. G.; PEREIRA, M. G.; BALIEIRO, F. C. Estoques de carbono e nitrogênio e distribuição das frações húmicas no
solo sob diferentes coberturas florestais. Revista Brasileira
de Ciências Agrárias, v.03, n.01, p.42-48, 2008.
GUARESCHI, R. F.; PEREIRA, M. G.; PERIN, A. Deposição de resíduos vegetais, matéria orgânica leve, estoques de carbono e nitrogênio e fósforo remanescente sob diferentes sistemas de manejo no cerrado goiano. Revista Brasileira
de Ciência do Solo, v. 36, n.2, p.909-920, 2012.
GUARESCHI, R. F.; PEREIRA, M. G.; ANJOS, L. H. C.; MENEZES, C. E. G.; CORREIA, M. E. F. Atributos químicos e físicos do solo sob pastagem e estádios sucessionais de
floresta estacional. La plata, v.113, n.2, p.01-24, 2014.
TABLE 6 Origin of the carbon stored in soil (1) under the
different areas (2) and depths. Depth
(cm)
Photosynthetic cycle
C3 C4
Areas SFIS
% Mg.ha-1 % Mg.ha-1
0-10 67 30.56 33 15.07
10-20 72 20.32 28 7.73
20-30 84 16.63 16 3.27
30-40 88 14.99 12 2.03
40-50 91 14.43 09 1.44
50-60 93 13.42 07 0.94
SFINS
0-10 97 48.40 03 1.70
10-20 92 33.71 08 2.86
20-30 93 27.75 07 1.94
30-40 95 25.86 05 1.33
40-50 97 18.70 03 0.63
50-60 98 17.61 02 0.42
SFAS
0-10 100 39.72 00 0.00
10-20 100 25.25 00 0.00
20-30 100 21.26 00 0.00
30-40 100 15.42 00 0.00
40-50 100 15.68 00 0.00
50-60 100 10.38 00 0.00
MMP
0-10 33 14.46 67 29.23
10-20 50 14.62 50 14.62
20-30 68 14.25 32 6.75
30-40 77 14.19 23 4.28
40-50 83 13.61 17 2.87
50-60 86 12.66 14 1.98
1 Average of five replicates. Values with same letter in column do not differ through
the Bonferroni T test at 5%. 2 Legend: SFIS - secondary forest at initial stage; SFINS
- secondary forest at intermediate stage; SFAS - secondary forest at advanced stage; MMP - mixed managed pasture. (Brachiaria decumbens and Paspalum notatun).
40 cm, with native forest being considered as reference
area. This study did not consider the contribution of
carbon originated from grassland.
Schedlbauer and Kavanagh (2008) reported that with
increasing time of pasture abandonment and consequent
growth of forest cover, a slow and gradual decrease of the
contribution of soil carbon originated from C
4cycle plants
is expected to occur. However, this behavior was not
observed by these authors in the study that assessed the
origin of forest carbon formed under abandoned pasture in
northeastern Costa Rica, when they found a rapid decrease
in the contribution of C
4cycle plants. On the other hand,
when grassland encroach native forest, there is a progressive
decrease of the forest carbon with the time of land use,
since there is no longer input of organic matter from C
3cycle
plants, while carbon introduced by grassland increases. For
these authors, comparisons between grassland areas indicate
that those formed for longer times show higher proportion
of carbon originating from C
4plants.
CONCLUSIONS
The attributes related to soil carbon showed
LOSS, A.; PEREIRA, M. G.; PERIN, A.; ANJOS, L. H. C. Abundância natural de δ13C e δ15N em sistemas de manejo conservacionista no cerrado. Bioscience Journal, v.30, n.3, p.604-615, 2014.
LOSS, A.; PEREIRA, M. G.; SCHULTZ, N.; ANJOS, L. H. C.;
SILVA, E. M. R. Quantificação do carbono das substâncias
húmicas em diferentes sistemas de uso do solo e épocas de avaliação. Bragantia, v. 69, n.04, p. 53-62, 2010.
MACEDO, M. O.; RESENDE, A. S.; GARCIA, P. C. M.; BODDEY, R. M.; JANTALIA, C. P.; URQUIAGA, S.; CAMPELLO, E. F. C.; FRANCO, A. A. Changes in soil C and N stocks and nutrient dynamics 13 years after recovery of degraded land using leguminous nitrogen-fxing trees. Forest Ecology
and Management, v.255, n.5-6, p.1516-1524, 2008.
MACHADO, R. L.; RESENDE, A. S.; CAMPELLO, E. F. C.; OLIVEIRA, J. A.; FRANCO, A. A. Soil and nutrient losses in erosion gullies at different degrees of restoration. Revista
Brasileira de Ciência do Solo, v.34, n.03, p.945-954, 2010.
MELO, A. W. F. Avaliação do estoque e composição
isotópica do carbono do solo no Acre. 2003. 73p.
Thesis. Universidade de São Paulo – Escola Superior de Agricultura “Luiz de Queiroz”, Piracicaba.
MELLONI, R.; MELLONI, E. G. P.; ALVARENGA, M. I. N.; VIEIRA, F. B. N. Avaliação da qualidade de solos sob
diferentes coberturas florestais e de pastagem no sul de
Minas Gerais. Revista Brasileira de Ciência do Solo, v.32, n.06, p.2461-2470, 2008.
OKORE, I. K.; TIJANI-ENIOLA H.; AGBOOLA, A. A.; AIYELARI, E. A. Impact of land clearing methods and cropping systems on labile soil C and N pools in the humid zone Forest of Nigeria Agriculture. Ecosystems and Environment, v.120, n.2-4, p.250-258, 2007.
OLIVEIRA, C. M.; NAPPO, M. E.; PASSOS, R. R.; MENDONÇA, A. R. Comparação entre atributos físicos e químicos de solo
sob floresta e pastagem. Revista Científica Eletrônica de
Engenharia Florestal, v.02, n.12, p.01-21, 2008.
SALIMON, C. I.; WADT, P. G. S.; MELO, A. W. F. Dinâmica do ta para pastagens em Argissolos da formação geológica Solimões, no sudoeste da Amazônia. Revista de Biologia
e Ciências da Terra, v.7, n.01, p.29-38, 2007.
SANTOS, J. T.; ANDRADE, A. P.; SILVA, I. F.; SILVA, D. S.; SANTOS, E. M.; SILVA, A. P. G. Atributos físicos e químicos do solo de Áreas sob Pastejo na Micro Região do Brejo Paraibano. Ciência Rural, v.40, n.12, p.2486-2492, 2010.
SCHEDLBAUER, J. L.; KAVANAGH, K. L. Soil carbon dynamics in a chronosequence of secondary forests in northeastern Costa Rica. Forest Ecology and Management, v. 255, n.3-4, p.1326-1335, 2008.
TARRÉ, R.; MACEDO, R.; CANTARUTTI, R. B.; REZENDE, C. P.; PEREIRA, J. M.; FERREIRA, E.; ALVES, B. J. R.; URQUIAGA, S.; BODDEY, R. M. The effect of the presence of a forage legume on nitrogen and carbon levels in soils under Brachiaria pastures in the Atlantic forest region of the South of Bahia, Brazil. Plant and Soil, v.234, n.01, p.15– 26, 2001.
VIDOTTO, E.; PESSENDA, L. C. R.; RIBEIRO, A. S.; FREITAS,
H. A.; BENDASSOLLI, J. A. Dinâmica do ecótono
floresta-campo no sul do estado do Amazonas no Holoceno,