BREEDING PROGRAMS
Tamanho amostral para avaliação de famílias em programas de melhoramento de batata
Maria Cristina Duarte Rios Diniz1, César Augusto Brasil Pereira Pinto2,
Eduardo de Souza Lambert3
ABSTRACT
Clonal families from a broad genetic base population in the Potato Breeding Program at the Universidade Federal de Lavras (UFLA), Brazil, were used in this trials. Twenty-five families were assessed in a 5 x 5 triple lattice design. Each plot consisted of 30 clones distributed in three rows of ten plants. Tuber yield per plant, percentage of large tubers, mean weight of large tubers, mean medium-sized tuber weight and tuber specific gravity were measured. Three hundred experiments were simulated varying the family sizes from three to 90 clones. The coefficients of experimental variation (CVe), the coefficients of genetic variation (CVg), heritabilities for family mean and the CVg/CVe ratio were estimated. Genetic parameters were stabilized with family sizes as small as six clones, depending on the trait. This indicates that the families can be adequately represented by a small sample of clones. Using the maximum curvature method it is possible to conclude that approximately 30 clones would be sufficient to represent each family, even for traits with the highest CVe. The genetic variance within family was greater than the genetic variance among families for all traits, indicating a favorable potential for within family selection. The correlation coefficients of the family means with the 5%, 10%, 15% and 20% best clones from each family, considering the five traits assessed, were always high, meaning that within the best families generally are the best clones.
Index terms: Family size, family selection, genetic variance, Solanum tuberosum L.
RESUMO
Foram utilizadas famílias clonais, obtidas pelo programa de melhoramento de batata da UFLA, representando ampla gama de materiais genéticos. Avaliaram-se as 25 famílias no delineamento látice triplo 5 x 5. Cada parcela foi composta por 30 clones distribuídos em 3 linhas de 10 plantas. Foram avaliadas a produção de tubérculos por planta, a porcentagem de tubérculos graúdos, o peso médio de tubérculos graúdos, o peso médio de tubérculos médios e o peso específico de tubérculos. Foram simulados 300 experimentos variando-se o número de clones da cada família de três a noventa. Estimou-se os coeficientes de variação experimental (CVe), os coeficientes de variação genética (CVg), as herdabilidades e relação CVg/CVe. Os parâmetros genéticos se estabilizaram a partir de famílias contendo seis clones, dependendo da característica avaliada. Este resultado indica que a representatividade das famílias pode ser feita com um número pequeno de clones. Empregando-se o método da curvatura máxima sugere-se que as famílias poderiam ser representadas por aproximadamente 30 clones, mesmo para os caracteres com maior CVe. A variância genética dentro de famílias foi maior que a variância genética entre famílias para todos os caracteres, indicando um potencial favorável à seleção dentro de famílias. Os coeficientes de correlação entre as médias das famílias e os 5%, 10%, 15% e 20% melhores clones de cada família, considerando-se as cinco características avaliadas, foram sempre altos, significando que as melhores famílias possuem, de modo geral, os melhores clones.
Termos de indexação: Tamanho de família, seleção de famílias, variância genética, Solanum tuberosum L.
(Received: january 27, 2005; accepted: january 17, 2006)
1Agronomist. DS, Faculdades Novos Horizontes, Belo Horizonte, MG Brazil. 2
INTRODUCTION
The potato (Solanum tuberosum L.) is a vegetatively propagated specie and the breeding programs for this crop aim to produce superior clones. These programs start with hybridizations among different pairs of parents or polycrossings to obtain true seeds from which the various clones are then derived. The clones are selected visually in the first generations for traits with high heritability, such as tuber shape and eye depth and the undesirable clones are discarded (SCHAALJE et al., 1987). Early visual selection reduces the number of clones to be assessed in
later generations but even though the large number of clones hinders the use of experimental designs appropriate for assessing many treatments, such as the incomplete blocks designs.
DINIZ, M. C. D. R. et al. 278
genetic information is available from family means. He found higher phenotypic rather than genotypic coefficients of variation for all characters in all generations, but most of them varied from low to moderate magnitude and altered with generations. In other study Gopal (2001b) estimated higher within family standard deviation than between families standard deviation for all characters and all generations, going against the theoretical expectation that the two variances should be of similar size. One advantage for family selection is that families could be assessed with the greatest experimental accuracy because of replications. Moreover, families could be evaluated in many environments and genotype x environment interaction assessed. From these evaluations broad adaptation families could be selected to give higher genetic gains (JACKSON & MCRAE, 1998).
One problem faced by potato breeders is to set the plot size necessary to estimate genetic parameters with the greatest accuracy and the minimum number of plants that should be used to represent accurately the families that are being assessed.
There are several factors that affect experimental accuracy, such as soil heterogeneity, genetic material and the management system (GOMEZ & GOMEZ, 1984; LE CLERG, 1967). There are few studies on dimensioning family size in potato breeding, thus the aim of this study was to determine suitable family sizes for better genetic parameter estimation and to compare family selection and clone selection to ascertain the viability of these selection strategies.
MATERIAL AND METHODS
The experiment was carried out in the experimental area of the Departamento de Biologia at the Universidade Federal de Lavras, using 25 clonal families, representing a wide range of genetic materials, including crosses with Solanum tuberosum L., S. tuberosum ssp andigena (Juz & Bukasove) Hawkes and S. chacoense Bitter.
Seeds were sown on plastic trays and transplanted later to pots. Mini-tubers were obtained at this stage and then were multiplied in the field to standardize the seed-tubers used in this study (first clonal generation). Each family was represented by 90 randomly taken clones and was assessed in a 5 x 5 triple lattice design. Plots consisted of three rows with ten plants spaced at 0.50 m x 0.70m. Each replication had 30 different clones, totaling the 90 clones per family. Three hundred and thirty experiments were then simulated considering family sizes ranging from three to 90 plants (i.e., from one to 30 plants per plot).
Plants were harvested separately, totaling ten samples per row and 30 samples per plot. Data were recorded for total tuber yield per plant (g); percentage of large tubers (transversal diameter > 45 mm); mean weight of large tubers; mean weight of medium-sized tuber (g) (transversal diameter in between 45mm and 33 mm); and tuber specific gravity. Analyses were performed using SAS to obtain among families genetic variance, within families genetic variance, the coefficient of experimental variation (CVe), the coefficient of genetic variation (CVg), heritability of family means (h2) and their respective confidence interval.
After obtaining all the parameters the ideal number of clones per family was determined by the maximum curvature method (FEDERER, 1955), which involved the coefficient of experimental variation (CVe) and the number of clones per family.
At the same time and in an area close to the experiment three plots with the Monalisa cultivar were also set up. Different plot sizes were simulated from these three plots varying from one to 30 plants, in the same manner that was performed to simulate the 330 different experiments already mentioned. From the different plot sizes there were estimated the environmental variances among plants within the plots. The selection index of Mulamba & Mok (1978) was estimated to rank the families and the clones.
RESULTS AND DISCUSSION
estimates were also quite variable, and their lowest value, on average was estimated for tuber yield per plant (h2 = 0.8080) whereas its greatest value, also on average,
was for tuber specific gravity (h2 = 0.8803). These values
are in line with other values already reported for this specie. The means for all traits presented little variation through the 330 simulations, not exceeding, in any situation, 5% of the mean value of all analyses. For all traits, the CVe were much higher when only one clone/plot was used. Starting from two clones/plot, the CVe came close to the mean value of all analyses. Unlike the CVe, the CVg tended to be lower with one clone/plot.
The ratio between the CVg/CVe presented very low values when only one clone/plot was used, inferring that selection would be less efficient in this condition.
Broad sense heritability was also lower and its standard errors (s(h2)) were greater when only one clone/
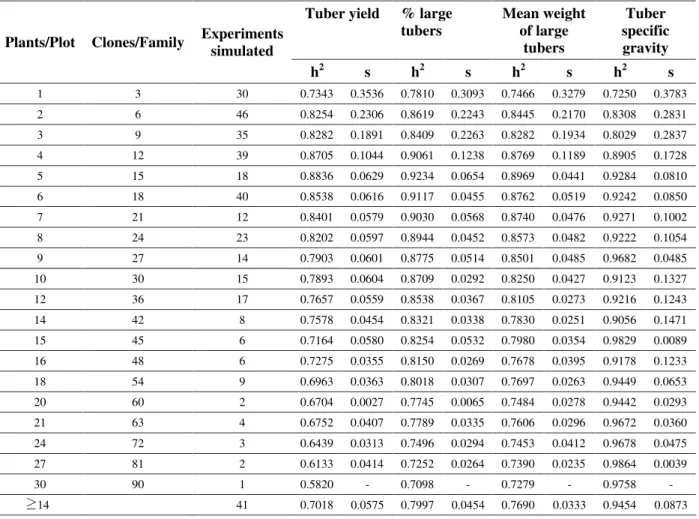
plot was used. Considering a higher number of clones/ plot the heritabilities came close to the mean value of all analyses. Table 1 shows the heritabilities and standard deviations for all traits assessed using different numbers of plants per plot. In general, standard deviations dropped to low values with plots having just five to seven plants (15 21 clones per family). Thereafter, standard deviations were kept almost constant, and even when 41 experiments with plots larger than 14 plants were simulated, heritabilities and standard deviations were about equal to those obtained with smaller plots. These results show that increasing plot size does not allow more accurate estimates of the heritabilities.
TABLE 1 Heritabilities (h2) and standard deviations (s) for tuber yield, percentage of large tubers, mean weight of
large tubers, and tuber specific gravity estimated from simulated experiments with different numbers of plants per plot. Tuber yield % large
tubers
Mean weight of large
tubers
Tuber specific gravity Plants/Plot Clones/Family Experiments
simulated
h2 s h2 s h2 s h2 s
1 3 30 0.7343 0.3536 0.7810 0.3093 0.7466 0.3279 0.7250 0.3783
2 6 46 0.8254 0.2306 0.8619 0.2243 0.8445 0.2170 0.8308 0.2831
3 9 35 0.8282 0.1891 0.8409 0.2263 0.8282 0.1934 0.8029 0.2837
4 12 39 0.8705 0.1044 0.9061 0.1238 0.8769 0.1189 0.8905 0.1728
5 15 18 0.8836 0.0629 0.9234 0.0654 0.8969 0.0441 0.9284 0.0810
6 18 40 0.8538 0.0616 0.9117 0.0455 0.8762 0.0519 0.9242 0.0850
7 21 12 0.8401 0.0579 0.9030 0.0568 0.8740 0.0476 0.9271 0.1002
8 24 23 0.8202 0.0597 0.8944 0.0452 0.8573 0.0482 0.9222 0.1054
9 27 14 0.7903 0.0601 0.8775 0.0514 0.8501 0.0485 0.9682 0.0485
10 30 15 0.7893 0.0604 0.8709 0.0292 0.8250 0.0427 0.9123 0.1327
12 36 17 0.7657 0.0559 0.8538 0.0367 0.8105 0.0273 0.9216 0.1243
14 42 8 0.7578 0.0454 0.8321 0.0338 0.7830 0.0251 0.9056 0.1471
15 45 6 0.7164 0.0580 0.8254 0.0532 0.7980 0.0354 0.9829 0.0089
16 48 6 0.7275 0.0355 0.8150 0.0269 0.7678 0.0395 0.9178 0.1233
18 54 9 0.6963 0.0363 0.8018 0.0307 0.7697 0.0263 0.9449 0.0653
20 60 2 0.6704 0.0027 0.7745 0.0065 0.7484 0.0278 0.9442 0.0293
21 63 4 0.6752 0.0407 0.7789 0.0335 0.7606 0.0296 0.9672 0.0360
24 72 3 0.6439 0.0313 0.7496 0.0294 0.7453 0.0412 0.9678 0.0475
27 81 2 0.6133 0.0414 0.7252 0.0264 0.7390 0.0235 0.9864 0.0039
30 90 1 0.5820 - 0.7098 - 0.7279 - 0.9758 -
DINIZ, M. C. D. R. et al. 280
When the statistical parameters were assessed taking into account the mean number of rows per plots (1, 2 or 3), it was ascertained that for most traits, the increase in the number of rows (clones/plot) resulted in a small increase in the CVe whereas the CVg, heritability and the CVg/CVe ratio were reduced. The only exception to this fact was for tuber specific gravity where the CVe were reduced and the heritabilities increased with the increase in the number of rows (clones/plot).
The heritabilities and their confidence intervals varied among traits ranging from 0.5802 to 0.7961 for tuber
0 10 20 30
0 3 6 9 12 15 18 21 24 27 30
Number of clones per plot
C
V
e
yield per plant and from 0.9758 to 0.9882 for tuber specific gravity. When the heritability was higher, the interval between the lower and upper limits was smaller.
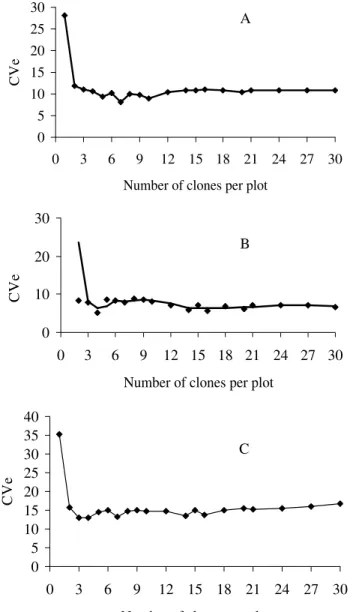
The ideal number of clones per family, obtained by the maximum curvature method, varied depending on the trait. For example, for tuber yield per plant, the ideal number of clones per family was 9, that is, three clones per plot in this study. For the other traits, we estimated 7 clones per family for the mean weight of large tubers, 9 clones per family for tuber yield per plant and 36 clones per family for the percentage of large tubers (Figures 1A, 1B, 1C).
0 5 10 15 20 25 30
0 3 6 9 12 15 18 21 24 27 30
Number of clones per plot
C
V
e
0 5 10 15 20 25 30 35 40
0 3 6 9 12 15 18 21 24 27 30
Number of clones per plot
C
V
e
FIGURE 1 Relationship between the coefficient of experimental variation (CVe) and the number of clones per plot for mean weight of large tubers (A), percentage of large tubers (B) and tuber yield per plant (C).
A
B
Sample size for family evaluation in potato... 281
Great environmental variations within the plots were observed even when the number of clones per family was increased. However the within families genetic variance was always greater than the among family genetic variance for all traits. This may be due to the fact that the families assessed in the present study had been obtained from crossing clones of wide origins.
In the mean of all analyses performed, the genetic variance for tuber yield was 4.5 fold greater within family compared to the variance among families. The superiority was 3.9 fold for the percentage of large tubers, whereas for the mean weight of large tuber it was 2.9 fold, for mean medium-sized tuber weight it was 10.5 fold and for tuber specific gravity it was 2.9 fold greater. These results contrast with Simmonds (1996) theoretical predictions who suggested that the within and among family variances would be the same magnitude. On the other hand, the results presented here are in line with studies by Bradshaw et al. (1998) and Gopal (2001b) who ascertained that the within family variances were always greater than the among family variances for all the 14 traits assessed by the first author and for the four traits assessed by the second author. A possible explanation for the results of these authors is that Simmonds (1996) theory presupposes Hardy-Weinberg populations. However potato populations are not regularly in equilibrium (BRADSHAW et al., 1998).
To assess whether among family selection would be efficient, correlation coefficients were estimated among the family means and the best clones from each family, at selection intensities of 5% (mean of the 5 best clones from each family), 10% (mean of the 9 best clones from each family), 15% (mean of the 14 best clones from each family) and 20% (mean of the 18 best clones from each family) (Table 2). For tuber yield per plant, the coefficients of correlation ranged from 0.75 to 0.89, whereas for tuber specific gravity, the correlations ranged from 0.29 to 0.41. Also, the correlation coefficient between family s means and the number of selected clones within families was 0.78 for tuber yield. These results show that, in general, the best clones are found within the best families and that family selection should be a reasonable alternative for potato breeding. However, it should be noticed that this strategy can represent loss of some good-performance clones within families of moderate performance.
TABLE 2 Correlation coefficients between family means and the best 5%, 10%, 15%, or 20% clones within families.
Selection intensity Traits
5% 10% 15% 20%
Tuber yield 0.7504 0.7923 0.8563 0.8888 Percentage of
large tubers
0.2611 0.5747 0.7243 0.7931 Mean weight
of large tubers
0.6638 0.7245 0.7524 0.7171 Tuber specific
gravity
0.2858 0.3432 0.3935 0.4142
CONCLUSIONS
a) The estimates of the coefficients of experimental variation (CVe), coefficients of genetic variation (CVg), heritability and the CVg/CVe ratio were stabized from 2 clones per plot, that is, 6 clones per family, inferring that the families can be adequately represented by a small number of clones;
b) By the maximum curvature method, the families could be represented by approximately 30 clones regardless of the trait under selection;
c) Genetic variances within families were greater than among families for all traits, indicating a better potential for within family selection;
d) Correlation coefficients of family means with the best 5%, 10%, 15% or 20% clones from each family were generally high, indicating that the best clones lie within the families with high-means.
REFERENCES
BRADSHAW, J. E.; DALE, M. F. B.; SWAN, G. E. L.; TODD, D.; WILSON, R. N. Early-generation selection between and within crosses in a potato (Solanum tuberosum subsp tuberosum)breeding programme. Theorical and Applied Genetics, New York, v. 97, n. 8, p. 1331-1339, Dec. 1998.
FEDERER, W. T. Experimental design: theory and application. New York: Macmillan, 1955. 590 p.
DINIZ, M. C. D. R. et al. 282
GOPAL, J. Genetic parameters and character association for family selection in potato breeding programmes. Journal of Genetics and Breeding, Rome, v. 55, p. 201-208, 2001a.
GOPAL, J. Between and within families variation and family selection in potato breeding programmes. Journal of Genetics and Breeding, Rome, v. 55, p. 313-318, 2001b.
JACKSON, P. A.; McRAE, T. A. Gains from selection of broadly adapted and specifically adapted sugarcane families. Field Crops Research, Amsterdam, v. 59, p. 151-162, 1998.
LE CLERG, E. L. Significance of experimental design in plant breeding. In: ______. Plant breeding. Ames: Iowa State University, 1967. p. 45-57.
MULAMBA, N. N.; MOK, J. J. Improvement of yield potential of the Eto Blanco maize (Zea mays L.)
population by breeding for plant traits. Egyptian Journal of Genetics and Citology, Alexandria, v. 7, n. 1, p. 40-51, 1978.
SCHAALJE, G. B.; LYNCH, D. R.; KOSUB, G. C. Field evaluation of a modified augmented design for early stage selection involving a large number of test lines without replication. Potato Research, Wageningen, v. 30, p. 35-45, 1987.
SIMMONDS, N. W. Family selection in plant breeding. Euphytica, Wageningen, v. 90, n. 2, p. 201-208, 1996.