TO CHARACTERIZE PLASMA MEMBRANE
PROTEINS FROM BANANA ROOTS
Avaliação de quatro estratégias diferentes para caracterizar proteínas da membrana plasmática de raízes de banana
Suzana Antunes Lourençoni Garcia1, Bart Panis2, Rony Swennen1,2,3, Sebastien Christian Carpentier1,4 ABSTRACT
Plasma membrane proteins constitute a very important class of proteins. They are involved in the transmission of external signals to the interior of the cell and selective transport of water, nutrients and ions across the plasma membrane. However, the study of plasma membrane proteins is challenging because of their poor solubility in aqueous media and low relative abundance. In this work, we evaluated four different strategies for the characterization of plasma membrane proteins from banana roots: (i) the aqueous-polymer two-phase system technique (ATPS) coupled to gelelectrophoresis (gel-based), and (ii) ATPS coupled to LC-MS/MS (gel free), (iii) a microsomal fraction and (iv) a full proteome, both coupled to LC-MS/ MS. Our results show that the gel-based strategy is useful for protein visualization but has major limitations in terms of time
reproducibility and efficiency. From the gel-free strategies, the microsomal-based strategy allowed the highest number of plasma membrane proteins to be identified, followed by the full proteome strategy and by the ATPS based strategy. The high
yield of plasma membrane proteins provided by the microsomal fraction can be explained by the enrichment of membrane proteins in this fraction and the high throughput of the gel-free approach combined with the usage of a fast high-resolution
mass spectrometer for the identification of proteins.
Index terms: Aqueous-polymer two-phase system technique, microsomal and full proteome fractions, protein identification.
RESUMO
Proteínas da membrana plasmática constituem uma importante classe de proteínas. Elas estão envolvidas na transmissão de sinais externos para o interior da célula e no transporte seletivo de nutrientes/ions, através da membrana plasmática. Porém, o estudo dessas proteinas é difícil, porque elas são poucoabundantes e apresentam baixa solubilidade em tampões aquosos. Neste trabalho, nós avaliamos quatro estratégias diferentes para extrair proteínas da membrana plasmática de raízes de banana: (i) a técnica de sistema aquoso de duas fases, constituída porpolímeros(ATPS) combinada com eletroforese em gel e (ii) ATPS sem gel usandoLC-MS/MS, (iii) uma fração microssomal e (iv) uma fração, contendo o proteoma total celular, ambas as frações avaliadas via LC-MS/MS. Nossos resultados mostram que a estratégia baseada em eletroforese em gel é útil para a visualização de proteínas, mas apresenta limitações
em termos de reproducibilidade e eficiência. Dentre as estratégias sem o uso de gel, a fração microssomal permitiu a identificação
do maior número de proteínas de membrana plasmática, seguida pela fração de proteoma total e pela técnica de sistema aquoso de duasfases. O alto rendimento de proteínas de membrana plasmática proporcionado pela fração microssomal pode ser explicado pelo
enriquecimento de proteínas de membrana nessa fração e pela eficiência do espectrômetro de massa na identificação de proteínas.
Termos para indexação: Sistema aquoso de duas fases, frações microssomal e de proteoma total, identificação de proteínas.
1Division of Crop Biotechnics – KU Leuven – Leuven – Belgium 2Bioversity International – Leuven – Belgium
3IITA – Arusha – Tanzania
4Facility for Systems Biology based Mass Spectrometry – KU Leuven – Leuven – Belgium – [email protected]
Received in may 29, 2014 and approved in july 30, 2014 INTRODUCTION
Plants are constantly exposed to environmental changes. The plasma membrane constitutes a selective barrier between the cell and the external environment. At the plasma
membrane, proteins are located that regulate the traffic/
transport of water and nutrients/ions in and out of the cells. Others are also involved in the transmission of extracellular
signals and thus play a crucial role in cell signaling. Therefore,
the identification and characterization of plasma membrane
proteins are of utmost importance for understanding at the molecular level plant responses towards external factors.
Roots are the first organ to sense the lack of soil water and
to adapt for a better water uptake and retention.
abundance of plasma membrane proteins compared to soluble/cytosolic proteins (Nilsson, et al., 2010).
Furthermore, integral plasma membrane proteins
exhibit a very poor solubility in an aqueous buffer due to the presence of hydrophobic transmembrane
domains (TMD). This leads to protein aggregation and precipitation affecting protein isolation efficiency and enzymatic digestion for protein identification (Speers;
Wu, 2007) making the characterization of these proteins challenging. Therefore the characterization of plasma membrane proteins requires an efficient protocol
to isolate a sufficient quantity of plasma membrane
proteinswith high purity.
Several techniques were developed for the isolation of plasma membranes such as sucrose gradient centrifugation (Valotet al., 2005), cationic colloidal
silica (Chaney; Jacobson, 1983), biotinylation (Elia, 2008), glycosylation (Ghoshet al., 2004) and affinity
purification.
One of the most used techniques for the isolation of plasma membrane proteins is the aqueous-polymer two-phase partitioning first described by Larsson
(1985). The development of this technique was based
on the observation that two phases are formed when two structurally different water-soluble polymers are mixed
above a certain concentration. PEG and dextran are the most used polymers, being the upper phase rich in PEG and the lower phase rich in dextran (Schindler; Nothwang,
2006). In addition to these polymers, also sucrose, buffers and salts are added to the aqueous two-phase system to create a suitable tonicity, pH and ion strength. Once the two phases are settled, a microsomal fraction, which consists of membrane vesicles from different origin, is added to the
aqueous-polymer two-phase system (Larsson, 1985). The
membrane vesicles are formed after cell disruption by an osmotic shock, ultrasonic vibration, or blending and pieces of plasma membranes and endomembranes are resealed into vesicles (Albertset al.,2002).
The membrane vesicles added to an aqueous-polymer two-phase system will partition between the upper phase, interphase and lower phase based on their
affinity to the hydrophobic PEG upper phase. The affinity to the PEG phase is determined by the lipid composition
and distribution across the membrane bilayer. The plasma
membranes have the highest affinity for the hydrophobic PEG phase, therefore they will preferentially partition into the upper phase followed by the Golgi apparatus,
lysosomes, endoplasmatic reticulum and mitochondria
(Rito-Palomares, 2004) (Schindler; Nothwang, 2006).
However, knowledge of the mechanism of protein
partitioning into an aqueous-polymer two-phase system is still limited.
T h e l i p i d c o m p o s i t i o n o f t h e p l a s m a membranes distinguishes from the lipid composition of the endomembranes especially by its enrichment in sphingolipids, phosphatidylserine and cholesterol.
Furthermore, the plasma membranes possess a clear
asymmetric arrangement, with the exoplasmic phase rich in glycosphingolipids and phosphatidylcholine and the cytoplasmic face rich in phosphatidylserine and
phosphatidylethanolamine (Zachowski, 1993). This
may be one of the reasons why the plasma membranes
present the highest affinity for the hydrophobic PEG
upper phase.
To obtain a high enrichment of the plasma membranes in the upper phase, and the endomembranes at the interphase and lower phase, the polymer and salt concentrations should be composed in a systematic
way. Larsson (1985) reported for membrane vesicles
extracted from wheat roots that an increase in the polymer concentration from 5.5% to 7.7% (w/w) and potassium chloride (KCl) from zero to 5 mM decreased the amount of endomembranes into the upper phase while the concentration of the plasma membranes was maintained high. However, the surface membrane properties may vary between species and tissues, therefore, this technique needs
to be optimized for every species and tissue (Schindler;
Nothwang, 2006).
Aqueous-two-phase systems have a wide range of
applications. It goes from purification of pharmaceutics
(Harris et al., 2007) and therapeutic proteins (Asenjoet al., 2012), to isolation of proteins from bacteria (Lutwycheet al.,1995) animals (Gierowet al., 1986; Boland et al., 1991)
and plants. In plants, the aqueous two-phase system has been
mostly used for protein isolation from Arabidopsis (DeWitt et al., 1996; Borneret al., 2003). However it has been used for isolating plasma membrane proteins from oat (Widell; Lundborg; Larsson 1982), tobacco (Platis; Nikolaos; Labro, 2006), orchidgrass (Yoshida; Uemura,1984), sweet potato (Srinivas; Rashmi; Raghavarao,1999) and banana leaves
(Vertommenet al., 2011).
This is the first study applying the aqueous-polymer
two-phase system technique to isolate plasma membrane proteins from banana roots. We tested four different polymer concentrations to assess the enrichment of plasma membrane proteins in the upper phase.
We evaluated four different strategies for the
identification of plasma membrane proteins from banana
MATERIAL AND METHODS Extraction of the full proteome
Roots (0,3g) of the banana cultivar Cachaco (ITC0643) cultivated in a hydroponic nutrient solution consisted of 350 mM KNO3, 69 mM K2SO4, 71 mM MgSO4.7H2O, 89 mM MgCl2.6H2O, 3.68 mM H3BO3,
3.19 mM MnSO4.H2O, 0.186 mM ZnSO4.7H2O, 0.128 mM CuSO4.5H2O, 0.031 mM NaMo4.2H2O, 142.7 mM KH2PO4, 255.42 mM NaH2PO4, 196.28 mM Ca(NO3)2.4H2O, 71.42 mM CaCl2.2H2O, sequestrene 12 gL-1, pH 6.0 were crushed in liquid nitrogen using a mortar and pestle. The grounded tissue was mixed with 750 µl
buffer extraction containing 5 mM EDTA, 100 mM KCl, 1% dithiothreitol (DTT), 30% sucrose, one mini tablet of protease inhibitor (Roche) and 100 mM Tris-HCl pH 8.3, and vortexed for 30 sec. Subsequently, 750 µl buffered phenol containing 1% bromophenol blue and 50mMtris-base were added and the sample was vortexed for 10 min at 4° C. The sample was centrifuged for 10 min at 12,000 rpm at 4° C and the phenolic phase was collected. An equal volume of the extraction buffer was added to the collected phenolic phase. The sample was then centrifuged for 5 min at 12,000 rpm at 4°C and the phenolic phase was re-extracted. The volume extracted from the phenolic phase was mixed for protein precipitation overnight at -20° C with 5 volumes of methanol solution containing 100 mM ammonium acetate. The sample was centrifuged for 60
min at 13,000 rpm at 4° C, the supernatant was removed
and the pellet rinsed with 2 ml of cold acetone containing
0.2% DTT. The sample was incubated into the rinsing
solution for 1 hour at -20° C followed by a centrifugation
step of 30 min, at 13,000 rpm at 4° C. The supernatant
was removed and the pellet was dried under the hood. The pellet was resuspended in 50 µl of lysis buffer containing
8 M urea, 5 mM DDT, 30 mM Tris and the sample was quantified using a 2-D Quant Kit (GE Healthcare). Twenty microgram proteins were treated with 0.02 M DTT for 15 min, followed by 30 min darkness incubation in the
presence of 0.05 M iodoacetamide (IAA) and diluted in
3 volumes of ammonium bicarbonate (ABC) 0.05M. The
protein sample was digested with 0.2 µg trypsin overnight
at 37° C. Finally the sample was acidified in 0.1% of trifluoroacetic acid (TFA). The next steps regarding protein identification are reported in the Sections “Salt removal” and “Mass spectrometry analysis”.
Isolation of membranes vesicles
Roots (200 g) of the banana cultivar Cachaco
(greenhouse plants, ITC0643) were crushed using a cold
kitchen coffee blender and homogenized in 600 mL ice cold homogenization buffer pH 7.0 containing: 50 mM MOPS, 5
mM EDTA, 0.33 M sucrose, complete EDTA-free protease inhibitor cocktail (Roche), 1% DTT (dithiothreitol) and 5 μM ascorbate. Sample heating was prevented by applying short blending strokes. The homogenate was filtered
through 4 layers cloth filter. The cell debris, cell wall
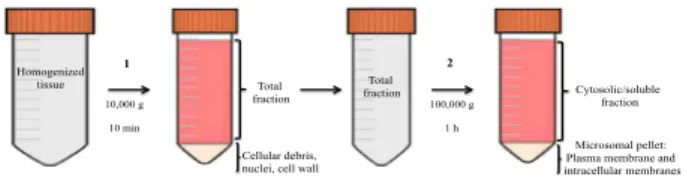
and nuclei were removed by centrifugation at 10,000 g for 10 min at 4°C. The supernatant (= total fraction) was submitted to ultracentrifugation at 100,000 g for 1 hour at 4°C to separate cellular membranes from soluble cellular components. After ultracentrifugation, a microsomal pellet containing plasma membranes and endomembrane
vesicles was obtained. During the centrifugation steps one
milliliter aliquot was collected from the total and soluble fractions for protein precipitation and separation in one
dimension SDS-PAGE gel (Figure 1).
Figure 1 – Centrifugation steps used to obtain the
microsomal pellet: 1) Homogenized Cachaco root tissue was centrifuged at 10,000 g for 10 min to precipitate
cellular debris, nuclei and cell wall; 2) the total fraction
(supernatant) was subsequently centrifuged at 100,000 g for 1 h to separate cellular soluble components from cellular membranes.
Homogenized
tissue Total
fraction
Cellular debris, nuclei, cell wall
Total fraction
Microsomal pellet: Plasma membrane and intracellular membranes
Cytosolic/soluble fraction 10,000 g
10 min
100,000 g 1 h
1 2
Aqueous-polymer two-phase partitioning
The microsomal pellets obtained from 200 g crushed roots were pooled and suspended in 40 mL buffer
containing 0.33 M sucrose, 0.1M EDTA, 1% DTT, protease
inhibitor cocktail and 5 mM potassium phosphate buffered
at pH 7.8. After resuspension of the microsomal fraction,
an aliquot of 200 µL was collected for protein extraction,
precipitation and separation in one dimension SDS-PAGE gel. Four aliquots, each containing nine milliliters of the
microsomal fraction were subsequently applied into four aqueous-polymer two-phase partitioning containing four
different polymer concentrations: 6.2%, 6.4%, 6.8% and 7.2% (w/w) PEG 3350, and 6.2%, 6.4%, 6.8% and 7.2% (w/w) dextran T500 (w/w); and 11% (w/w) sucrose, 5 mM potassium phosphate (pH 7.8), 5 mM KCl and milli-Q water until a final weight of 27 g per system. Each
fraction was shaken followed by centrifugation at 1,800 g
for 5 min at 4° C to enhance phase separation. The upper phase was re-extracted three times. The upper phase and the lower phase were diluted two times in resuspension
buffer containing 0.33M sucrose and 5mMpotassium phosphate buffer pH 7.8, before centrifugation at 100,000
g for 1 hour at 4° C. Non membrane bound proteins were removed by resuspending the obtained pellets with 2 mL
Brij58 buffered at pH 4.0 (150 mM KCl, 1mM EDTA, 0.01%. Brij58, 25 mM sodium acetate). Next, we applied
a new ultracentrifugation round at 150,000 g for 1hour at 4° C. Then the pellets were resuspended and the proteins
extracted from the membrane in SDS buffer 4% (100 mM Tris/ HCl pH 6.8, 4% SDS, 1 % DTT) and stored at -80° C. Protein precipitation
Two hundred microliters of total, soluble and microsomal fractions, and upper and lower phases were
diluted into 1.8 ml of cold acetone solution containing 10% of TCA (trichloroacetic acid) and 0.2% (DTT) for
protein precipitation overnight at -20° C. Subsequently,
the samples were centrifuged at 13,000 rpm for 30 min
at 4° C. The supernatants were discarded and the pellets were washed with 2 ml of cold acetone containing 0.2%
DTT and centrifuged again at 13,000 rpm for 30 min at 4° C. The supernatants were discarded and the pellets were dried under the hood. The proteins were then solubilized
in SDS 4% buffer containing 100 mM HCl pH 7.6 and 0.1 M DTT. The protein concentration was determined using the micro-Bradford protocol (Zuo, Lundahl, 2000).
Protein separation in one dimension SDS-PAGE gel An equal amount of the total, soluble and microsomal fractions, and upper and lower phases were
loaded into a precast NuPAGE® Novex® Bis-Tris Mini gel
(Invitrogen, NuPAGE SYSTEM). The run was performed at 200 V and 17 mA, using the NuPAGE® MOPS Running
Buffer and stopped after 1 hour. For silver staining the
amount of loaded proteins was 1 µg while for Coomassie
Brilliant Blue staining 10 µg was used.
Gel-based protein identification: In-gel protein
digestion
Seventeen protein bands were selected from the
upper fraction 6.4% for protein identification. The gel
bands were excised using a sterile scalpel and transferred to 0.5 mL eppendorf tubes. The protein bands were dehydrated with 100 μl of acetonitrile (ACN), rehydrated with 100 μl of 50 mM ammonium bicarbonate (ABC), and dehydrated again in ACN. These steps of dehydration/
rehydration were performed several times until the bands were completely destained. Afterwards, the bands were dried in a SpeedVac and the proteins from the bands were digested with 0.1 μg/μl trypsin in the presence of 100 μl buffer containing 25 mM ammonium bicarbonate and 10%
ACN. The samples were incubated at 37° C overnight.
Gel-based protein identification
:
Peptide extractionfrom gel
The peptides were extracted from the gel by treating the bands with the following solutions: 50 μl of 5% ACN
and 0.1% formic acid (FA), 50 μl of 10% ACN and 0.1%
FA and 50 μl of 95% ACN and 5% FA. Between each
treatment the samples were vortexed, spinned down,
incubated in a sonicator for 3 min and the supernatants
transferred to new tubes. Thereafter the samples were dried in a SpeedVac. Salt contaminants were removed
from the peptide samples by using a micro scale C18 sample preparation column (ZipTipμC18). Peptides
were solubilized with 10μLof 5% ACN and 0.1% FA.
ZipTipμC18 were attached onto a 10μL pipettor, hydrated five times with 10 μL of 100% ACN and 0.1% FA. Peptides were then loaded by aspirating and dispensing the resuspended digests through the ZipTips at least eight times to ensure maximal binding on the column and salt
removal. Finally, the peptides were eluted by adding 3 μl
of 60% ACN and 0.1% FA to the column. Subsequently,
the samples were gently dried for 2 hour in a vacuum operator and the peptides were dissolved in 10 µl of 0.1%
FA and 5% ACN.
Mass spectrometry analysis used for gel-based
protein identification
The HPLC-MS/MS analysis was performed on
a MicroTof-Q (Bruker). Five microliter of the peptide solution were injected and separated on an Ultimate 3000 (Dionex/Thermo Scientific) machine. The samples were separated using as buffer A: 99.9% MilliQ (MQ) water and 0.1% FA and as B buffer: 99.9% ACN and 0.1% FA. The column used was a Dionex Acclaim Pepmap 100, C18 peptide reverse phase column, 3 µm particle size and 100 Å pore size. Samples were eluted at a flow rate of 0.3
µL/min with a splitter ratio of 1/1000 using a gradient
of 5% to 45% B for 42 min followed by a wash step of 5 min at 95% B ending with a re-equilibration step of 13 min at 5%. The MicroTof-Q was operated in nano-online
positive ion mode with a nanospray voltage of 22 kV
and a source temperature of 130° C. Bruker Daltonics
acquisition (DDA) mode with a survey MS scan at a
resolution of 15,000 for the mass range of m/z 400-1400
for precursor ions, followed by MS/MS scans of the top 3 most intense peaks with +2, +3 and +4 charges ions above a threshold ion count of 3,000 using normalized collision energy (NCE) of 10eV with an isolation window of 3.0 m/z, with a dynamic exclusion of 60s after 3 spectra. All data were acquired with Bruker Daltonics MicrotofControl 3.0. Peak detection and conversion to “mgf”-files was performed using MS Convert from Proteo Wizard 3.0.3631 software, with the following filter: ChargeStatePredictor 4 1 0.9. The mgf -files were submitted to Mascot (version
2.2.04) and a search database was performed using an in-house Musa database (MusaA_B) containing all the protein
sequences of the published A and B genome (D’Hont et al., 2012; Davey et al., 2013), plus contaminant sequences
(trypsin and keratin). Search parameters were set at: tryptic digestion, one miscleavage allowed, 100 ppm precursor
mass tolerance and 0.5 Da for fragment ion tolerance with a fixed modification of cysteine carbamidomethylation and a variable modification of methionine oxidation.
Mascot data were submitted to Scaffold (version 4.1)
to generate a fasta file against the MusaA_B database. The fasta file sequences were annotated via Blas2go
(Conesaet al., 2005) and their likely cellular compartment
was further characterized by GO compartment searches.
In addition, the protein sequences were subjected to the
ARAMEMNON database (Schwackeet al., 2003) to search
for transmembrane domains.
Gel-free protein identification: SDS removal and
protein digestion
Twenty micrograms proteins from the plasma membrane fraction 7.2% (upper phase) and microsomal fraction, both solubilized in 500 µl buffer containing
4% SDS, 1% DTT and 100 mM Tris-HCl pH 7.6 were submitted to Microcon YM-30 filters (Millipore, Billerica, MA, USA) for SDS removal followed by protein digestion. First the plasma membrane and microsomal samples were
mixed with 400 μL of 8 M urea in 0.1M Tris/HCl (pH 8.5)
(i.e. UA buffer) and added to the filters. The filter devices were subsequently centrifuged at 13,000 rpm for 20 min and the flow-through was discarded. Next, the filters were
washed with 200 μL of buffer UA, centrifuged at 13,000
rpm for 20 min and the flow-through was discarded.
Two hundred μL UA buffer containing 20 mM DTT
were added to the filter for 15 min incubation at room temperature followed by centrifugation at 13,000 rpm for 20 min and flow-through removal. Subsequently, 100 μL of UA buffer containing 0.05 M of IAA were added to the
filters. After 30 min of incubation, the filter devices were centrifuged at 13,000 rpm for 20 min and the flow-through
was discarded. Two hundred μL of a buffer containing 8
M urea in 0.1 M Tris/HCl (pH 8.0) (i.e. UB buffer) were added to filters and centrifuged at 13,000 rpm for 20 min and the flow-through were discarded. This step was repeated twice. Forty microliters of UB buffer containing
endoproteinaseLys-C (enzyme-protein ratio of 1:50) were
added into the filters, mixed and incubated overnight at
room temperature. The next day, 120 µl of 40 mM ABC containing trypsin (enzyme-protein ratio 1:100) were
added to the filters followed by incubation for 4 hours at 37° C. After digestion, the filters were centrifuged at 13,000 rpm for 20 min and the flow-through was kept. In
addition, 50 µl of 0.5 M NaCl was added to the filters,
centrifuged (13,000 rpm, 20 min) and the flow-through
was collected.
Gel-free protein identification: Salt removal
The Thermo Scientific Pierce C18 Spin Columns were used to remove the salts from the samples. First, the
digested samples (full proteome, microsomal fraction and
plasma membrane fraction) were acidified with a buffer containing 2% TFA and 20 % ACN, (sample: buffer ratio 3:1) resulting in a final concentration of 0.5% TFA and 5% ACN. Second, the C18 columns were activated and
equilibrated by adding 200 µl of 50% ACN and 200 µl 0.5%
TFA in 5% ACN respectively, followed by centrifugation
at 1,500 x g for 1 min after each step. Third, the samples were added to columns and centrifuged at 1,500 x g for 1 min. This step was repeated once to maximize the sample
binding to the column. Fourth, the columns were washed
with 200 µl of 0.5% TFA in 5% ACN, and centrifuged at 1,500 x g for 1 min. This step was repeated once to remove
the maximum amount of salt contaminants. Finally, the
samples were eluted from the column by applying twice 25 µl of 70% ACN and centrifuged at 1,500 x g for 1 min. Subsequently, the samples were dried in a vacuum operator until they were dry and the peptides were dissolved in 10 µl % of 0.1% FA and 5% ACN.
Mass spectrometry analysis used for gel-free protein
identification
The UPLC-MS/MS analysis was performed on a Q Exactive Orbitrap mass spectrometer (Thermo Scientific). One
microliter of the samples, full proteome, microsomal and upper phase (plasma membrane fraction) was injected and separated
on an Ultimate 3000 UPLC system (Dionex, Thermo Scientific, Netherlands) (Thermo Scientific™ Acclaim™ PepMap™
Particle Size). The samples were separated using as buffer A
water 0.1% FA and buffer B 20% water, 80% ACN and 0.1% FA. The columns used were: an Easy-Spray column (Thermo Scientific), 15 cm x 50 µm ID, PepMap RSLC C18, 2 µm for
the plasma membrane and microsomal samples, and an
EASY-Spray column (Thermo Scientific), 50 cm x 75 µm ID, PepMap RSLC C18, 2 µm for the full proteome sample. Upper phase
and microsomal samples were eluted from the 15 cm column
at a flow rate of 300 µL/min using a gradient of 4% to 10% B for 6 min followed by a gradient of 10% to 35% B for 25 min, a gradient 35% to 65% B for 5 min and then a final elution and re-equilibration step at 95% and 5% B respectively for 10 min.
The full proteome sample was eluted from the 50 cm column
at a flow rate of 300 µL/min using a gradient of 4% to 12% B for 17 min followed by a gradient of 12% to 15% B for 3 min, a gradient 15% to 18% B for 45 min, a gradient 18% to 20% B for 40 min, a gradient 20% to 30% B for 65 min, a gradient 30% to 35% B for 30 min, a gradient 35% to 65% B for 5 min and then a final elution and re-equilibration step at 95% and 5% B respectively for 40 min.
The Q Exactive was operated in positive ion mode
with a nanospray voltage of 1.5 kV and a source temperature
of 250° C. ProteoMAss LTQ/FT-Hybrid ESI PosModeCalMix (MSCAL5-1EA SUPELCO, Sigma-Aldrich) was used as an external calibrant and the lock mass 445.12003 as an internal
calibrant. The instrument was operated in data-dependent
acquisition (DDA) mode with a survey MS scan at a resolution
of 70,000 for the mass range of m/z 400-1600 for precursor ions, followed by MS/MS scans of the top 10 most intense
peaks with +2, +3 and +4 charged ions above a threshold ion count of 16,000 at 35,000 resolution using normalized collision energy (NCE) of 25eV with an isolation window of 3.0 m/z, an
apex trigger 5-15 sec and a dynamic exclusion of 10 s. All data
were acquired with Xcalibur 2.2 software (Thermo Scientific). For identification, all raw data were converted into mgf files using Proteome Discoverer 1.3 (Thermo Scientific). The
spectra were searched using Mascot (version 2.2.04) against our in-house Musa database (MusaA_B) containing all the protein
sequences of the published A and B genome plus contaminant
sequences (trypsin and keratin). Search parameter were set at: tryptic digestion, one miscleavage allowed, 10 ppm precursor
mass tolerance and 0.02 Da for fragment ion tolerance with a fixed modification of cysteine carbamidomethylation and a variable modification of methionine oxidation. Next, the data were uploaded to Scaffold (version 3.6.3) to generate a fasta file of the proteins of interest. The filter conditions were 0.1% of protein false discovery and 0.9% of peptide false discovery. The fasta file sequences were annotated via Blas2go and their likely cellular compartment was further characterized by GO
compartment searches.
RESULTS AND DISCUSSION
Analysis of the protein profiles from the total,
soluble, microsomal, upper and lower fractions The proteins isolated in the total, soluble, microsomal, upper and lower fractions from Cachaco
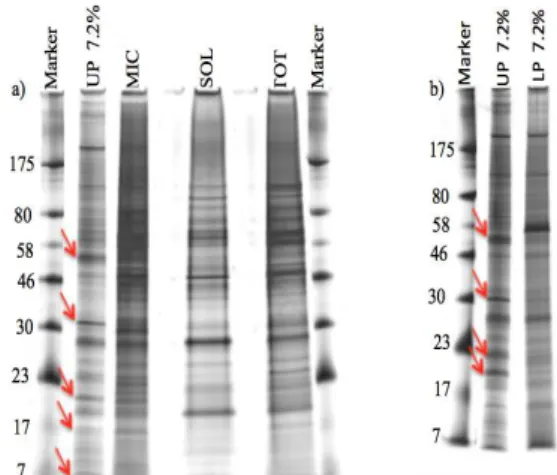
roots were loaded in a one dimension SDS-PAGE gel (Figure 2a, b) to compare the protein profile of the upper phase to the total, microsomal and lower fractions. Using
a more sensitive but non-mass spec compatible silver staining, we observed enrichment of some proteins in
the upper phase (indicated by the red arrows in figure
2 a, b), which are not present or less abundant in the total, soluble, microsomal and lower fractions. Since
the plasma membranes have the highest affinity for the PEG upper phase (Larsson, 1985), the proteins
enriched in the upper phase have a high probability to be plasma membrane proteins. This is an indication that the aqueous-polymer two-phase system technique may have worked properly. To assess this, protein bands were
extracted from a gel stained with Coomassie Brilliant Blue (Figure 4) for identification.
Figure 2 – Fractionation of proteins extracted from Cachaco roots. Two pre-casted NuPAGE®Novex®Bis-Tris Mini gels silver staining. Images obtained by ImageScanner from
Amersham Biosciences. Each lane contains 1 μg of protein.
a) Marker = ColourPlusprestained protein marker, UP = upper
phase containing 7.2% (w/w) polymer concentration, MIC = microsomal fraction, SOL = soluble fraction, TOT = total
fraction, b) UP = upper phase and LP= lower phase containing
both 7.2% (w/w) polymer concentration.Red arrows indicate
the proteins enriched in the upper phase (UP) 7.2% compared
Test of four polymer concentrations for the partition of proteins in the upper and lower phases
It is known that the polymer concentrations of PEG
and dextran affect the protein partitioning in the
aqueous-polymer two-phase system. Larsson (1985) reported that
the majority of the membrane vesicles are in the upper phase when the polymer concentration is close to the critical concentration for the formation of the two phases. The increase in the polymer concentrations increases the hydrophobicity
of the PEG-upper phase. As a result, the endomembranes
especially the mitochondrion and endoplasmic membranes start to partition at the interface and the plasma membranes remain in the upper phase. Therefore we tested four different
polymer concentrations: 6.2%, 6.4%, 6.8%, and 7.2% in order
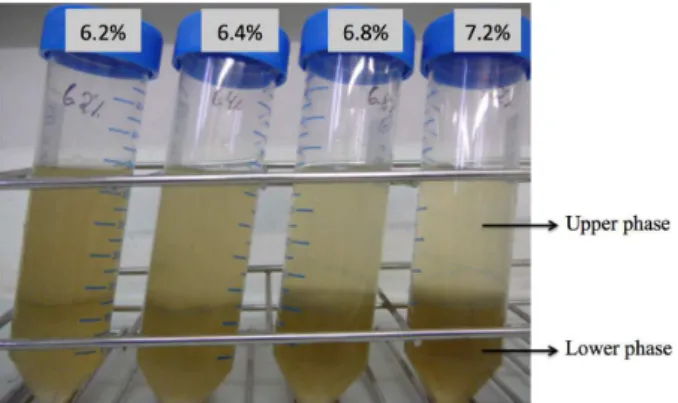
to compare the enrichment of proteins in the upper phases. At the lowest polymer concentration, 6.2%, the upper and lower phases were not clearly distinct. As the polymer concentration increases, the difference in color between the
two phases increases (Figure 3). The upper phase becomes
more transparent and the lower phase darker. The 7.2% polymer concentration showed the most transparent color. The dark color is probably caused by the oxidation of polyphenol components, which are unwanted in the protein extraction.
Next, we applied the upper and lower phases
(Figure 3) into a one dimension SDS-PAGE Coomassie gel to compare their protein profiles (Figure 4). The clear
effect of polymer concentration we previously observed
on the composition of the two phases was not observed at
the protein profile level and irrespective of the polymer
concentration there is still an overlap between the upper and lower phase.
To have a better view on the composition of the proteins in the upper phase, we extracted some protein bands from the upper phase 6.4% for identification
(indicated by red numbers in figure 4).
Figure 3 – Microsomal fraction extracted from Cachaco
roots and added to four aqueous-polymer two-phase
partitioning system containing the following PEG and dextran concentrations: 6.2% (w/w) PEG and 6.2% (w/w) dextran; 6.4% (w/w) PEG and 6.4% (w/w) dextran; 6.8% (w/w) PEG and 6.8% (w/w) dextran and 7.2% (w/w) PEG and 7.2% (w/w). Upper phase rich in PEG and lower phase rich in dextran formed after the first round of centrifugation at 1,800 x g for 5 min at 4 °C.
Gel-based protein identification
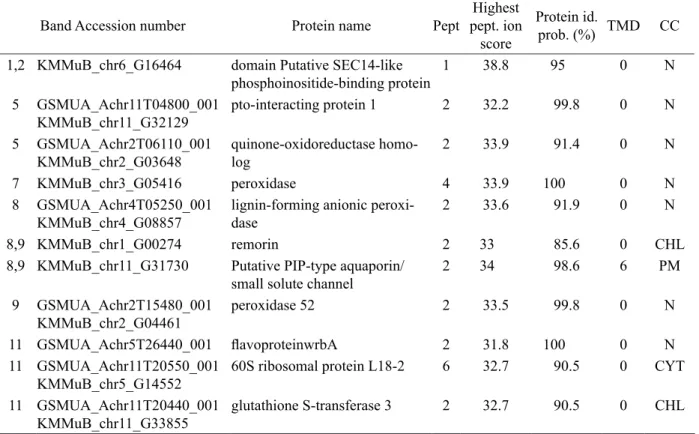
Out of 17 protein bands extracted from the upper
phase 6.4% (Figure 4), 7 bands led to the identification of
11 proteins but only one among them was predicted to be located at the plasma membrane: the aquaporin protein
(KMMuB_chr11_G31730) (Table 1). The remaining
proteins were predicted to be located at the cytoplasm and chloroplast. We also searched for the presence of
transmembrane domains (TMD) and for the subcellular
compartment. The presence of a transmembrane domain refers to the alpha helix of a transmembrane protein. This information can be useful for a protein being soluble or attached to a cellular membrane. Among the 11 proteins
identified, the presence of transmembrane domains was
detected only in the aquaporin protein (Table 1).
Figure 4 – Proteins from Cachaco roots isolated in the upper and lower phases (UP and LP) of four
aqueous-polymer two-phase systems containing different aqueous-polymer concentrations. Lower and upper phases 6.2% (w/w),
6.4% (w/w), 6.8% (w/w) and 7.2% (w/w) applied into two pre-casted NuPAGE®Novex®Bis-Tris Mini gels
stained with Coomassie Brilliant Blue. Images obtained by ImageScanner from Amersham Biosciences. Each lane
contains 10 µg of protein. Marker = ColourPlus prestained
The low numbers of proteins identified via the
gel-based approach is linked to the low number of protein bands extracted from the gel, the percentage of
identification (42%) is possibly due to protein losses
during Coomassie removal from the proteins to avoid interferences during mass spectrometric analysis and protein extraction from the gel plugs (Shevchenko
et al., 1996). Furthermore, this is a time consuming
approach, which might have issues with reproducibility. Nevertheless, this approach is useful to visualize the
protein profiles from different samples.
Gel-free protein identification
Considering the limitations of the gel-based approach for protein isolation and identification, the upper phase was additionally analyzed via a LC-MS/MS
new generation mass spectrometer orbitrap QExactive.
Along with the upper phase fraction (plasma membrane fraction), we also examined a full proteome fraction and a
microsomal fraction for the presence of plasma membrane proteins.
In the upper fraction, a total of 502 proteins were
identified, 239 were annotated, 123 were predicted
to be located at the plasma membrane and at other cellular compartments, and 25 were predicted to possess
transmembrane domains (TMD). In the microsomal fraction, a total of 895 proteins were identified, 431 were annotated, 219 were predicted to be located at the plasma
membrane and at other cellular compartments, and 52
were predicted to possess TMD. In the full proteome fraction, a total of 633 proteins were identified, 296 were annotated, 148 were predicted to be located at the
plasma membrane and at other cellular compartments,
and 27 were predicted to possess TMD (Figure 5). From
a total of 242 proteins predicted to be plasma membrane
proteins, 59 were unique for the microsomal fraction,
14 for the full proteome fraction, and twofor the upper
fraction (Figure 5 c).
Table 1 – Proteins identified in the bands depicted in figure 4. The band where the protein was identified, accession number (MusaA_B database), protein name, number of unique peptides (Pept, determined by Mascot), highest peptide ion score (determined by Mascot), protein identification probability (determined by Scaffold), number of transmembrane domains (TMD; determined by Aramenon v8.0), and cellular compartment (CC determined by Blast2go). N = cellular compartment not identified, CHL = chloroplast, PM = plasma membrane, CYT = cytoplasm.
Band Accession number Protein name Pept
Highest pept. ion
score
Protein id.
prob. (%) TMD CC
1,2 KMMuB_chr6_G16464 domain Putative SEC14-like phosphoinositide-binding protein
1 38.8 95 0 N
5 GSMUA_Achr11T04800_001
KMMuB_chr11_G32129 pto-interacting protein 1 2 32.2 99.8 0 N
5 GSMUA_Achr2T06110_001
KMMuB_chr2_G03648 quinone-oxidoreductase homo-log
2 33.9 91.4 0 N
7 KMMuB_chr3_G05416 peroxidase 4 33.9 100 0 N
8 GSMUA_Achr4T05250_001
KMMuB_chr4_G08857 lignin-forming anionic peroxi-dase
2 33.6 91.9 0 N
8,9 KMMuB_chr1_G00274 remorin 2 33 85.6 0 CHL
8,9 KMMuB_chr11_G31730 Putative PIP-type aquaporin/ small solute channel
2 34 98.6 6 PM
9 GSMUA_Achr2T15480_001
KMMuB_chr2_G04461 peroxidase 52 2 33.5 99.8 0 N
11 GSMUA_Achr5T26440_001 flavoproteinwrbA 2 31.8 100 0 N 11 GSMUA_Achr11T20550_001
KMMuB_chr5_G14552 60S ribosomal protein L18-2 6 32.7 90.5 0 CYT
11 GSMUA_Achr11T20440_001
Among the plasma membrane proteins identified,
we found 4 isoforms of aquaporins (PIP1-1, PIP1-2, PIP2-2 PIP2-6) in the microsomal fraction, 2 isoforms (PIP1-1 and PIP1-2) in the upper fraction and one isoform (PIP-2) in the full proteome. Other plasma membrane proteins such as cellulose synthase, cation-transporting
ATPase, ABC transporter family member 2, and plasma
membrane ATPase 4, pleiotropic drug resistance protein
3 (ABC transporter), high affinity nitrate transporter were identified only in the microsomal fraction.
Our results showed that the aqueous-polymer two-phase system technique is not the most useful technique to identify as many plasma membrane proteins as possible. Additionally, the application of this technique encounters
the following difficulties: (i) it requires a significant
amount of tissue (50 g) for extraction, (ii) optimization before application and, (ii) the protocol is time consuming. On the other hand, the protocol for the extraction of the full proteome and the microsomal fractions are more straightforward and do not need to be optimized for every plant tissue.
Despite the advantage of extracting a full proteome fraction and being able to characterize “the full proteome” in one step, the microsomal fractions yielded 28 proteins with TMD predicted to be located at the plasma membrane which were not identified in the full proteome.
We observed that the microsomal fraction, initially
thought to be too complex and not sufficiently pure for plasma membrane protein identification (Vertommenet
al., 2011), proved to be the most useful fraction to isolate plasma membrane proteins and not too complex for the current generation of mass spectrometers.
CONCLUSIONS
In this study, we described the isolation of plasma membrane proteins from banana roots using 4 different
strategies. We first conclude that the gel-based approach was useful to visualize the proteins but not very efficient
for the identification of proteins. Subsequently, we analyzed the upper fraction (plasma membrane fraction) via a gel-free approach and compared the amount of plasma membrane proteins identified with the ones
identified in a full proteome and microsomal fractions.
The microsomal fraction yielded the highest number
(227) of identified plasma membrane proteins. Therefore,
we finally conclude that the use of the microsomal
fraction is the most efficient strategy to isolate plasma
membrane proteins. We believe that the microsomal fraction is a valuable tool to study plasma membrane proteins. This is due to the advent of a high throughput mass spectrometry with high resolution and fast MS/ MSMS cycle able to identify a substantial amount of plasma membrane proteins from the bulk of total membrane proteins (microsomal fraction). This result opens a new strategy for the characterization of plasma membrane proteins.
ACKNOWLEDGEMENTS
Suzana Garcia is supported by a Ph.D. grant of the National Council for Scientific and Technological Development (CNPq), Brazil. Financial support from the Belgian Directorate-General for Development Cooperation (DGDC) and Bioversity International ‘ITC characterization’ is gratefully acknowledged.
The authors would like to thank Annick De Troyer
and Wesley Vermaelen for technical assistance. REFERENCES
ALBERTS, B. et al. Fractionation of cells. Molecular Biology of the Cell. 4th ed. New York: Garland Science. Retrieved March 2014 from <http://www.ncbi.
nlm.nih.gov/books/NBK21054/>, 2002.
ASENJO, J. A., ANDREWS, B .A. Aqueous two-phase systems for proteinseparation: Phase separation and applications. Journal of Chromatography A, 1238:1-10, 2012.
BOLAND, M. J. et al. Extractive purification of
enzymes from animal tissue using aqueous two phase systems: pilot scale studies. Journal of Biotechnology,
19(1):19-34, 1991.
BORNER, G.H.H. et al. Identification of glycosyl
phosphatidy linositol-anchored proteins in Arabidopsis: A proteomic and genomic analysis. Plant Physiology,
132(2):568-577, 2003. Figure 5 - Quantitative proteomics workflow. a) 1.037
proteins identified, b) 496 proteins annotated via blast2go, c)
242 proteins predicted to be located at the plasma membrane and in other cellular compartments, d) 55 proteins predicted
to possess TMD. Green = full proteome, Blue = microsomal
fraction, Red = plasma membrane fraction.
101 202 233 26 304 156
16 a)
14 46 59 7 81 33
2 c) 47 97 113
11 141 80 7 b)
2 9 19 1 15 9
CHANEY, L.; JACOBSON, B. Coating cells with colloidal silica for high-yield isolation of
plasma-membrane sheets and identification of transplasma-membrane
proteins. Journal of Biological Chemistry,
258(16):62-72, 1983.
CONESA, A. et al. Blast2GO: A universal tool for annotation, visualization and analysis in functional genomics research. Bioinformatics, 21(18):3674-3676, 2005.
DAVEY, M. et al. A draft Musa balbisiana genome sequence for molecular genetics in polyploid, inter and
intraspecific Musa hybrids. BMC Genomics, 14(5):683,
2013.
DEWITT, N.D. et al. Targeting of two Arabidopsis
H+-ATPase isoforms to the plasma membrane. Plant Physiology, 112(2):833-844, 1996.
D’HONT, A. et al. The banana (Musa acuminata) genome and the evolution of monocotyledonous plants. Nature, 488 (7410):213-217, 2012.
ELIA, G. Biotinylation reagents for the study of cell
surface proteins. Proteomics, 81(19):4012-4024, 2008.
GHOSH, D. et al. Lectin affinity as an approach to the proteomic analysis of membrane glycoproteins. Journal of Proteome Research, 3(4):841-850, 2004.
GIEROW, P. et al. Fractionation of rat liver
plasma-membrane regions by two-phase partitioning. Biochemical Journal, 235(3):685-691, 1986.
HARRIS, D.P. et al. The application of aqueous
two-phase systems to the purification of pharmaceutical
proteins from transgenic sheep milk. Bioseparation,
7(1): 31-37, 1997.
HILBI, H.; HAAS, A. Secretive bacterial pathogens and the secretory pathway. Traffic, 13(9):1187-1197, 2012.
LARSSON, C. Plasma membranes. In: Jackson, J.
F.;Linskens, H. F, eds. Modern methods of plant
analysis. Cell components, 1:85-104, 1985.
LUTWYCHE, P.; NORRIS-JONES, R.; BROOKS, D. E. Aqueous two-phasepolymer systems as tools
for the study of a recombinant surface-expressed Escherichia colihemagglutinin. Applied and Environmental Microbiology. 61(9):3251-3255,
1995.
NILSSON, R. et al. Proteomics of plasma membranes from Poplar trees reveals tissue distribution of transporters, receptors, and proteins in cell wall formation. Molecular & Cellular Proteomics,
9(2):368-387, 2010.
PLATIS, D.; NIKOLAOS, E.; LABRO, N.E. Development of an aqueous two phase partitioning
system for fractionating therapeutic proteins from tobacco extract. Journal of Chromatography A., 1128 (1-2):114-124, 2006.
RITO-PALOMARES, M. Practical application of aqueous two-phase partition to process development for the recovery of biological products. Journal of Chromatography, 807(1):3-11, 2004.
SHEVCHENKO, A. et al. Mass spectrometric sequencing of proteins from silver-stained
polyacrylamide gels. Analytical Chemistry,
68(5):850-858, 1996.
SCHINDLER, J.; NOTHWANG, H.G. Aqueous polymer two-phase systems: Effective tools for plasma membrane proteomics. Proteomics, 6(20):5409-5417, 2006.
SCHWACKE, R. et al. A novel database for Arabidopsis integral membrane proteins. Plant Physiology,
131(1):16-26, 2003.
SPEERS, A.E.; WU, C. C. Proteomics of integral membrane proteins-theory and application. Chemical Reviews, 107(8):3687-3714, 2007.
SRINIVAS, N.D.; RASHMI, K.R.; RAGHAVARAO, K.S.M.S. Extraction and purification of a plant
peroxidase by aqueous two-phase extraction coupled
with gel filtration. Process Biochemistry,
35(1-2):43-48, 1999.
VERTOMMEN, A. et al. A workflow for peptide-based proteomics in a poorly sequenced plant: A case study on the plasma membrane proteome of banana. Journal of Proteomics, 74(8):1218-1229, 2011.
WIDELL, S.; LUNDBORG, T.; LARSSON, C. Plasma
membranes from oats prepared by partition in an aqueous polymer two-phase system. Plant Physiology,
70(5):1429-1435, 1982.
YOSHIDA, S.; UEMURA, M. Protein and lipid
compositions of isolated plasma membranes from
Orchard Grass (Dactylis glomerata L.) and changes during cold acclimation. Plant Physiology, 75(1):31-37,
1984.
ZACHOWSKI, A. Phospholipids in animal eukaryotic membranes: Transverse asymmetry and movement. Biochemical Journal, 294(1):1-14,
1993.
ZUO, S.S.; LUNDAHL, P. A micro-Bradford membrane