ABSTRACT: Spatial and temporal variability of soil water extraction from the root zone affect soil water balance determination. The number of sensors installed in the root zone in studies addressing water balance is still set arbitrarily. This study provided an investigation of the water extraction process by banana (Musa spp.) roots by (i) determining the variability of water extrac-tion from the banana tree root zone, (ii) detecting differences in the estimaextrac-tion of evapotranspira-tion (ET) by the soil water balance method when the number of soil profiles monitored in the roots zone varies, (iii) and; determining the minimum number of Time Domain Reflectometry (TDR) probes needed to obtain ET precision and accuracy similar to that determined by a drainage lysimeter. The field experiment was conducted in Cruz das Almas, in the state of Bahia, Brazil, where a drainage lysimeter was installed on a banana plantation. The water extraction in the banana root zone was quantified by the water content variations monitored in 72 points by TDRs, with measurements at 15-min intervals. The variability of water extraction in the banana root zone was medium to high. The range of variability affects the reliability of the crop evapotranspiration calculation by the soil water balance method. To prevent an overestimation of banana evapo-transpiration, the water extraction in the soil profile must be monitored with at least 16 TDR probes installed at a minimum distance of 0.9 m and a minimum depth of 0.7 m.
Keywords: soil moisture, soil water balance, water uptake 1Federal Institute of Education, Science and Technology
Baiano, Estrada da Igara, s/n - Zona Rural – 48970-000 – Senhor do Bonfim, BA – Brazil.
2Embrapa Cassava & Fruits, R. Embrapa, s/n – 44380-000 – Cruz das Almas, BA – Brazil.
*Corresponding author <[email protected]>
Edited by: Paulo Cesar Sentelhas
Water extraction variability in the banana root zone affects the reliability of water
Alisson Jadavi Pereira da Silva1*, Eugênio Ferreira Coelho2, Maurício Antônio Coelho Filho2
Received January 09, 2014 Accepted July 13, 2014
balance
Introduction
Information on crop water requirements is the main reference for efficient irrigation. It is also funda-mental to other applications, e.g., to crop zoning and to drainage and hydrological studies (Flumignan et al., 2011). Crop water requirements are represented by a combination of two separate processes, soil surface evaporation and crop transpiration, which together rep-resent evapotranspiration (ET) (Allen et al., 1998).
The determination of ET in fruit plantations is challenging because fruit tree canopies are not uniform. Their shape depends on the way they are trained (Marsal et al., 2013), and their root system is strongly developed, especially in the case of banana (Musa spp.) plantations. Several methods have been used to determine water con-sumption of banana, such as micrometeorological (San-tos et al., 2009; Ding et al., 2013), lysimetric (Santana et al., 1993) and soil water balance. For both drainage lysimeters and soil water balance methods, ET is calcu-lated by directly measuring the components of the soil water balance applied over a period of time (Δt) within the soil volume. Regardless of the soil water balance method, changes in water content are commonly moni-tored at key points in the soil volumes, using sensors such as tensiometers, time domain reflectometry (TDR) probes, frequency domain reflectometry (FDR) probes or neutron probes (Green and Clothier, 1995; Andreu et al., 1997; Palomo et al., 2002).
The soil volume to be considered for the water bal-ance is determined arbitrarily (Hillel, 2003). This may lead to uncertainties in the estimation of ET since the
soil moisture variation in the crop root zone is not fully controlled. There is a wide variation in the number of points used to monitor soil moisture in studies for deter-mining the depletion of soil water storage when estimat-ing evapotranspiration or crop water extraction (Andreu et al., 1997; Green and Clothier, 1995; Wu et al., 1999; Green and Clothier, 1999; Palomo et al., 2002; Coelho et al., 2007; Silva et al., 2009b; Silva et al., 2013).
This study aimed to: (i) determine the variability of water extraction from the banana tree root zone, (ii) detect differences in ET estimation from the soil water balance method when there is variation in the number of soil profiles monitored in the root zone, (iii) and de-termine the minimum number of TDR probes needed to obtain ET estimation precision and accuracy similar to that determined by a drainage lysimeter.
Materials and Methods
0.1 m: the lower layer containing a drainage system with perforated 50-mm PVC tubes and gravel (12.5 – 4.8 mm); and the upper layer with washed sand.
The soil in the experimental area is a Latossolo Amarelo (EMBRAPA, 1997) or Xanthic Ferralsol (IUSS, 2006). The same soil from the experimental area was used to fill the lysimeter and the hydro-physical analyses per layer inside the lysimeter are presented in Table 2.
Meteorological data were obtained from an auto-matic weather station of the National Institute of Me-teorology (INMET) installed 380 m from the banana or-chard. With these data, hourly values of reference crop evapotranspiration (ETo) were computed daily, using the Penman-Monteith FAO-56 equation (Allen et al., 1998). The daily rainfall and ETo recorded during data collec-tion are shown in Figure 1.
Banana plants were irrigated by microsprinklers (flow rate 60 L h–1) with a mean application intensity of 5.5 mm h–1, resulting in an average uniformity co-efficient of 91 %. Irrigation was applied at two-day intervals and the water volume was calculated based on the change in soil moisture measured by 72 TDR probes installed in different positions inside the ly-simeter.
ET was calculated directly from mass balance esti-mates using the soil water balance equation applied over a given period of time (Δt) to a control volume of soil with five radial distances (R) and four depths (z):
ET=P+I±Δh-D (1)
where: P is the precipitation (mm); I the irrigation (mm);
Δh the variation in soil water storage (mm); and D is the drainage (mm). According to the site characteristics, other variables, such as surface and subsurface runoff and capillary rise were disregarded.
Table 1 – Biometric characterization of banana at the beginning of the developmental stages in the experimental area.
Plant stages Height Pseudo-stem
diameter Leaf area --- m --- m2 Early 0.66 ± 0.02 0.06 ± 0.003 1.84 ± 0.10 Vegetative growth 1.10 ± 0.10 0.11 ± 0.01 3.97 ± 0.15 Flowering 2.48 ± 0.12 0.24 ± 0.01 8.39 ± 0.41 Fruit growth 2.49 ± 0.11 0.25 ± 0.01 8.95 ± 0.30
Table 2 – Hydro-physical analysis of the soil used to fill the lysimeters. Ks is the saturated hydraulic conductivity, ρ is the bulk density, α and n are the adjustment parameters (van Genuchten – Mualem).
Depth Water retention x tension Ks ρ Porosity (%) α n
0.1 6 10 33 100 300 1500 Macro Micro
m --- (cm3 cm–3) x (kPa) --- m s–1 kg dm–3 %
---0.1 0.476 0.293 0.229 0.203 0.181 0.167 0.160 5.04.10–6 1.39 15.74 27.99 0.37 1.13 0.3 0.454 0.318 0.258 0.240 0.218 0.204 0.192 2.53.10–6 1.45 12.41 30.73 0.52 1.09 0.5 0.445 0.306 0.261 0.234 0.218 0.190 0.171 2.61.10–6 1.47 11.34 28.16 0.51 1.08 0.7 0.427 0.345 0.287 0.262 0.255 0.224 0.213 2.71.10–6 1.52 7.58 31.04 0.48 1.07
To monitor soil moisture within the lysimeter, TDR probes were constructed in the laboratory with the following features: three stainless steel rods with an ef-fective length of 0.1 m without the resin, spaced 0.017 m apart; 50 ohm coaxial cables and length of the polyester resin layer at the rod tip of 0.05 m. The soil moisture was determined based on adjusted values of the appar-ent dielectric constant (Ka) obtained from 23 differappar-ent gravimetric soil moisture values (θ). A polynomial math-ematical model was used to describe the relationship be-tween Ka and θ for a moisture range of 0.0408 cm3 cm–3 to 0.3749 cm3 cm–3, according to Equation 2:
θ = 0.000065 ka3 – 0.003979 ka2 + 0.090141 ka – 0.528860 (R2 = 0.9806) (2)
The soil moisture was monitored automatically by a time-domain-reflectometry system (model TDR 100), connected to a CR1000 datalogger and ten multiplexers (eight channels in each multiplexer). A program written in basic language was developed to read and store the dielectric constant values of the 72 TDR probes at 15-min intervals.
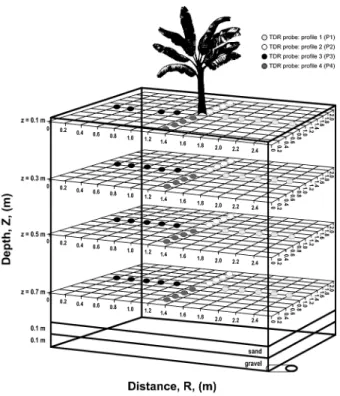
The 72 TDR probes were installed within the lysim-eter in four vertical planes (Pi = P1, P2, P3, P4) and five ra-dial distances (Figure 2). In each plane, soil moisture was monitored at five radial distances (R1 = 0.3 m; R2 = 0.5 m; R3 = 0.7 m; R4 = 0.9 m and R5 = 1.1 m) and four depths (z), in a 0.20 × 0.20 m vertical grid. The TDR probes were installed horizontally within the grid and ET was calcu-lated considering the situations illustrated in Figure 2.
The developmental stages of banana were deter-mined by days after transplanting (DAT) as follows: (i) early growth: 1 to 152 DAT; (ii) vegetative growth: 153 to 254 DAT; (iii) flowering: 255 to 285 DAT; and (iv) fruit growth: 286 to 381 DAT. Biometric characterization of the banana plants was carried out at the beginning of each developmental stage (Table 1).
The soil water balance was computed using Equa-tion 1. PrecipitaEqua-tion (P) was measured with a rain gauge (“Ville of Paris” type) installed at the experimental site. The irrigation (I) amount was measured immediately af-ter application, collecting the applied volume of waaf-ter in four collection cups distributed on the soil surface. Drainage (D) was measured in the lysimeter drains. Wa-ter storage in the soil (h) was calculated for each radial distance (Ri) to a total depth L (0.8 m) by Equation 3 as follows:
(3)
where: θ (zi) is the representative function of the mois-ture profile; dz is the differential of the independent variable z; and L is the total depth of the probe set Rn. To solve the numerical integral we used Simpson's rule. We calculated the variation in soil water storage (Δh) by Equation 4:
(4)
where: Δh is the variation of soil water storage in the profile, in cm3 cm–3 (for example, when i = 1 to 2, was used two probe sets: R = 0.3 m and 0.5 m; but when i
= 1 to 5 was used five probe sets: R = 0.3 m, 0.5 m, 0.7 m, 0.9 m, and 1.1 m); θt1 is the soil moisture value be-fore the irrigation at a monitoring point, in cm3 cm–3; θ
t2 is the soil moisture observed before the next irrigation at a monitoring point, in cm3 cm–3; and R and L are the distance and depth limits established for each condition of calculation.
The water extraction from the banana root zone was quantified by Equation 5, applied to a given position in the profile (Ri,Zi):
(5)
where: EA is the value of the soil water extraction in a given position in the profile, in cm3 cm–3 (for example, when i = 1 to 2, two probe sets was used: R = 0.3 m and 0.5 m; but when i = 1 to 5 five probe sets was used: R = 0.3 m, 0.5 m, 0.7 m, 0.9 m, and 1.1 m); θt+1 is the moisture at 8 h after the beginning of the irrigation at a monitoring point (Ri,Zi); θt2 is the moisture immediately before a subsequent irrigation at a monitoring point (Ri,Zi); and Zi and Ri are the distance and depth limits.
Statistical data analysis
At each stage of plant development, a descrip-tive analysis of soil water extraction was established, based on the values of the average coefficient of varia-tion, skewness and kurtosis. Data normality of water extraction at each monitoring point in relation to total water extracted from the profile was verified in the four profiles by the method proposed by Jones (1969), p = 0.05. To verify differences between the percentages of water extraction at monitoring points in the profiles, the Kruskal-Wallis test was used in cases where the set of values did not follow a normal distribution, and the F test (Fisher) was used for cases in which the data had a normal distribution.
The evaluation of the banana ET estimates was based on simple linear regression. Relationships were established with ET values obtained between the dif-ferent profiles (Pi). The analysis was performed as rec-ommended by Tedeschi (2006). Simple linear regres-sions with ET obtained with the P4 at the y axis and ET obtained for the P1, P2 and P3 at the x axis were adjusted. The joint null hypothesis of the estimated pa-rameters a and b is: H0: a = 1 and b = 0. The decision to accept or reject this hypothesis was based on the F test, as suggested by Mayer et al. (1994), p = 0.05. The same analysis was carried out to ET variation with dif-ferent numbers of radial distances (Ri). Simple linear regressions with ET obtained with the R5 at the y axis and ET obtained for the R1, R2, R3 and R4 at the x axis were adjusted.
The amplitude of the variability of water extrac-tion from the banana root zone was obtained based on the coefficients of variation (CV) as proposed by Warrick and Nielsen (1980), where CV < 12 % are classified as low, medium from 12 % to 60 %, and high for CV > 60 %. The CV values were calculated with the data of water extraction obtained at different moisture monitor-ing positions in the different developmental stages of the banana plant.
Results and Discussion
Variability of water extraction from the banana rhi-zosphere
The distribution of water extraction from the mon-itored profile at each developmental stage of banana and over time was irregular. Water extraction increased at banana flowering, compared to earlier stages, especial-ly in probe positions close to the soil surface (z = 0.1 m and z = 0.3 m). The activity of the root system was increased from this stage onwards since the fraction of the total water extracted from the shallower layers did not increase over time in relation to the other monitored layers, and a sharp increase in extraction intensity was observed from flowering onwards (Figure 3).
The fraction of the total water extracted from the whole profile was 51 %, 68 %, 40 %, and 38 % in the early growth, vegetative growth, flowering, and fruit growth stages, respectively, in the layer represented by the monitoring position z = 0.1 m (Table 3). In the early growth stage, daily averages of water extraction varied from 0.00053 to 0.0167 cm3 cm–3 in the layer z = 0.1 m (averages of all radial distances). For this same layer, in the vegetative growth, flowering and fruit growth stages the daily average water extraction ranged from 0.0008to 0.0241 cm3 cm–3, from 0.0152to 0.0355 cm3 cm–3,and from 0.0086 to 0.0331 cm3 cm–3, respectively (Figure 3).
According to the criteria of Warrick and Nielsen (1980), the variability of the banana water extraction variability is in a range that allows for a classification of the values into medium and high in relation to the profile (coefficients of variation ranging from 15 to 212 %) (Table 3).
The amplitude between the first and third quartile of water extraction percentage is higher in monitoring po-sitions closer to the soil surface and to the banana pseud-ostems in the early and vegetative growth developmental stages (Figure 4). This amplitude, however, is minimized in the flowering and fruit growth developmental stages. In fact, the average percentage of banana water extraction in the lower monitored profile was 5 % in all developmental stages. A 10 % increase in water extraction was observed in the deeper layer from flowering onwards, but it was not verified every day in this position. This leads to higher variation in the data in relation to higher layers, as simi-larly observed in the monitoring position z = 0.5 m, in the early and vegetative growth stages.
Not all combinations of water extraction obtained at different distances (R) and depths (Z) in relation to the plant had a normal distribution, according to the crite-ria proposed by Jones (1969) (Table 3). Only in the fruit growth stage did the water extraction present a normal distribution for all monitored positions.
The hypothesis that the water extracted by banana plants is equal for the four monitored profiles was re-jected when comparing the means obtained at different depths in the vegetative growth phase (Table 4). This fact should be related to a higher growth rate of banana roots at this stage. Approximately 62 % of the banana root growth in the first production cycle occurs between the sixth and the tenth month after planting (Belalcázar et al., 2005). According to Draye et al. (2005), several re-searchers reported an interruption in the formation of the root system from 15 to 75-90 days after planting and that after resuming, the banana root development ceases at flowering. In the other stages of plant development, the results of the F test (Fischer) and Kruskal-Wallis showed that the distributions of water extraction at the different distances (R) and depths (Z) were equivalent (Table 4).
Water balance in the root zone
The soil water storage (h) was quantified prior to irrigation for the determination of ET during the experi-mental period (Figure 5). The values shown in Figure 5 are averages calculated by soil moisture data from all monitoring positions in the different profiles. The dis-tribution of the 'h' values and the leached volumes over time showed that the irrigation management applied was appropriate since the amount of water applied was sufficient to supply ET, with few occurrences of percola-tion, which means that banana ET was determined un-der no water stress throughout the experimental period. Water percolation in the lysimeter was observed only in 12 intervals between irrigations, and the high-est leaching values occurred when rainfall occurred. Be-cause of the temporal variability, it was rather difficult to determine Δh in eq. 4, and the soil water balance during periods of rainfall are not presented. The inaccuracy in estimating ET due to the occurrence of precipitation is cited as a disadvantage of soil water balance by Allen et al. (2011) and Flumingnan et al. (2011).
The differences observed in the ET values are due to the variability in the spatial and temporal distribution pattern of soil water extraction from the banana rhizo-sphere. According to the vision of the three-dimensional distribution of water extraction from the banana root zone (Figure 3) and the water extraction percentage (Fig-ure 4), the water extraction from the profiles is irregular and more intense near the plant pseudostem.
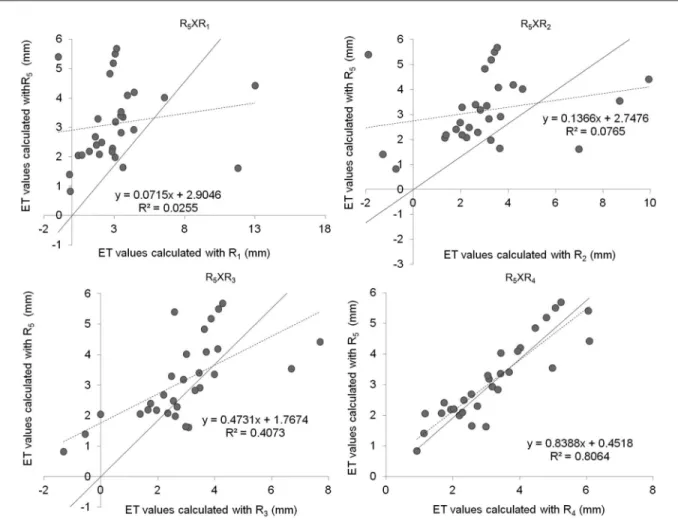
Estimates of ET by radial distances R1, R2 and R3 overestimated values obtained throughout the pro-file (R5) (Figure 7). The ET values estimated with R1 were overestimated by 297 % compared to the values estimated with soil moisture data from the whole pro-file (R5) (Table 6). The values estimated with R2 and R3 overestimate the values obtained in the whole profile by 288 % and 224 %, respectively (Table 6). This is due to a higher intensity of extraction in the radial dis-tances R1, R2 and R3, since these positions are closer to the banana pseudostem with more intense water ex-Figure 3 – Three-dimensional distribution of water extraction (cm3 cm–3) from the root zone of irrigated banana at developmental stages. Values
in the figures are average of six consecutive irrigations at each developmental stage.
the unilateral limits (p < 0.05) in the relationships with the data obtained in the four profiles (P4). Thus, due to differences in the standard water extraction between ir-rigation methods, the acceptance of this assumption is limited to the irrigation method used in this study, so fu-ture experiments should be performed with banana and other crops under different irrigation conditions.
ET variation with different numbers of radial dis-tances (R1, R2, R3 and R4) of TDRs probes monitor-ing in a smonitor-ingle plan (R5)
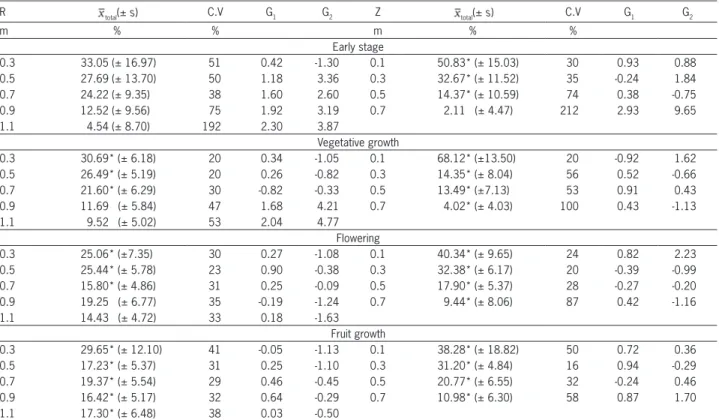
Table 3 – Descriptive statistics for water extraction from the root zone at monitoring points and developmental stages of banana trees.
R total(± s) C.V G1 G2 Z total(± s) C.V G1 G2
m % % m % %
Early stage
0.3 33.05 (± 16.97) 51 0.42 -1.30 0.1 50.83* (± 15.03) 30 0.93 0.88
0.5 27.69 (± 13.70) 50 1.18 3.36 0.3 32.67* (± 11.52) 35 -0.24 1.84
0.7 24.22 (± 9.35) 38 1.60 2.60 0.5 14.37* (± 10.59) 74 0.38 -0.75
0.9 12.52 (± 9.56) 75 1.92 3.19 0.7 2.11 (± 4.47) 212 2.93 9.65
1.1 4.54 (± 8.70) 192 2.30 3.87
Vegetative growth
0.3 30.69* (± 6.18) 20 0.34 -1.05 0.1 68.12* (±13.50) 20 -0.92 1.62
0.5 26.49* (± 5.19) 20 0.26 -0.82 0.3 14.35* (± 8.04) 56 0.52 -0.66
0.7 21.60* (± 6.29) 30 -0.82 -0.33 0.5 13.49* (±7.13) 53 0.91 0.43
0.9 11.69 (± 5.84) 47 1.68 4.21 0.7 4.02* (± 4.03) 100 0.43 -1.13
1.1 9.52 (± 5.02) 53 2.04 4.77
Flowering
0.3 25.06* (±7.35) 30 0.27 -1.08 0.1 40.34* (± 9.65) 24 0.82 2.23
0.5 25.44* (± 5.78) 23 0.90 -0.38 0.3 32.38* (± 6.17) 20 -0.39 -0.99
0.7 15.80* (± 4.86) 31 0.25 -0.09 0.5 17.90* (± 5.37) 28 -0.27 -0.20
0.9 19.25 (± 6.77) 35 -0.19 -1.24 0.7 9.44* (± 8.06) 87 0.42 -1.16
1.1 14.43 (± 4.72) 33 0.18 -1.63
Fruit growth
0.3 29.65* (± 12.10) 41 -0.05 -1.13 0.1 38.28* (± 18.82) 50 0.72 0.36
0.5 17.23* (± 5.37) 31 0.25 -1.10 0.3 31.20* (± 4.84) 16 0.94 -0.29
0.7 19.37* (± 5.54) 29 0.46 -0.45 0.5 20.77* (± 6.55) 32 -0.24 0.46
0.9 16.42* (± 5.17) 32 0.64 -0.29 0.7 10.98* (± 6.30) 58 0.87 1.70
1.1 17.30* (± 6.48) 38 0.03 -0.50
*Normal distribution (Jones, 1969); R – Distance from the plant; Z - Depth; - Mean of the four soil profiles; C.V- Coefficient of variation; G1- Skewness; G2- Kurtosis.
Table 4 – Mean percentages of soil water extracted from each monitoring profile (P1, P2, P3, and P4) in the banana root zone.
R P1 P2 P3 P4 Z P1 P2 P3 P4
m m
Early stage
0.3 38 28 40 28 0.1 58 50 49 47
0.5 30 25 21 34 0.3 31 31 39 30
0.7 22 29 20 25 0.5 11 13 11 22
0.9 7 15 12 16 0.7 <1 6 <1 1
1.1 2 6 6 5
Vegetative growth
0.3 30 25 35 33 0.1 80 b 68 ab 73 b 50 a
0.5 28 25 27 26 0.3 13 13 8 23
0.7 25 27 19 15 0.5 6 a 11 ab 14 ab 22 b
0.9 8 14 11 13 0.7 <1 7 4 5
1.1 8 10 8 13
Flowering
0.3 21 23 29 27 0.1 39 33 41 49
0.5 25 30 24 23 0.3 36 33 30 30
0.7 15 19 14 14 0.5 21 20 16 15
0.9 26 14 18 18 0.7 4 14 14 6
1.1 11 14 15 18
Fruit growth
0.3 36 32 31 20 0.1 41 37 28 47
0.5 16 20 19 14 0.3 30 30 37 28
0.7 21 17 18 21 0.5 19 23 19 21
0.9 14 15 17 20 0.7 10 9 13 11
1.1 14 16 15 24
Figure 4 – Box-plot of water extraction percentage, measured in four developmental stages of banana plant.
traction, making the ET values non-representative of what occurred in the whole root zone. For example, at distance R1 = 0.3 m, the percentage of water ex-traction in relationship to the total profile was 33 %
Table 6 – Statistics for regression between evapotranspiration of banana trees estimated by the soil water balance, using 1, 2, 3, 4, and 5 radial distances (R1, R2,R3, R4 and R5) for moisture monitoring.
Item (y = a +bx) R5xR1 R5xR2 R5xR3 R5XR4
Intercept (a) 2.90 2.74 1.76 0.45
Slope (b) 0.07 0.13 0.47 0.83
P value (H0: a=0 and b=1) <0.05 <0.05 <0.05 0.11
Figure 6 – Relationship between banana evapotranspiration (ET) estimated by soil water balance with variations in the calculation of water storage. Calculations using moisture data from one (P1), two (P2), three (P3) and four (P4) monitoring profiles during the experimental period. Table 5 – Statistic for regression between evapotranspiration of banana estimated by the soil water balance using 1, 2, 3 and 4 moisture
monitoring profiles (P1, P2, P3, and P4).
Item (y=a +bx) P4xP1 P4xP2 P4xP3 P3XP1 P3xP2 P2xP1
Intercept (a) 2.02 1.49 1.51 0.80 0.08 0.98
Slope (b) 0.91 0.94 0.94 0.94 0.99 0.93
P value (H0: a=0 and b=1) 0.051 0.085 0.058 0.59 0.98 0.43
when water is available in all the profile, the inten-sity of water extraction is greater near the plant pseu-dostem (Silva et al., 2009a; Silva et al., 2012; Silva et al., 2013). However, soil sensors are used to monitor moisture with one or two probe sets per plant (Silva et al., 2009b; Souza et al., 2013). It is risky to assume that the moisture variations in the root zone of a crop can be represented by a few moisture samples because the water extraction amplitude is uneven in the differ-ent soil moisture monitoring positions. So, it is safer to monitor soil moisture at various positions of the root zone (Domec et al., 2012).
Figure 7 – Relationship between the values of banana evapotranspiration estimated by the water balance with a varying number of radial distances of Time Domain Reflectometer (TDR) probes monitoring in a soil profile. Number of radial distances: R1: 0,3m; R2: 0.3m and 0.5m;
R3: 0.3m; 0.5m and 0.7m; R4: 0.3m; 0.5m; 0.7m and 0.9m; R5: 0.3m; 0.5m; 0.7m; 0.9m and 1.1m.
Conclusions
The spatial and temporal variability of soil water extraction in the banana root zone was classified as me-dium to high. The range of the variability affects the reli-ability of the crop evapotranspiration calculation by the soil water balance method. To prevent an overestima-tion of banana evapotranspiraoverestima-tion, water extracoverestima-tion in the soil profile must be monitored with at least 16 TDR probes installed to a minimum distance of 0.9 m and to a minimum depth of 0.7 m, spaced horizontally at length intervals of 0.2 m.
Acknowledgements
To Scott Bearson Jones (Utah State University), for his contributions.
References
Allen, R.G.; Pereira, L.S.; Howell, T.A.; Jensen, M.E. 2011. Evapotranspiration information reporting. I. Factors governing measurement. Agricultural Water Management 98: 899-920.
Allen, R.G.; Pereira, L.S.; Raes, D.; Smith, M. 1998. Crop Evapotranspiration: Guidelines for Computing Crop Water Requirements. FAO, Rome, Italy. (Irrigation and Drainage Paper, 56).
Andreu, L.; Hopmans, J.W.; Schwankl, L.J. 1997. Spatial and temporal distribution of soil water balance for a drip-irrigated almond tree. Agricultural Water Management 35: 123-146.
Belalcázar, S.C; Rosales, F.E.; Pocasangre, L.E. 2005. Development and formation of plantain roots (Musa
AAB Simmonds). p. 75-82. In: Turner, D.W.; Rosales, F.E., eds. Banana root system: towards a better understanding for its productive management. INIBAP, Montpellier, France.
Coelho, E.F.; Santos, D.B.; Azevedo, C.A.V. 2007. Sensor placement for soil water monitoring in lemon irrigated by micro sprinkler. Revista Brasileira de Engenharia Agrícola e Ambiental 11: 46-52.
Domec, J.C.; Sun, G.; Noormets, A.; Gavazzi, M.J.; Treasure, E.C.; Swenson, J.J.; McNulty, S.G.; King, J.S. 2012. A comparison of three methods to estimate evapotranspiration in two contrasting loblolly pine plantations: age-related changes in water use and drought sensitivity of evapotranspiration components. Forest Science 58: 497-512. Draye, X.; Lecompte, F.; Pagès, L. 2005. Distribution of banana
roots in time and space: new tools for an old science. p. 58-74. In: Turner, D.W.; Rosales, F.E., eds. Banana root system: towards a better understanding for its productive management. INIBAP, Montpellier, France.
Flumignan, D.L.; Faria, R.T.; Prete, C.E.C. 2011. Evapotranspiration components and dual crop coefficients of coffee trees during crop production. Agricultural Water Management 98: 791-800. Green, S.R.; Clothier, B.E. 1999. The root zone dynamics of water
uptake by a mature apple tree. Plant and Soil 206: 61-77. Green, S.R.; Clothier, B.E. 1995. Root water uptake by kiwifruit
vines following partial wetting of the root zone. Plant and Soil 173: 317-328.
Hillel, D. 2003. Introduction to Environmental Soil Physics. Elsevier, Amsterdam, The Netherlands.
International Union of Soil Science [IUSS]. 2006. World reference base for soils resources. FAO, Rome, Italy. (World Soil Resource Reports, 103).
Marsal, J.; Girona, J.; Casadesus, J.; Lopez, G.; Stockle, C.O. 2013. Crop coefficient (Kc) for apple: comparison between measurements by a weighing lysimeter and prediction by CropSyst. Irrigation Science 31: 455-463.
Palomo, M.J; Moreno, F.; Fernandez, J.E.; Diaz-Espejo, A.; Giron, I.F. 2002. Determining water consumption in olive orchards using the water balance approach. Agricultural Water Management 55: 15-35.
Santana, J.L.; Suarez, C.L.; Fereres, E. 1993. Evapotranspiration and crop coefficients in banana. Acta Horticulturae 335: 341-348.
Santos, A.C.S.; Silva, B.B.; Rao, T.V.R.; Neale, C.M.U. 2009. Energy balance measurements over a banana orchard in the Semiarid region in the Northeast of Brazil. Pesquisa Agropecuária Brasileira 44: 1365-1373.
Silva, A.J.P.; Coelho, E.F.; Miranda, J.H.; Workman, S.R. 2009a. Estimating water application efficiency for drip irrigation emitter patterns on banana. Pesquisa Agropecuária Brasileira 44: 730-737.
Silva, A.J.P.; Coelho, E.F.; Miranda, J.H. 2012.Sensor placement for irrigation scheduling in banana using micro-sprinkler system. Water Resources and Irrigation Management 1: 15-23. Silva, A.J.P.; Coelho, E.F.; Miranda, J.H. 2013. Efficiency of water application of irrigation systems based on microsprinkling in banana plantations. Scientia Agricola 70: 139-146.
Silva, E.N.; Bezerra, F.M.L. 2009b. Evapotranspiration and crop coefficients of banana at the Vale of Cururu, CE, Brazil. Revista Ciência Agronômica 40: 203-210 (in Portuguese, with abstract in English).
Souza, C.; Andrade, A.P.; Lima, J.R.S.; Antonino, A.C.D.; Souza, E.S.; SILVA, I.F. 2013. Water balance of castor bean under rainfed conditions. Revista Brasileira de Engenharia Agrícola e Ambiental 17: 3-10 (in Portuguese, with abstract in English). Tedeschi, L.O. 2006. Assessment of the adequacy of mathematical
models. Agricultural Systems 89: 225-247.