Repositório ISCTE-IUL
Deposited in Repositório ISCTE-IUL: 2019-04-15
Deposited version: Post-print
Peer-review status of attached file: Peer-reviewed
Citation for published item:
Cantante, F., Carmo, R. M., Alves, N. D. & Da Costa, A. F. (2016). Trends in income inequality: comparing the United States and Portugal. Portuguese Journal of Social Science. 15 (3), 367-385
Further information on publisher's website: 10.1386/pjss.15.3.367_1
Publisher's copyright statement:
This is the peer reviewed version of the following article: Cantante, F., Carmo, R. M., Alves, N. D. & Da Costa, A. F. (2016). Trends in income inequality: comparing the United States and Portugal. Portuguese Journal of Social Science. 15 (3), 367-385, which has been published in final form at https://dx.doi.org/10.1386/pjss.15.3.367_1. This article may be used for non-commercial purposes in accordance with the Publisher's Terms and Conditions for self-archiving.
Use policy
Creative Commons CC BY 4.0
The full-text may be used and/or reproduced, and given to third parties in any format or medium, without prior permission or charge, for personal research or study, educational, or not-for-profit purposes provided that:
• a full bibliographic reference is made to the original source • a link is made to the metadata record in the Repository • the full-text is not changed in any way
The full-text must not be sold in any format or medium without the formal permission of the copyright holders. Serviços de Informação e Documentação, Instituto Universitário de Lisboa (ISCTE-IUL)
Av. das Forças Armadas, Edifício II, 1649-026 Lisboa Portugal Phone: +(351) 217 903 024 | e-mail: administrador.repositorio@iscte-iul.pt
1
Trends in income inequality: comparing the United States and Portugal
Abstract
This article presents a comparative analysis of the United States and Portugal in terms of economic inequality over a long period of time, from the early 20th century to the present decade. We use different measures of inequality from several statistical sources. The article revolves around three complementary points. The first is a synchronic and diachronic analysis of economic inequalities Portugal and the United States, the second is the issue of redistribution of income and the final analysis addresses the evolution of top incomes in both countries.
Keywords: economic inequality, top incomes, redistribution, Portugal, United States
Introduction
The article addresses economic inequality in Portugal and the United States and revolves around three different points. We first conduct a synchronic and diachronic analysis of economic inequality in the two countries using the OECD countries as a reference. What is the position of these two countries regarding economic inequality in the OECD universe? How did income inequality evolved in the last three decades in Portugal and the United States? Did they went through similar patterns or were there important differences between them? Our analysis then focuses on the issue of redistribution of income. How big is the impact of redistributive mechanisms in Portugal and the United States? Which redistributive mechanisms are more relevant in each country? The third point is an analysis of top incomes and their growth in the two countries over a long period. Is the intensity of income concentration at the top similar in Portugal and the United States? Have these inequality measures been historically stable or did they change quite significantly over the last century? To what extend has income concentration at the top been one of the main forces behind rising economic inequality in Portugal and the United States?
2
Income inequality has been the main focus of several studies regarding Portuguese and United States societies. The uneven distribution of wages and income, which rely on the most on educational and class inequality, has been stressed as the core explanation to the increase of economic inequality in Portugal in the last decades (Carmo, Carvalho and Cantante 2015; Cantante 2014; Costa et. al. 2015; Martins et. al. 2014; Rodrigues, Figueiras e Junqueira 2012).This analytical perspective has been complemented by an analysis of redistribution policies, whose impacts are considered comparatively low (Alves, 2012; Rodrigues, Figueiras e Junqueira 2012). Regarding the United States, most studies have highlighted the role of income and wealth concentration at the very top as the main driver of economic inequality (Piketty 2013; Stiglitz 2012; Krugman 2007; Piketty e Saez 2007).
This article will discuss and foster some of these analytical footsteps, developing for the first time a direct comparative analysis of these two very different countries, who share a common structural feature: high internal economic inequalities. For that, several measures of inequality and a variety of sources will be used.
A comparative analysis of a particular social fact or phenomenon entails examining the comparability of empirical universes of reference from a methodological and theoretical point of view. The cross-referencing, opposition or synthesis of information on two or more empirical study referents means questioning the pertinence and admissibility of this exercise on the basis of the profile or characteristics of the universes compared. So, how can a study that chooses economic inequality as a central subject use as empirical references two countries whose aggregate income levels are very different?
With a gross domestic product (GDP) of 10,830.3 billion euros (14,991.3 billion dollars), in 2011 the United States was the country with the highest aggregate income in the world. It was higher than the GDP of the entire euro area and substantially higher than that of China. Portugal's GDP on the other hand was 171.9 billion euros (270.1 billion dollars). To get a clearer idea of the size of the United States' GDP, it represents around 63 times that of Portugal (in euros). This aggregate income gap could be
3
attributed to another substantial difference in scale between the two countries: population. While the population of Portugal was around 10.5 million according to the 2011 census, that of the United States was approximately 308.7 million (2010 census). In other words, the United States' population was 29.4 times larger than Portugal's. In spite of this huge demographic difference, it is much smaller than that in economic share. The disproportion between the aggregate income in the United States and Portugal is much greater than the demographic disparity.
This means that GDP per inhabitant in the United States is much higher than in Portugal. In 2011, Portugal's per capita GDP was 19,500 PPS1, i.e. 77% of that in the 27 European Union countries (EU-27=100%), while in the United States it was 37,100 PPS, 48% higher than the EU-27. For an idea of the magnitude of this economic indicator in the United States, per capita GDP in Germany was 30,300 PPS, "only" 21% higher than the EU average.
Aggregate economic income indicators, such as GDP or gross national income (GNI) 2 per capita, can be used as approximate predictors of the standard of living of a country's population. If we analyse the Human Development Index (HDI), we find that macroeconomic indicators tend to be associated with differences in living standards. It is enough to compare the GNI per capita in countries with a very high HDI with those that have a medium or low HDI. This is not a linear ratio, however, and there are cases in which living standards (e.g. health and education) are higher than a country's economic wealth and vice-versa. One of the reasons for this is the internal distribution of income. A country may be very rich but if income is concentrated in a minority of the population, the standard of living and wellbeing of the majority will tend not to
1
The purchasing power standard, abbreviated as PPS, is an artificial currency unit. Theoretically, one PPS can buy the same amount of goods and services in each country. However, price differences across borders mean that different amounts of national currency units are needed for the same goods and services depending on the country. PPS are derived by dividing any economic aggregate of a country in national currency by its respective purchasing power parities. PPS is the technical term used by Eurostat for the common currency in which national accounts aggregates are expressed when adjusted for price level differences using PPPs. Thus, PPPs can be interpreted as the exchange rate of the PPS against the euro. (Eurostat)
2
Gross domestic product is the result of production within a country, even contributions from non-residents. Gross national income is “the income received by a country's residents, regardless of where the production processes in which they involved occur” (Ramos, 2013: 34).
4
correspond to this level of income. The oil-exporting countries in the Middle East are a good example of this type of disparity.
The use of indicators like GDP or GNI when characterising a country's economic wellbeing and associated standards of living is a panoramic approach to their social reality. These are significant structural indicators because they provide information about “how much is produced and the average income generated or distributed in a country, which, if used properly, can generate material wellbeing” (Ramos 2013: 37). But a look at the economic pie tells us nothing about how it is sliced up. Refining our analysis of the social wellbeing and standard of living of a country's population also means focusing on its income distribution structure, especially in terms of disposable income. Although there is a huge difference between the aggregate product generated in Portugal and the United States, both countries have very high levels of inequality in the distribution of income. While it is true that the amount of income produced and the way it is allocated per inhabitant is a feature that clearly sets Portugal and the United States apart among the OECD countries, domestic economic inequality brings them closer together.
Economic inequality as a structural feature of societies
Several studies have underscored the idea that economic inequality tends to have negative effects on the functioning of societies and the population's living standards. The Spirit Level (2009) by Richard Wilkinson and Kate Pickett was perhaps one of the most important and effective contributions to the dissemination of this argument. They demonstrate that in the OECD countries the societies with higher levels of economic inequality are also those with the worst performance in such a variety of areas as confidence level, life expectancy, infant mortality, obesity, children's educational performance, murder rate, among others. Based on the above universe of countries, this theory defends that, rather than aggregate income, an indicator that
5
cannot be correlated to these types of social problems, economic inequality has multidimensional negative impacts on the way these societies are structured.
The view that inequality is not harmless and tends to have adverse effects on the community is now more widely accepted by academia and a number of international institutions. A good example of this is the fact that the United Nations Development Programme (UNDP) has produced a human development index adjusted to countries' degree of economic inequality. The UNDP estimates that economic inequality in countries worldwide results in an average 23.3% reduction in their human development index (HDI). This figure was 33.5% in the countries with a low HDI in 2012, 24.2% in those with a medium HDI, 20.6% in those with a high HDI and 10.8% in those with the highest HDI. In this last group, the United States is one of the countries that showed the greatest loss, dropping down 13 places in the HDI rankings (UNDP 2013).
If internal economic inequality has a negative effect on the functioning of societies and people's general living standards, it must be taken into account when measuring wellbeing and social development. These statistical correlations make even more sense when comprehensively backed up by reflection on the structural nature of inequality and an analysis of the social processes that cause it to multiply. Following Pierre Bourdieu's theoretic and conceptual heritage, Alain Bihr and Roland Pfefferkorn (2008) uphold that social inequalities tend to be passed down from one generation to the next, to interact with each other and accumulate. In other words, they are systemic. Inequality carries a social history as baggage and potentially extends to different spheres of life in society (Carmo 2010). Inequality tends to condition social mobility processes and reduce the scope of opportunities within people's reach. The social inequality production and reproduction processes, whose intensity and sense also depend on the way institutions deal will them (e.g. school or public policies), have a potential effect on people's life conditions and available opportunities. From the point of view of social structuring processes, inequality has a potentially harmful effect on social mobility, development and use of skills and talents, tending to reproduce
6
phenomena like poverty and social exclusion. Inequality of economic, educational or relational resources influences inequality of opportunities (Dubet 2010).
The systemic negative effects of inequality, especially from an economic viewpoint, can also be analysed from a perspective of collective action and the influence wielded by lobbies in institutions and public policies. This is one of the analytical lines followed by Joseph Stiglitz (2012). He upholds that the economic elite in the United States has been imposing its interests and world view on politics, thereby ensuring that public policies help to reproduce and intensify social inequality and perpetuate their dominant position in the social structure. Tax policies that favour the wealthy or channel revenue to them are examples of rich people's ideological, legal and institutional control of political decision making. Stiglitz believes that the takeover of political power by the country's economic elite has helped to reduce levels of trust and social cohesion, stiffen social structures (reducing equal opportunities) and weaken the tax revenue needed for public investment in education, infrastructure or technology. The most structural effect of inequality is, however, the creation of institutional, legal, political and cognitive conditions that guarantee its reproduction:
“The more egalitarian societies work harder to preserve their social cohesion; in the more unequal societies, government policies and other institutions tend to foster the persistence of inequality” (Idem: 77).
Social and economic inequalities can be politically, legally and institutionally increased or reduced. In other words, the structuring of inequalities is not unequivocal, the way they evolve and interact does not follow a logic that is independent from the way society deals with them, especially the way public policies include and act on them. It is therefore necessary to bear in mind that the reproduction and accumulation of inequalities are not a teleological fatality, a self-explanatory, self-referential social dynamic but rather a possibility moulded by a number of other variables. In certain legal, political and institutional frameworks, inequality can therefore decrease and not be reproduced. Tax policies are a particularly effective tool in mitigating economic inequality in terms of market and disposable income (Alvaredo et al. 2013; Atkinson,
7
Piketty and Saez 2010), although the institutions that regulate the labour market and education resources are also relevant factors that help define how income is distributed (OECD 2011; Krugman 2007).
As inequality is an important feature of any society and a factor that influences society's social, economic and political structuring processes, an analysis of inequalities in general and economic inequality in particular is a basic theoretic and methodological tool in a comparison between countries. In this case, we are comparing two societies with high degrees of economic inequality.
It is important to include a brief methodological note before going on to the different issues. The facts and arguments in this study are essentially based on a secondary analysis of official statistical sources or data produced by researchers and international institutions. In some cases, the information is directly comparable as the data are harmonised, though this is not always so. In these cases, we provide the available information while referring to the methodological differences behind the production of the statistics in question.
The impossibility of comparing data may simply be due to the fact that they do not exist in one of the countries or that the periods for which information exists do not exactly coincide. When this happens, we combine a comparison of the available information with a presentation of the data for only one of the countries. As a rule, however, we present statistics that can be compared.
1. Two societies with a huge gap between richest and poorest
The OECD has been warning of greater economic inequality in a number of its member countries in recent decades. It did so first in Growing Unequal? Income Distribution and Poverty in OECD Countries (OECD 2008) and has continued in more recent works, such as Divided We Stand: Why Inequality Keeps Rising (OECD 2011). In both studies, the United States and Portugal are among the OECD countries with the highest levels of economic inequality. The data in the more recent survey show the United States
8
and Portugal (plus Israel) at the top of the second group of countries with the greatest economic inequality, behind Chile, Mexico and Turkey. The degree of inequality in disposable income in these last three countries vastly exceeds that of the other members with Gini coefficients of 0.4 (or in Chile close to 0.5) 3.
The data in Table 1 are an update of the information in the above-mentioned report and refer to disposable monetary income per equivalent adult, i.e. the economic resources of households after social transfers, taxes and social security contributions4.
In 2010, the Gini coefficient was 0.380 in the United States and 0.344 in Portugal. These figures are the fourth and sixth highest in the OECD countries and are way above the average. An analysis of the extent of economic inequality in the two countries can be based on another two measures.
The S80/S20 ratio is a measure of inequality that compares the ratio between total income received by the top and the bottom quintile. In the United States, the income of the 20% richest was 7.9 higher than the 20% poorest, while in Portugal the ratio was 5.7.
An analysis of economic inequality using ratios can also use smaller groups (quantiles) for comparing distribution of income, e.g. the richest 10% and the poorest 10% (S90/S10). Table 1 shows that the degree of economic inequality in the United States measured with this indicator is much higher than in Portugal. The income of the richest 10% was 15.9 times greater than that of the poorest 10%, while in Portugal it was 9.3, similar to the average of the OECD countries (9.4).
3
The Gini coefficient is a measure that synthesises the dispersion of a certain indicator in a single figure. When measuring income inequality, the coefficient is 0 if all individuals have the same income, or 100 or 1 if all the income is concentrated in one person. It thus measures the dispersion of income based on a hypothetical reference scenario of perfect equality. It is more sensitive to incomes closer to mean incomes and less sensitive to the disparities between the two extremes.
4 In recent years, the OECD has been using a scale of equivalence that consists of adjusting each individual's income to the size of his or her household based on a scale of "equivalence elasticity" of 0.5. This means that the income of the people in the household is adjusted by the square root of the size of the household. For example, in a household of four people, each one's income would correspond to the division of the household's total income by two (the square root of four). This method does not, however, distinguish between adults and children and means that “a household’s economic needs increase less than proportionally with its size” (OECD, 2008: 41-42).
9
The figures for these three measures of inequality in the United States are higher than in Portugal. Although Portugal's inequality levels are higher than in most of the OECD countries in the Gini coefficient and S80/S20 ratio, its figure for the S90/S10 ratio is in line with the other OECD members.
Table 1. Measures of inequality in disposable income in the OECD countries (2010)
Gini coefficient S80/S20 S90/S10 Chile 0.508 13.8 30.0 Mexico 0.466 12.7 28.5 Turkey 0.411 8.4 15.1 United States 0.380 7.9 15.9 Israel 0.376 7.8 13.6 Portugal 0.344 5.7 9.3 United Kingdom 0.341 5.6 10.0 Spain 0.338 6.6 13.1 Greece 0.337 6.0 10.8 Japan 0.336 6.2 10.7 Australia 0.334 5.7 8.9 Ireland 0.331 5.4 9.1 Canada 0.320 5.3 8.9 Estonia 0.319 5.3 8.8 Italy 0.319 5.6 10.2 New Zealand 0.317 5.1 8.0 South Korea 0.310 5.7 10.5 Poland 0.305 4.8 7.7 France 0.303 4.5 7.2 Switzerland 0.298 4.6 7.3 Netherlands 0.288 4.3 6.9 Germany 0.286 4.3 6.7 Hungary 0.272 4.0 6.0 Luxembourg 0.270 3.9 5.6 Sweden 0.269 4.0 6.1 Austria 0.267 3.9 5.9 Belgium 0.262 3.9 5.6 Slovakia 0.261 3.8 5.9 Finland 0.260 3.7 5.4 Czech Rep. 0.256 3.6 5.4 Denmark 0.252 3.6 5.3 Norway 0.249 3.7 6.0 Slovenia 0.246 3.6 5.3 Iceland 0.244 3.5 5.3 OECD 34 0.313 - 9.4
Source: Statistics, List of key indicators (OECD)
Note 1: Countries ranked in descending order of Gini coefficient
Note 2: The data on Chile, Hungary, Ireland, Japan, New Zealand, Switzerland and Turkey are for 2009.
10
This information refers to the last year in which information was available for each country and enables us to conduct a synchronic analysis. It is also useful to include diachronic information, however. Figure 1 shows changes in economic inequality in the United States, Portugal and OECD between 1980 and 2010. While there is information available for almost all these years for the United States, this is not the case for Portugal or the average of the OECD countries.
Source: Statistics, List of key indicators (OECD).
The Gini coefficient for economic inequality in Portugal in 1980 was around 14% higher than in the United States: 0.350 against 0.307. Between 1980 and 1993, when the Gini coefficient was 0.369, economic inequality in the United States increased around 20%, and then went down slightly until 1999. It then increased irregularly and the figure in 2010 (0.380) was around 24% superior higher than in 1980.
Inequality in Portugal went down in the 1980s. There was a considerable rise in inequality in the first half of the 1990s followed by slight drop in the second half. In 0,25 0,27 0,29 0,31 0,33 0,35 0,37 0,39 19 80 19 81 19 82 19 83 19 84 19 85 19 86 19 87 19 88 19 89 19 90 19 91 19 92 19 93 19 94 19 95 19 96 19 97 19 98 19 99 20 00 20 01 20 02 20 03 20 04 20 05 20 06 20 07 20 08 20 09 20 10
Figure 1. Inequality of disposable income (Gini coefficient), USA, Portugal and OECD
(1980-2010)
USA Portugal OECD
11
spite of this change in direction, economic inequality was at a higher level at the end of the 1990s than at the beginning. According to Rodrigues (2007: 305):
“The reduction in inequality in the 1980s is closely associated with a more accentuated growth in incomes at the lower end of the scale. The rise in inequality in the 1990s was mainly due to changes at the upper end of the scale, where we find the households that benefited most from the economic growth.”
The first years of the new millennium witnessed an increase in economic inequality and the Gini coefficient was 0.385 in 2004, about 17% higher than in 1990 (0.329). From then until 2009 there was a progressive reduction in economic inequality in the country. Rodrigues, Figueiras and Junqueira (2012) attribute this in part to social policies aimed at assisting the more disadvantaged strata of the population, such as Social Insertion Income and Elderly People's Subsidy5. In 2009, the Gini coefficient was 0.339, but increased to 0.344 in 2010. A comparison of the Gini coefficient in Portugal in 1980 and 2010 shows that it fell by around 1.7%.
Figure 1 indicates several trends. Firstly it shows that the level of inequality in the two countries over the period in question was always higher than the OECD average. Secondly it demonstrates that inequality increased in Portugal in the 1990s and 2000s, while in the United States in fell slightly or stabilised, especially between 1994 and 2000. Thirdly between 2004 and 2008/2009 there was a substantial reduction in economic inequality in Portugal, while the 2000s in the United States witnessed an increase. An increase in economic inequality in 2010 interrupted the downward trend in Portugal and there was also a rise in inequality in the United States compared to 2008 (no information is available in the United States for 2009). We find that there was greater growth in economic inequality in the United States than in Portugal, being 10.5% higher in the USA than in Portugal in 2010.
5
Specific public policies aimed to provide income to the most fragile fringes of the Portuguese society, namely the ones with very low or no income at all and the elderly populations that earn survival pensions.
12
2. Income inequality and monetary redistribution
The previous section provided information on inequality in disposable income, i.e. the household's income after taxes, social security contributions and social transfers. It is analytically enlightening to determine the level of economic inequality before the state's redistribution and to measure the role played by the state in mitigating market inequality (economic resources before redistribution by the state).
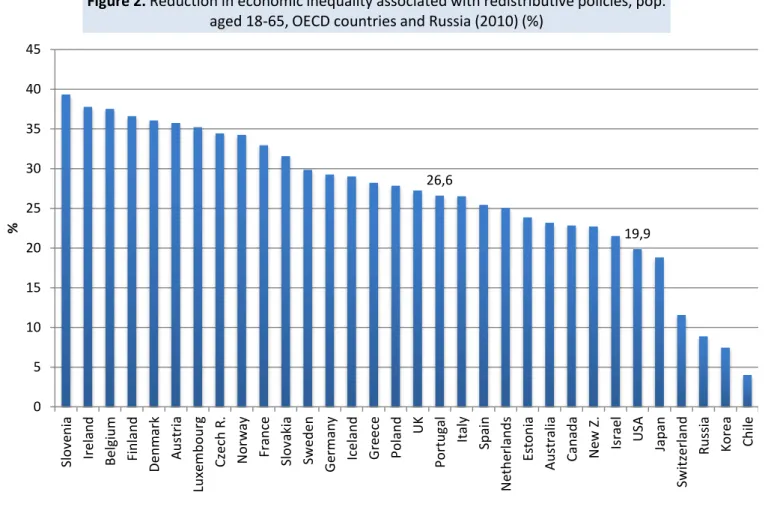
This can be done by comparing the Gini coefficient for economic inequality with market income and disposable income. In 2010, Portugal was the seventh highest OECD country (plus Russia) in terms of market income inequality for the population aged between 18 and 65, behind the United States. An analysis of inequality of disposable income shows that Portugal was still the seventh most unequal country of this universe of countries, while the United States was the third, after Chile and Russia. The fact that the United States rose in the economic inequality rankings and Portugal's position remained the same when we move from market income to disposable income shows that the impact of state redistribution is higher in Portugal than in the United States. Figure 2 shows the decrease in the Gini coefficient resulting from the effect of taxes and social security and also social transfers from the state to households in the OECD countries and Russia. State redistribution in Slovenia, Ireland, Belgium, Finland, Denmark, Austria and Luxembourg results in a reduction of over 35% in economic inequality. In the Czech Republic, Norway, France, Slovakia and Sweden the impact varies between 35% and 30%. State redistribution in Portugal reduced economic inequality by around 26.6%, which was considerably more than in the United States, where it was 19.9%.
Unlike South Korea or Canada, where the effect of state redistribution is fairly limited but inequality levels are relatively low, the United States (along with Chile, Israel and Russia) had both high economic inequality and low levels of monetary redistribution. The average impact of state redistribution was around 25% in the OECD countries (OECD 2012).
13
Source: Authors' calculations based on the Statistics database, List of key indicators (OECD)
Note 1: There are no available Gini coefficient data on market income for Hungary, Mexico or Turkey and so these countries have not been included in Figure 2. The data for Ireland, Japan, New Zealand and Switzerland are from 2009.
Note 2: We have used the same method as the OECD for measuring the impact of redistribution policies (OECD, 2011: 268-270).
According to Joumard, Pisou and Bloch (2012), there is a positive relationship between market economic inequality in the OECD countries and the impact of redistribution policies (social transfers and taxes) for the total population. This relationship is not linear, however. Indeed, most of the countries whose redistribution policies reduce economic inequality more have comparatively low market income inequality. This is the case in the northern European countries, the Czech Republic and Belgium.
This conclusion is confirmed when we look at the impacts of state redistribution in countries with high economic inequality. Redistribution policies in Portugal and the United States reduce economic inequality by less than 10 percentage points (pp) – below the OECD average – and in Chile by less than 5 pp.
26,6 19,9 0 5 10 15 20 25 30 35 40 45 Slov en ia Ire lan d Be lgi u m Finla n d De n m ar k Au st ri a Lu xe m b o u rg C ze ch R. N o rw ay Fran ce Slov ak ia Sw ed e n G erm an y Ice lan d G re e ce Po lan d UK Po rtu gal It aly Sp ain N eth erl an d s Es to n ia Au stra lia Can ad a N ew Z . Is ra el U SA Jap an Sw it zerla n d Ru ss ia Kore a Chile %
Figure 2. Reduction in economic inequality associated with redistributive policies, pop.
14
When analysing the effects of state redistribution we must distinguish between those of monetary transfers and of taxes.
Monetary transfers to households account for around three quarters of the reduction in economic inequality in the OECD countries (OECD 2012). According to Joumard, Pisou and Bloch (2012), these payments had reduced economic inequality in these countries by around 19% by 2010 and there was “no clear link between the degree of market income inequality and the redistributive impact of transfers” (Idem: 10). In countries like the Czech Republic, Finland, Sweden and Denmark monetary transfers have high impacts on reducing inequality, while Portugal and the United States are in the group with the lowest impacts in this regard: a 4.3 pp reduction in Portugal and 4.1 pp in the United States against an OECD average of 7.9 pp.6
Portugal and the United States are similar in terms of the low impact of monetary transfers on reducing market economic inequality, although the reasons for the small size of the impact are different. According to these authors, in the United States it is due to the small amount of monetary transfers compared to the OECD average, while in Portugal it is because of these transfers’ “lower progressivity” (Idem: 11). Alves (2012) agrees that the impact of monetary transfers in Portugal is low. Nevertheless, he states that this fact is explained by the small volume of social transfers to the bottom groups, not because of the way it is channelled. According to him, Portugal is one of the European Union members whose social transfers are more progressive. 7
On the subject of the effects of taxes and social security contributions in reducing economic inequality, Joumard, Pisou and Bloch (2012) conclude that there are no significant differences among the OECD countries8. Even so, the United States, along with Australia, Denmark, Germany, Israel and Italy, is in the group of countries in which the difference between inequality levels before and after income tax was the greatest.
6 Carlos Farinha Rodrigues (Coord.), Rita Figueiras and Vítor Junqueira (2012) reached similar conclusions about Portugal. They state that in 2009 Portugal had one of the lowest efficacy and efficiency rate associated with social contributions in a universe of 15 EU-27 countries (Idem: 177). 7 Alves (2012) doesn’t include the old age pensions in the redistributive process, whereas Joumard, Pisou and Bloch (2012) do. This may indicate that old age pension have a low redistributive impact. 8
The impact of taxes on reducing income inequality depends on the size and progression of the tax burden.
15
In other words, they are the OECD countries where taxes have the highest impact on reducing economic inequality. The United States is the only OECD country where taxes actually have a similar impact on reducing economic inequality to that of monetary transfers to households (Idem; Förster and Whiteford 2009). The mitigating effect of taxes on economic inequality in Portugal is also higher than the OECD average (Joumard, Pisou and Bloch 2012).
The relatively high impact of taxes on reducing economic inequality in the United States shown in this study is quite surprising, considering that the country's tax policy has been held as one of the main causes of income being concentrated at the top and of economic inequality in general (Stiglitz 2012; Krugman 2007). Piketty and Saez (2006) used government data to analyse the progressivity of the tax system in the United States on the basis of its impacts on concentration of income in the top groups. They conclude that there has been a reduction in tax progressivity in the United States in recent decades and this has favoured an increase in income concentrated in the top percentile and fractiles. On the one hand, “federal tax system reduced income concentration the most in the 1960s and 1970s when income concentration was relatively low”; on the other hand, “the federal tax system has a relatively modest effect on the top 0.1 percent income share in recent years when income inequality has become higher” (Idem: 14-15). According to the authors, the reduction in the progressivity of the United States tax system was due to a reduction in marginal rates on top incomes, the system of exemptions and tax benefits and taxation of capital income at lower marginal rates.
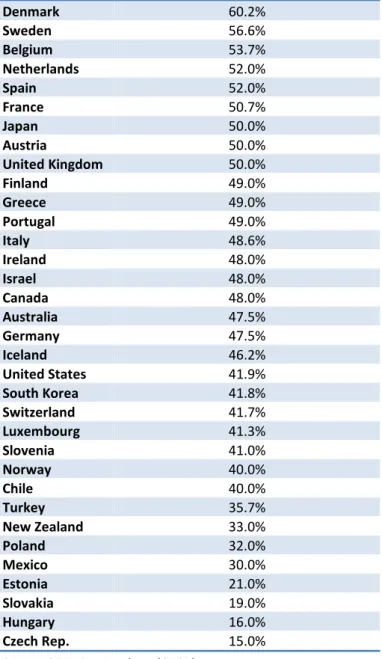
As a complement to these approaches, we show the highest bracket's personal income tax rates in the OECD countries in 2012. The amount to which these rates apply varies substantially from one country to another and the rate actually charged may vary on the basis of exemptions, tax benefits and the taxable income structure for each individual or tax unit.
In 2012, Denmark was the OECD country in which the tax rate on the top income bracket was the highest at 60.2%. This rate was 50% or more in eight countries. As in
16
Finland and Greece, the highest gross income bracket in Portugal was taxed at 49%9. The rate in the United States was 41.9%. Amongst the countries analysed in Table 2, 10 had top rates of 40% or less. The Czech Republic (15%), Hungary (16%), Slovakia (19%) and Estonia (21%) had the lowest rates.
Table 2. Top statutory personal income tax rates in the
OECD countries (2012) Denmark 60.2% Sweden 56.6% Belgium 53.7% Netherlands 52.0% Spain 52.0% France 50.7% Japan 50.0% Austria 50.0% United Kingdom 50.0% Finland 49.0% Greece 49.0% Portugal 49.0% Italy 48.6% Ireland 48.0% Israel 48.0% Canada 48.0% Australia 47.5% Germany 47.5% Iceland 46.2% United States 41.9% South Korea 41.8% Switzerland 41.7% Luxembourg 41.3% Slovenia 41.0% Norway 40.0% Chile 40.0% Turkey 35.7% New Zealand 33.0% Poland 32.0% Mexico 30.0% Estonia 21.0% Slovakia 19.0% Hungary 16.0% Czech Rep. 15.0%
Source: OECD Tax Database (OECD).
9
In Portugal a rate of 46.5% was charged on gross income over 153,330 euros a year in 2012, plus an additional charge of 2.5%. Income in the top bracket (over 80,000 euros) was taxed at 48% in 2013. A surtax of 3.5% was charged on all taxpayers plus an additional solidarity charge of 2.5% on taxable income between 80,000 and 250,000 euros. All income over 250,000 euros was subject to an additional 5% solidarity charge.
17
Our analysis of the impacts of taxes and social transfers on reducing economic inequality is based on different methodological strategies, conceptual definitions and information sources that influence the conclusions reached. It is therefore necessary to regard this type of information with caution and compare the different methodological approaches and analytical perspectives available in the literature. Instruments such as the Inquérito às Condições de Vida e Rendimento (Survey on Income and Living Conditions) in Portugal and the Current Population Survey in the United States gather empirical information for an analysis of the main trends in income distribution. From a methodological point of view, however, they are not the most reliable or appropriate instruments for measuring and analysing the groups at the top of the top income bracket. Phenomena such as sample underrepresentation of these groups, their propensity for under-declaring income or refusal to participate in surveys explain this limitation. Tax data have therefore been used to analyse the top incomes. It is this kind of information that we will use in the next section to compare the top incomes in Portugal and the United States.
3. Greater concentration of income at the top
Since Thomas Piketty published his seminal work Les Hauts Revenus en France au 20ème Siècle – Inegalités et Redistributions (2001), a number of researchers have been producing studies on top incomes based on government tax data for many countries. These data are estimates based on tax sources and complement and can be compared to statistical information from public surveys. The same strategy will be followed below.
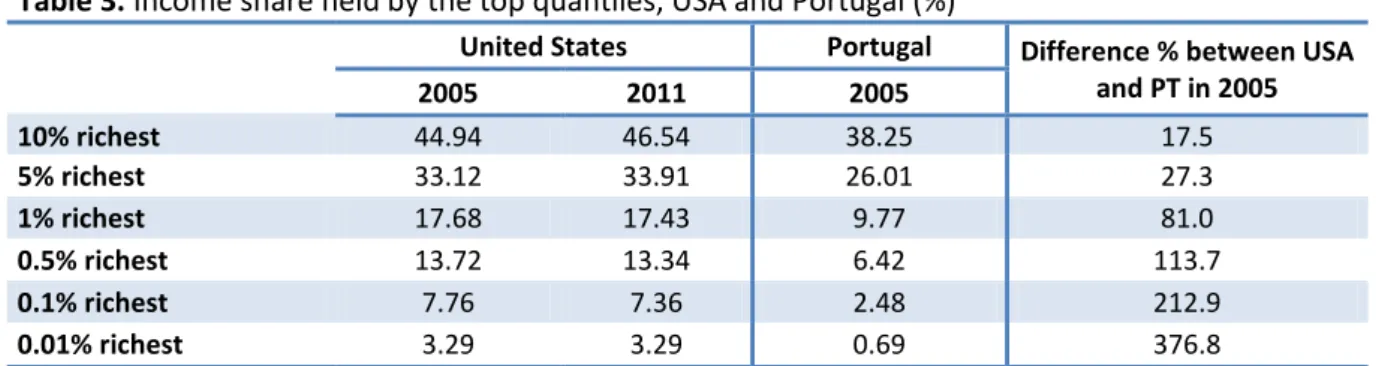
Table 3 shows a close-up of levels of concentration of pre-tax income of several groups in the top income brackets in Portugal and the United States (excluding capital gains10).
10 As in Alvaredo et al. (2013), OECD (2011), Alvaredo (2010) and Atkinson, Piketty and Saez (2010), we have not used data on top incomes including capital gains in the United States in our direct comparison between the two countries. One of the reasons is that there is no information on the distribution of capital gains declared for Portugal (Alvaredo, 2010: 564-565).
18
The latest available data for Portugal refer to 2005. As preliminary information for 2011 is available for the United States, we will present its data from 2005 and 2011. The degree of concentration of income in the top quantiles is significantly more pronounced in the United States than in Portugal in all the groups analysed. While in 2005 the richest 10% in Portugal had 38.3% of the total income, in the United States they had 44.9%, a concentration level 17.5% higher than Portugal. The more we narrow the range of income groups, the greater the difference is between the levels of concentration in the two countries. The richest 1% in the United States accounted for 17.7% of the country's total income while in Portugal they accounted for 9.8% (81% difference). The difference in level of concentration between the two countries grows if we compared fractions of the richest 1% group. While in Portugal the richest 0.01% accounted for around 0.7% of total income, they accounted for 3.3% in the United States (a difference of around 377%).
Table 3. Income share held by the top quantiles, USA and Portugal (%)
United States Portugal Difference % between USA and PT in 2005 2005 2011 2005 10% richest 44.94 46.54 38.25 17.5 5% richest 33.12 33.91 26.01 27.3 1% richest 17.68 17.43 9.77 81.0 0.5% richest 13.72 13.34 6.42 113.7 0.1% richest 7.76 7.36 2.48 212.9 0.01% richest 3.29 3.29 0.69 376.8
Source: Alvaredo, Facundo, Anthony B. Atkinson, Thomas Piketty and Emmanuel Saez, The World Top Incomes Database, http://topincomes.g-mond.parisschoolofeconomics.eu
Note: Pre-tax figures
One of the advantages of tax data is the possibility of using them to build wide-ranging historical series. We now look at statistical information on the evolution of income concentration levels in the top groups.
Figure 3 shows the share of total income of the richest 1% and 0.1% in Portugal and the United States. The data for the United States refer to 1913-2011, while those for the richest 1% and 0.1% in Portugal refer to 1976-2005 and 1936-2005, respectively.
19
Between 1913 and the Wall Street Crash in 1929 there was not only a high level of income concentration in these groups but it was also tending to grow. This timeframe was part of the so-called Gilded Age, which began in the late 19th century and witnessed the emergence of great fortunes, low taxation on income and wealth and deregulation of the financial markets (Krugman 2007). From 1929 onwards, the economic and financial shock caused by the Great Depression and Franklin D. Roosevelt's New Deal, income concentration began a downward trend in the top groups. This trend lasted until the United States entered the Second World War, when there was a highly pronounced reduction in concentration of income in the richest groups of the population. Over the next 30 years, the share of income held by the richest remained relatively low. This was the result of the structuring effect of the measures taken to sustain the war economy between 1941 and 1945 (e.g. control and levelling of salaries), a progressive tax policy and the bargaining power of the trade unions. The late 1970s and 1980s marked the beginning of an ongoing increase in the concentration of income in the top groups. According to several authors, this was associated with Ronald Reagan's policy of deregulating the financial sector, which helped a restricted number of professional groups directly or indirectly linked to financial services to increase their wealth (Stiglitz 2012; Horn et al 2009; Krugman 2007).This increase in concentration of income in the top tail of the distribution was accompanied by a rise in the preponderance of wage income in the economic resources of these groups (Piketty 2013; Piketty and Saez 2003).
The available data allows us to analyse the performance of top incomes in the United States during the current financial crisis. According to Emmanuel Saez (2013a), between 2007 and 2009, the real average income of the richest 1% fell by 36.3%, which was higher than the country's average reduction (17.4%). This represents a 23.5% decrease to 18.1% of their share of total income. This fall was largely due to loss of capital income, which fell from 895 billion dollars in 2007 to 236 billion in 2009. If we consider capital income, the share of income held by the richest 10% went down from 49.7% to 46.5%. However, if we exclude capital income from the analysis, there is hardly any change, as it went from 45.7% to 45.5%. In aggregate terms, 49% of total
20
income losses in the period were borne by the richest 1% (Idem). This trend began to turn around in 2009, however. The real average income of the richest 1% increased 11.7% between 2009 and 2011, while for the remaining population it fell 0.4%.
According to the author's preliminary data (Saez 2013b), this trend grows stronger if we take 2012 into account. The income of the richest 1% increased 19.6% from 2011 to 2012, while that of the rest of the population rose only 1%. He states that the income of the richest 1% grew 31.4% between 2009 and 2012, while that of the remaining 99% increased only 0.4%. This means that 95% of the gains in income in the first three years of recovery went to the richest.
Where Portugal is concerned, Figure 3 shows that levels of income concentration in the 1930s and 1940s were much higher than in 2005. In 1936 the richest 0.1% were estimated to receive 5.2% of the population's total income. Although Portugal did not take part in the Second World War, these figures went down during the period. The share of total income in the hands of the richest 0.1% fell from 5.2% in 1941 to 3.1% in 1946. During this period, the marginal rates on the highest incomes went from 8.5% to 30% (Alvaredo 2010)11. Between 1950 and 1970, there was a slight drop in the level of income concentration in this group, and this trend accelerated after that (also for the richest 1%) until a break in the series in 1982.
Since the series restarted in 1989 concentration of income has increased progressively in the two quantiles analysed in Figure 3. The marginal rates on the highest incomes did not undergo any significant changes in the period, which indicates that the taxation framework was not a decisive factor in the increase of top incomes (Idem: 13). A study by Rodrigues, Figueiras and Junqueira (2012) makes an initial approach to this phenomenon. According to these authors, inequality in the distribution of income from paid work grew deeper between 1985 and 2009 and the concentration of this income in the top quantiles increased sharply by 50.7% in the richest 1%, 60.9% in the richest 0.1% and 126.7% in the richest 0.01%. In other words, the employment market
11
21
was a source of inequality and concentration of economic resources in very small groups of the population with relatively well-defined occupations (Cantante 2013).
Source: Alvaredo, Facundo, Anthony B. Atkinson, Thomas Piketty and Emmanuel Saez, The World Top Incomes Database, http://topincomes.g-mond.parisschoolofeconomics.eu
Note: Pre-tax figures
After showing the data on concentration of income at the top in the two countries, we now conduct a brief comparative analysis of these trends.
A comparison between the group of the richest 1% in Portugal and the United States is only possible after 1976. In that year, income concentration for these groups in the United States and Portugal was similar: about 7.9% in both countries. In 1989, these groups' share of the income had fallen slightly (6.8%) in Portugal while in the United States it has risen quite significantly to 12.6%. From 1989 to 2005, the variation rate of these indicators increased a bit more in Portugal than in the United States: 42.8% and 40.2%. Although this rise was slightly more accentuated in Portugal than in the United 0 5 10 15 20 25 19 13 19 16 19 19 19 22 19 25 19 28 19 31 19 34 19 37 19 40 19 43 19 46 19 49 19 52 19 55 19 58 19 61 19 64 19 67 19 70 19 73 19 76 19 79 19 82 19 85 19 88 19 91 19 94 19 97 20 00 20 03 20 06 20 09 %
Figure 3. Income share of the richest 1% and 0.1% in the USA and Portugal (1913-2011)
22
States, the extent of the concentration of income in the top 1% in 2005 was much greater in the United States than in Portugal: 17.7% to 9.8%.
Regarding the concentration of income in the 0.1% group, we find that breadth of this phenomenon was greater in Portugal than in the United States from the mid-1940s to early 1970s. Indeed, this occurs not only in comparison with the United States, but with countries like Spain, France or the United Kingdom (Alvaredo 2010). From 1980 onward, there was a much sharper increase in this indicator in the United States than in Portugal (which was not the case for the richest 1%). It was in this period that the United States stood out as the most unequal in terms of distribution of income (and wealth) in the most developed countries in the world and the fourth highest in the OECD countries, behind Chile, Mexico and Turkey. As mentioned above, the data shown here for the United States do not include capital gains. If we take this income component into account, the level of concentration of income in the top groups increases substantially. For example, in 2011 the richest 1% had around 20% of the total income in the United States and between 1980 and 2007 their share of the income grew by around 135% (Alvaredo et al. 2013).
Conclusion
Portugal and the United States are two countries in which income distribution is quite unequal. This gap is more pronounced in the USA than in Portugal, but if we place them in the universe of OECD countries we find that their profiles are relatively similar. Economic inequality is a structural phenomenon that has important, multidimensional impacts on the way societies work. Although economic inequality may be reproduced or intensified by social, economic, institutional and political dynamics, this trend is not inevitable, however. A diachronic analysis of economic inequality in the two countries shows just that, as the extent of this phenomenon varies considerably over the years. Consider, for example, the increase in inequality in the United States prior to the 1929 crisis or in the late 1970s and early 1980s, two periods that witnessed tax reductions and deregulation of the financial markets. On the other hand, we can see the
23
equalisation of income distribution for several decades under the New Deal and later in the war economy in the United States or on a smaller scale that in Portugal between 2004 and 2009.
The increase of top income concentration is one of the most notable phenomena resulting from the analysis of income distribution. The increase of income inequality in most of the OECD countries in the last decade can be explained in part by this dynamic. Both in Portugal and the United States market income held by these groups has increased significantly in recent decades. The data presented in this article shows that top income concentration has been more intense in the United States than in Portugal. If we look at the very top income groups (1% fractiles), we conclude they have been pushing up overall inequality in a more deep way in the United States than in Portugal.
As in most advanced countries, top income concentration has put pressure on the state's ability to reduce inequality of disposable income. Although the phenomenon of economic inequality may be associated with issues as diverse as labour and trade union rights or access to education, this study essentially addresses redistribution policies in Portugal and the United States on the basis of social payments and taxation. Our conclusion is that, in general terms, Portugal has higher economic redistribution levels than the United States, although both countries average below European and OECD countries. While the data from population surveys in the United States shows that the state's redistribution has not managed to reduce inequality in disposable income in the last decade, Portugal experienced a progressive reduction in economic inequality in the second half of the 2000s. This trend was mainly due to policies on the transfer of income to more disadvantaged households, such as the Social Insertion Income and Elderly People's Subsidy.
The redistributive role of taxes and social transfers in the two countries is quite different. While in Portugal the reduction in economic inequality is essentially due to social transfers, in the United States taxes and monetary transfers to households have equivalent weights in the redistribution process. Nonetheless, analyses by authors
24
such as Joseph E. Stiglitz, Paul Krugman, Thomas Piketty and Emmanuel Saez have been demonstrating that the US tax policy has resulted in recent decades in a considerable increase in concentration of income at the very top of the distribution. As we show in this article, top income tax rate is considerably lower in the United Sates than in most European countries, including Portugal. Nevertheless, both in Portugal and the United States, but also in most OECD countries, there is a big difference between top rates regarding income as an all and capital income taxes (Piketty 2013). Capital income earners, who are typically the richest among rich, benefit from tax systems that tend to be harsher regarding labour revenue and benefit wealth and wealth income. This fact isn’t easy to capture using the available data. But it forms a legal frame that boosts income inequality and reinforces income and wealth concentration at the very top.
Acknowledgements
This study was carried out at the Observatório das Desigualdades (Inequality Observatory, CIES, ISCTE-IUL) and was supported by FLAD - Fundação Luso-Americana para o Desenvolvimento (Luso-American Foundation). The content of the article represents only the views of its authors.
References
Alvaredo, F. (2010), ‘Top incomes and earnings in Portugal 1936-2005’, in A. B. Atkinson and T. Piketty (eds.), Top Incomes: a Global Perspective, Oxford: Oxford University Press, pp. 560-624.
Alvaredo, F., Aktinson, A. B., Piketty, T. and Saez, E. (2013), ‘The top 1 percent in international and historical perspective’, Journal of Economic Perspectives, 27: 3, pp. 3-20.
25
Alves, N. (2012), ‘Uma perspetiva sobre a redistribuição do rendimento em Portugal e na União Europeia’, Boletim Económico do Banco de Portugal (Winter 2012), pp. 41-57. Atkinson, A. B., Piketty, T. and Saez, E. (2010), ‘Top incomes in the long run of history’, in A. B. Atkinson and T. Piketty (eds.), Top Incomes: a Global Perspective, Oxford: Oxford University Press, pp. 664-759.
Bihr, A. and Pfefferkorn, R. (2008), Le Système des Inégalités, Paris: La Découverte. Bourguignon, F. (2012), La Mondialisation de l’Inégalités, Paris: La République des Idées/Seuil.
Cantante, F. (2013), ‘O topo da distribuição dos rendimentos em Portugal: uma análise descritiva’, CIES e-Working Paper No. 154.
Cantante, F. (2014), “Desigualdades económicas multi-escalares: Portugal no contexto global”, Análise Social, Vol. 212 (3), pp. 534-566.
Carmo, R. M. (ed.) (2010), Desigualdades Sociais 2010. Estudos e Indicadores, Lisboa: Editora Mundos Sociais
Carmo, R. M., M. Carvalho, and F. Cantante (2015), “The Persistence of Class Inequality: The Portuguese Labour Force at the Turn of the Millennium”, Sociological Research Online, 20 (4), 16, pp. 1-17.
Costa, A.F., R. Mauritti, S.C. Martins. N. Nunes, A. L. Romão, (2015), “A constituição de um espaço europeu de desigualdades”, Observatório das Desigualdades e-Working Papers, N.º 1/2015: 1-21.
Dubet, F. (2010), Les Places et les Chances. Repenser la Justice Sociale, Paris: La République des Idées/Seuil.
Förster, M. and Whiteford, P. (2009), ‘How much redistribution do welfare states achieve? The role of cash transfers and household taxes’, CESifo DICE Report 3/2.
26
Horn, G., Dröge, K., Sturn, S., Van Treeck, T. and Zwiener, R. (2009), ‘From the financial crisis to the world economic crisis. The role of inequality’, IMK Report No. 41, Düsseldorf, Hans-Böckler-Stiftung.
Joumard, I., Pisu, M. and Bloch, D. (2012), ‘Less income inequality and more growth – are they compatible? Part 3. income redistribution via taxes and transfers across OECD countries’, OECD Economics Department Working Papers, No. 926, OECD Publishing. Krugman, P. (2007), The Conscience of a Liberal, New York: W. W. Norton & Company. Martins, S. C., Nunes, N. Mauritti, R. and Costa A. F. (2014), "O que nos dizem as desigualdades educacionais sobre as outras desigualdades? Uma perspetiva comparada à escala europeia”, in B. Portugal e Melo et al (eds.), Entre Crise e Euforia: Práticas e políticas educativas no Brasil e em Portugal, Porto: FLUP, pp. 845-868. OECD (2012), ‘Income inequality and growth: The role of taxes and transfers’, OECD Economics Department Policy Notes, No. 9.
OECD (2011), Divided We Stand. Why Inequality Keeps Rising, Paris: OECD Publications. OECD (2008), Growing Unequal? Income Distribution and Poverty in OECD Countries, Paris: OECD Publications.
Piketty, T. (2001), Les Hauts Revenu en France aux XXe Siècle: Inegalités et Redistribution 1908-1998, Paris: Bernard Grasset.
Piketty, T. and Saez, E. (2003), ‘Income Inequality in the United States, 1913-1998’, Quarterly Journal of Economics, 118: 1, pp. 1-39.
Piketty, T. and Saez, E. (2007), ‘Income and wage inequality in the United States, 1913-2002’, in A. B. Atkinson and T. Piketty (Eds.), Top Incomes Over the Twentieth Century, Oxford University Press: New York, pp. 141-225.
Piketty (2013), Le Capital aux XXI Siècle, Paris : Seuil.
27
Rodrigues, C. F. (Coord.), Figueiras, R. and Junqueira, V. (2012), Desigualdade Económica em Portugal, Lisboa: FFMS.
Rodrigues, C. F. (2007), Distribuição do Rendimento, Desigualdade e Pobreza. Portugal nos Anos 90 (Colecção Económicas, Série II, Nº 5), Coimbra: Almedina.
Saez, E. (2013a), ‘Striking it richer: the evolution of top incomes in the United States (updated with 2011 estimates)’.
Saez, E. (2013b), ‘Striking it richer: the evolution of top incomes in the United States (updated with 2012 preliminary estimates)’.
Stiglitz, J. E. (2012), The Price of Inequality, W. W. Norton &Company: New York.
UNDP (2013), Human Development Report 2013. The Rise of the South: Human Progress in a Diverse World, Hampshire: Palgrave Macmillan.
Wilkinson, R. And Pickett, K. (2009), The Spirit Level. Why More Equal Societies Almost Always do Better, London: Allen Lane/Penguin Books.