The role of creative industries and governance for cities’
competitiveness:
The case of Lisbon and Barcelona
Isabel Salavisa
Cristina Latoeira
Ana Roldão
Dezembro 2009
WP nº 2009/81
DOCUMENTO DE TRABALHO WORKING PAPERT
T
h
h
e
e
r
r
o
o
l
l
e
e
o
o
f
f
c
c
r
r
e
e
a
a
t
t
i
i
v
v
e
e
i
i
n
n
d
d
u
u
s
s
t
t
r
r
i
i
e
e
s
s
a
a
n
n
d
d
g
g
o
o
v
v
e
e
r
r
n
n
a
a
n
n
c
c
e
e
f
f
o
o
r
r
c
c
i
i
t
t
i
i
e
e
s
s
’
’
c
c
o
o
m
m
p
p
e
e
t
t
i
i
t
t
i
i
v
v
e
e
n
n
e
e
s
s
s
s
:
:
T
T
h
h
e
e
c
c
a
a
s
s
e
e
o
o
f
f
L
L
i
i
s
s
b
b
o
o
n
n
a
a
n
n
d
d
B
B
a
a
r
r
c
c
e
e
l
l
o
o
n
n
a
a
I IssaabbeellSSaallaavviissaa** C CrriissttiinnaaLLaattooeeiirraa** A AnnaaRRoollddããoo**W
W
P
P
n
n
º
º
2
2
0
0
0
0
9
9
/
/
8
8
1
1
D
D
e
e
z
z
e
e
m
m
b
b
r
r
o
o
d
d
e
e
2
2
0
0
0
0
9
9
*ISCTE-IUL, DINÂMIA-CET, Lisbon, www.dinamiacet.iscte.pt Email: [email protected].
A
A
b
b
s
s
t
t
r
r
a
a
c
c
t
t
1
1
.
.
T
T
E
E
R
R
R
R
I
I
T
T
O
O
R
R
I
I
A
A
L
L
C
C
O
O
M
M
P
P
E
E
T
T
I
I
T
T
I
I
V
V
E
E
N
N
E
E
S
S
S
S
–
–
A
A
R
R
E
E
V
V
I
I
E
E
W
W
332
2
.
.
T
T
H
H
E
E
C
C
O
O
M
M
P
P
E
E
T
T
I
I
T
T
I
I
V
V
E
E
A
A
D
D
V
V
A
A
N
N
T
T
A
A
G
G
E
E
S
S
O
O
F
F
B
B
A
A
R
R
C
C
E
E
L
L
O
O
N
N
A
A
A
A
N
N
D
D
L
L
I
I
S
S
B
B
O
O
N
N
77 2 2..11 AANNOOVVEERRVVIIEEWW 77 2 2..22 CCOOMMPPEETTIITTIIVVEENNEESSSS 99 2 2..33 HHUUMMAANNCCAAPPIITTAALL 1111 2 2..44 IINNNNOOVVAATTIIOONNAANNDDKKNNOOWWLLEEDDGGEESSOOCCIIEETTYYIINNDDIICCAATTOORRSS 1122 2 2..55IINNFFRRAASSTTRRUUCCTTUURREESS,,QQUUAALLIITTYYOOFFLLIIFFEEAANNDDAATTTTRRAACCTTIIVVEENNEESSSS 1155 2 2..66TTHHEEIINNTTEERRNNAATTIIOONNAALLSSTTAANNDDIINNGG 11663
3
.
.
C
C
R
R
E
E
A
A
T
T
I
I
V
V
I
I
T
T
Y
Y
A
A
N
N
D
D
C
C
I
I
T
T
I
I
E
E
S
S
’
’
C
C
O
O
M
M
P
P
E
E
T
T
I
I
T
T
I
I
V
V
E
E
N
N
E
E
S
S
S
S
1199 3 3..11TTHHEEIIMMPPOORRTTAANNCCEEOOFFCCRREEAATTIIVVIITTYY 1199 3 3..22CCRREEAATTIIVVIITTYYIINNLLIISSBBOONNAANNDDBBAARRCCEELLOONNAA––AANNOOVVEERRVVIIEEWW 22004
4
.
.
G
G
O
O
V
V
E
E
R
R
N
N
A
A
N
N
C
C
E
E
F
F
O
O
R
R
R
R
E
E
G
G
I
I
O
O
N
N
A
A
L
L
C
C
O
O
M
M
P
P
E
E
T
T
I
I
T
T
I
I
V
V
E
E
N
N
E
E
S
S
S
S
2233 4 4..11GGOOVVEERRNNAANNCCEE 2233 4 4..22AANNAALLYYSSIINNGGLLIISSBBOONNAANNDDBBAARRCCEELLOONNAAGGOOVVEERRNNAANNCCEEDDYYNNAAMMIICCSS 22445
5
.
.
F
F
I
I
N
N
A
A
L
L
R
R
E
E
M
M
A
A
R
R
K
K
S
S
2299R
R
E
E
F
F
E
E
R
R
E
E
N
N
C
C
E
E
S
S
33002
T
T
h
h
e
e
r
r
o
o
l
l
e
e
o
o
f
f
c
c
r
r
e
e
a
a
t
t
i
i
v
v
e
e
i
i
n
n
d
d
u
u
s
s
t
t
r
r
i
i
e
e
s
s
a
a
n
n
d
d
g
g
o
o
v
v
e
e
r
r
n
n
a
a
n
n
c
c
e
e
f
f
o
o
r
r
c
c
i
i
t
t
i
i
e
e
s
s
’
’
c
c
o
o
m
m
p
p
e
e
t
t
i
i
t
t
i
i
v
v
e
e
n
n
e
e
s
s
s
s
:
:
t
t
h
h
e
e
c
c
a
a
s
s
e
e
o
o
f
f
L
L
i
i
s
s
b
b
o
o
n
n
a
a
n
n
d
d
B
B
a
a
r
r
c
c
e
e
l
l
o
o
n
n
a
a
11A
A
b
b
s
s
t
t
r
r
a
a
c
c
t
t
:
:
This paper analyses and compares the competitiveness dynamics of two metropolitan areas: Lisbon and Barcelona and the specific role of creative activities and governance in those dynamics.
Its aim is to improve our knowledge about the nexus governance-competitiveness-creativity in those regions, in order to contribute to formulate strategic guidelines for policymaking and urban governance. At a further stage, they might support cities’ competitiveness and urban vitality, in the context of current global shifts.
Competitiveness is considered as a complex concept requiring a multidimensional approach. Thus, we have developed an analytical model that includes six main dimensions: human capital; innovation; entrepreneurship and creativity; infrastructures and quality of life; attractiveness and national and international networks; and governance entities and forms. Each dimension includes a set of variables. Different methods and sources were used for data collection, including case studies, experts’ interviews, strategic and spatial plans and statistical databases. Data will be analysed with a set of diverse techniques, both qualitative and quantitative.
Among all dimensions that have an impact on urban competitiveness/attractiveness, we will try to identify and isolate the specific contribution of creative activities and governance forms and strategies for the different dynamics of the two urban areas. A particular emphasis will be put on: a) knowledge intensive sectors and their creative and innovative dimensions, which appear as quite connected; b) the impact of different governance levels and public policies on urban competitiveness.
K
K
e
e
y
y
w
w
o
o
r
r
d
d
s
s
:
:
urban competitiveness, creative industries, innovation, governance1Paper presented at the International Conference on “Creative Economy: Options for the Regulation/Governance of
European Metropolitan Regions”, Leipzig, November 12-13, 2009.This research has been undertaken within a project called “CreatCity – a Governance Culture for the Creative City: urban vitality and international networks” (PTDC/AUR/65885/2006, funded by the Portuguese Science Foundation), which analyses the governance strategies of creative activities in three metropolitan areas (Lisbon - Portugal, Barcelona – Spain and S. Paulo - Brazil) and has been carried out by an international and multidisciplinary team. The authors gratefully acknowledge the contribution of Ricardo Migueis, namely to section 4 on governance for regional competitiveness.
1. TERRITORIAL COMPETITIVENESS – A REVIEW
The concept of territorial competitiveness has evolved over time but has not reached a consensus among scholars and policy makers, except for the fact that it is a complex, multifaceted concept. It is a very generic notion (Budd and Hirmis, 2004) that is applied in many different circumstances, which, sometimes, originates several misunderstandings (Porter, 2004). Many authors refer that it is hard to define it theoretically and analytically (Budd and Hirmis; 2004, Huggins, 2003; Seixas, 2005), because it integrates many dimensions. Furthermore, it is informed by the comparative principle, which creates more difficulties and less objectiveness.
Thus, as this paper aims to provide a competitiveness analytical model, it is vital to make a short summary of the concept’s evolution and analyse the different criteria used to define it. However, right from the start, it is important to realise that this is a complex task and that there are no automatic mechanisms to stimulate competitiveness. Moreover, there is no single model (Landry, 2000) and all the devices aiming to improve competitiveness have to deal with the endogenous characteristics of the specific places.
The idea of competition between places (countries, cities, regions) in this globalised era, which is characterized by a great mobility of human, scientific and technological resources, was brought into the academic sphere by Michael Porter’s book, “The competitive advantage of nations” (Porter, 1990). Since then, he emphasised this idea. In fact, local aspects seem to have become more important than in the past in a globalised world (the “location paradox”). Elements that can be sourced from distant locations are neutralised as a competitive advantage and what remains as specific competitive factors are those that are embedded. He writes: “...paradoxically, the most enduring competitive advantages in a global economy seem to be local” (Porter, 2000) (see also Boschma, 2004).
But this concept provokes controversial opinions. For Krugman, for instance (quoted by Lever and Turok, 1999 and by Begg, 1999), countries, regions or cities do not compete with each other: they are only places where companies operate. According to him, competitiveness is only effective between companies, and is based essentially on internal factors (resources, goods or services provided, innovation, quality, customer satisfaction, branding, marketing, negotiation capacity, etc.). This line of argument was disputed by some researchers (Camagni, 2002).
To Porter (1990), however, competitiveness is a result of two different economic perspectives: a micro and a macro one. The former is related to the companies’ capacity to create wealth. The latter is connected to institutional and policy conditions that companies have to face. According to his approach, micro perspectives are the ones that determine if a territory is competitive. However, the contextual
4
features are also important, since they can bring investment, people, public funds and events, and because they attract qualified workers, efficient infrastructures and the like (Porter, 2004).
Contrarily, Camagni, an author that has studied this subject extensively, argues that competitiveness is not achieved only throughthe companies’ performance, but mainly as the result of the environment and the mechanisms that the territory provides for that performance. Knowledge, decision models and cooperation schemes also play a role (Camagni, 2002).
To Turok (2004), companies’ competitiveness and places’ competitiveness cannot be compared, since they compete through very different aspects. It is possible to predict that territories that lag behind are likely to end up into decline. However, territorial areas cannot shut down as companies do. Besides, territorial changes are always much more complex and take longer than changes that affect companies.
As to the IMD2 and Rogerson (1999, quoted in Shen, 2004) and Malecki (2001), companies and territorial competitiveness are related and are interdependent, but the latter represents a broader concept. In fact, it includes the capacity of the economy and of the local society to improve the general quality of life.
Therefore, we can put forward some definitions, such as:
For OCDE, 1996 (quoted by Begg, 1999), competitiveness is “the degree to which, under free and fair market conditions, a place can produce goods and services which meet the test of international markets, while simultaneously maintaining and expanding the real incomes of its people over the long term”.
Dionízio (2000: 31) gives us a definition that takes into account the territorial endogenous capacity to generate initiatives, together with the economic, social and environmental development models. He emphasises the role of economic, political and social strategies that focus on the region’s potential and constraints.
The factors underlying competitiveness are also complex and are considered in a different light by different authors.
Lopes (2001) states three dimensions:
2The IMD World Competitiveness Yearbook (WCY) is the world’s most renowned annual report on nations’
competitiveness. It ranks and analyses how a nation’s environment creates and sustains the competitiveness of enterprises.
- The local pattern of comparative advantages of the local economy (competitiveness factors associated to the economic structure of the territory, such as natural resources, labour, clustering, density and efficiency of the commercial networks);
- The dynamics of local production (business and local community potential and synergies of local productive organisation, which involves the capacity for entrepreneurship);
- The conditions for territorial integration into the global economy (how the local comparative advantages are linked to the regional, national and global economic dynamics).
According to Dionízio (2000), competitiveness is the product of the following elements: human resources (considering the activity rate, the employment rate and the aging rate); the labour market; immaterial investment (R&D) and global productivity (related to technology, innovation, investment and flexibility).
If some authors are too focused on the productivity factor, others underline the importance of the quality of life. A study by the European Commission (see Begg, 1999) presents a pyramid of competitiveness where, on the top, we have the quality of life (which is a result of the productivity and employment rates). Huggins (2003) defends that the real local competitiveness occurs only when economic growth translates itself into job creation and the improvement of living standards.
Seixas (2005) argues that it is not possible to restrict territorial competitiveness to a microeconomic point of view. In fact, it should encompass cultural, social and economic territorial areas and take into account the external exchanges, the capacity to implement new technology, the innovative potential and also knowledge and competences renewal. According to this author (2005:31), territorial competitiveness can be represented by a pyramid that includes the following levels: quality of life (GDP per capita), human resources (activity rate, employment, demography, dynamics of labour market, qualifications) and productivity.
Besides, many references point out the importance of another concept: attractiveness (Camagni and Capello, 2005), which means “the capacity of an area to attract production activities on its territory, by offering an efficient service and infrastructure endowment, an attractive natural and social environment, an advanced and modern production structure”. In this context, marketing emerges as a valuable tool to increase that capacity when associated to spatial strategic plans (Turok, 2004). It is imperative to highlight that a city’s competitiveness is not reached by a marketing strategy merely focused on the city’s promotion. This strategy has to be oriented in a broad way to modify the behaviour of current and potential clients in the long term (Berg and Braun, 1999).
6
Nowadays, many factors are seen as increasingly important, as central elements for a competitive city or region. These factors are:
- Social infrastructures and equipments, cultural activities, environmental conditions of the neighbourhoods, natural environment (Lopes, 2001; Florida, 2002; Turok, 2004; Kresl, 1995, quoted by Malecki, 2001);
- Social tolerance and territorial organisation (Turok, 2004);
- Identity, history, social cohesion and the absence of conflicts (Conti and Giaccaria, 2001);
- National and international standing in areas such as transportation, communication, electricity and water supply (Jensen-Butler, 1997, quoted by Shen, 2004);
- Climate, criminality, housing, mobility, heritage, purchasing power, pollution, services (Mendes, 1999, quoted by Mourão, 2006 et al).
In a document issued by DPP (Martins, 2007), territorial competitiveness has to include:
- The formation and attraction of innovative and internationally competitive enterprises and the creation of the right conditions for those companies to stay;
- The activities of universities and other research institutions, the training of human capital (including the attraction and subsequent inflow of international students), knowledge creation and its relationship with the production environment;
- The provision of amenities (health, education, culture, leisure, trade, human diversity, landscape, clean and safe environment), infrastructures connection (physical and digital) and a regulatory framework (administrative and fiscal), which could produce attractive conditions of life, work and business as well as the attraction of visitors;
- The combination of those elements in creating a unique territorial and brand image.
It is essential to refer that the concept of competitiveness cannot be separated from the concept of sustainability (Martins, 2007:2). As it is pointed out by many authors (Turok, 2004; Mourão et al, 2006; Lever, 1999; Shen, 2004), competitiveness does not constitute an end in itself, since it should create prosperity in the long term and it should produce longstanding and structural results (Lopes, 2001). Furthermore, if it is important for cities to offer conditions for competitiveness, in terms of productive activities and attraction of events and talents, it is also essential that they are sustainable from the economic, ecological and social point of view (Martins, 2007:3). In this sense, planning and management strategies, with appropriate solutions to the reality, are fundamental for a sustainable growth.
We can see, in this context, the emergence of the large connection between competitiveness, innovation, R&D and knowledge, related to the great importance of high technology in the present
economy (Lopes, 2001; Begg, 1999; Hemlin et al, 2008). Nowadays, these are crucial factors for competitiveness. Moreover, it is fundamental to stress the importance of governance, which will be discussed further in the paper.
2. THE COMPETITIVE ADVANTAGES OF BARCELONA AND LISBON
2.1 An overview
Barcelona is the second largest city in Spain and the economic, cultural and administrative capital of Catalonia, an Autonomous Community within the Spanish State. Lisbon is the Portuguese capital city. Both are European Southern cities and in fact that have much in common, but also many diverse traits and a very different history. History is always singular as well as geography. But we will show that while keeping their specificity in some aspects, they have converged in regard to competitive attributes and paths. In this paper we are focusing on their metropolitan areas3 with a population of 4.9 million in Barcelona and 2.8 million in Lisbon (table 1) and an area of, respectively, 3242 and 2963 km2,which means a much higher human density in Barcelona.
Besides size, the first striking contrast refers to the demographic dynamics, slightly above 5% in each of the two previous decades in Lisbon metropolitan area (MA), but leaping from 3 to 12% in Barcelona metropolitan area (MA). This is an elementary symptom of a stronger economic dynamics in Barcelona, which might be contradicted at a closer inspection.
Table 1
Total population, area and density in Lisbon and Barcelona metropolitan areas
Lisbon MA Barcelona MA
Population Growth (%) Area Km2 Density Population Growth (%) Area Km2 Density 1991 2 520 708 - 2 962.6 850.84 4 264 422 - 3 241.54 315.55 1 2001 2 661 850 5.6% 2 962.6 898.48 4 390 413 3.0% 3 241.54 354.42 1 2008* 2 808 414 5.5% 2 962.6 948 4 928 852 12.3% 3 241.54 1 521 Source: INE and IDESCAT.
* 2007 for Lisbon
3Lisbon Metropolitan Area consists of 2 statistical geographic units, Grande Lisboa and Peninsula de Setubal, with
18 municipalities in total. Barcelona Metropolitan Area corresponds to the so-called Ambito Metropolitano de Barcelona and consists of 7 “comarcas”, encompassing 164 municipalities, which are smaller entities than the homonymous ones in Portugal.
8
Another relevant aspect is the contrasted demographic paths of the cities themselves: a sharp decline of Lisbon, against the Barcelona’s stability in the last two decades (table 2).
Table 2
Total population, area and density in the cities of Lisbon and Barcelona
Lisbon city Barcelona city
Population Growth (%) Area Km2 Density Population Growth (%) Area Km2 Density 1991 663 394 - 84.6 7 841.54 1 643 542 - 101.4 16 208.50 2001 564 657 -14.88 84.6 674.43 6 1 505 325 -8.41 101.4 14 845.41 2008* 499 700 -11.50 84.6 906.62 5 1 615 908 7.35 101.4 15 935.98 Source: INE.es, IDESCAT; INE.pt.
*2007 for Lisbon
Barcelona, in fact, after historically pioneering the industrialization process of Spain – and still is the country’s major industrial area, particularly in the automotive, machinery, metal products, transport materials, pharmaceuticals, chemicals and consumer electronics sectors -, has undergone a severe process of deindustrialisation that affected particularly scale intensive industries in the 1960s and 1970s. As a consequence, Barcelona turned to services, and pursued a process of industrial restructuring with relocation of production and population into the metropolitan rings. This has entailed not a classical conurbation process of growth, but on the contrary it gave rise to a number of important urban nucleuses around the city. While the city continued to grow in population, its share decreased from more than 80% to 50% of its total metropolitan area, during the second half of the XX century.
A parallel process of reorganisation took place in Lisbon MA, but with many different features: first, the city lost population (and economic activities) in absolute terms to its outskirts; second, the process took place mainly as an unstructured spread of dwellings and industrial facilities, with an ex-post process of territorial planning and re-urbanization; third, the metropolitan area grew at a lower rate than the one of Barcelona MA.
Tertiarisation is common to both MA, as shown in table 3, but is more obvious in Lisbon, as expected. In fact, because of their different roles in national state structures, Lisbon relies much more on central administration agencies (and employment) than Barcelona. This is probably why it has not suffered so severely from deindustrialization – although Peninsula de Setúbal, in its metropolitan area,
did suffer from a long downturn, associated with the decline of steel, basic organic chemicals, shipbuilding and other scale intensive industries, from which it has never fully recovered4 .
Table 3
Employment by sector (1991-2007) (percentage)
Lisbon MA Barcelona
Total Primary (%) Secondary (%) Tertiary (%) Total Primary (%) Secondary (%) Tertiary (%)
1991 1 115 677 1.73 28.3 69.96 1 579 805 0.97 42.90 54.36
2001 1 284 673 1.14 24.07 74.79 1 951 615 0.8 36.16 64.47
2007 1 305 600 1.16 21.68 77.18 - - - -
Source: INE and IDESCAT.
As to the demography, we must still point out some aspects. As a first common element, we stress the ageing trend of the population of both metropolises, with the steady decline of the young people (below 14 years old) over the past two decades - from around 18% to around 15% of total population in both MA –, along with the increase of the eldest (over 65), that represent 17% and 16% in Lisbon and Barcelona, respectively. As a consequence, the youth indicator5 declined from 147 to 94, between 1991 and 2008, in Lisbon (and from 130 to 90, in Barcelona). As a second element, both areas receive important flows of immigration, from different countries however. Immigrants are not only a contribution to the renewal of the labour force, but they also are the vehicles of other cultures and ways of living, that have contributed to transform both metropolises in cosmopolitan areas.
2.2 Competitiveness
According to many definitions, the competitiveness of regions is intimately connected to their capacity to create wealth in a sustainable way. We can see from table 4 that, in 2007, the level of GDP per capita was much higher in Catalonia – in the absence of data for Barcelona MA - than in Lisbon (27840 and 21347 Euros per inhabitant, respectively, at current prices). Another huge difference between the two regions is that while Lisbon strongly outperformed the Portuguese average (by 36%), Catalonia’s figure was only 19% higher than that of Spain.
4 A further generation of industrial investment, most of all international investment, gave rise to an important
automotive cluster. Other important industries are mineral products (cement) and electrical and electronic appliances and components.
10
Taking the EU as a reference, and revising GDP per capita to account for differences of purchasing power parity across countries, we find that Spain outperformed the EU-27 average, while Portugal’s GDP per inhabitant was only 76% of the European one. Table 4 also shows that Lisbon MA and Catalonia were above the European average by around 3% and 23%, respectively, in 2007. In both cases, the two regions are medium wealthy regions in the European context, but Catalonia level of wealth per inhabitant is higher than that of Lisbon MA (32.3 thousand Euros in PPS and 26.9 thousand Euros, respectively).
Table 4
GDP per inhabitant (2007)
Source: Eurostat.
Note: * Not available for Barcelona MA. ** Computed by the authors.
We are going to take into account four different types of competitiveness factors: the quality of human capital; the innovation and knowledge society performance; the infrastructures and quality of life in general, including the elements related to the natural and built environment; and the regional and international attractiveness and connectivity.
Lisbon
MA Catalonia * Portugal Spain EU 15 EU-27 GDP, in million Euros, current prices 59 644 197 254 163 100 1 053 000 11 495 000 12 364 000 Population, in millions 2.794 7.085 10.608 44.874 393.094 496.370 GDP per capita, at current prices, Euros 21 347** 27 840** 15 696** 23 466** 29 249** 24 908** GDP at market prices, at current prices, Euros/PPS per inhabitant (EU15=100) 26 871** 32 290** 19 802** 27 553** 29 249** 26 207**
2.3 Human capital
The quality of human resources is the major factor underlying competitiveness and wealth creation in a knowledge society. However, this is not an element that favours the two areas comparing to the most advanced countries. In Barcelona, in 2001, 56% of adult population had the lower secondary education as the highest level obtained, which means 10 years schooling or less, while in Lisbon the equivalent figure was 64% (for 9 years schooling or less) (table 5). Also in Barcelona, vocational training represented 13% (both lower and upper vocational training, the latter being in fact non-tertiary post secondary education), while higher secondary level accounted for 13% and tertiary education 19% of adult population. In Lisbon, where there was no significant formal vocational education by then (only 1.2% of non tertiary post secondary schooling), upper secondary represented 19% and tertiary education 16% of total adults. This means that those with at least 12 years of schooling represented 38% of total adults in Barcelona (including the 6.5% that received upper vocational training) and 36%, in Lisbon, which is certainly a poor performance in the context of advanced countries, where the equivalent figure is ¾ or more of adult population. Although it is certain that these indicators have improved since 2001, they still represent a serious handicap for both metropolises.
Table 5
Educational level in Barcelona MA of adult population (25 to 64 years old) (2001)
Total adult population (25 to 64
years) No formal level Primary level*
Lower Secondary **
Lower Vocational
Training Upper Secondary Non- Tertiary post
secondary Tertiary education 2 478 627 224 073 468 938 683 345 158 854 313 745 161 232** 468 440 Barcelona MA 100.00% 9.0% 18.9% 27.6% 6.4% 12.7% 6.5% 18.9% 1 488 777 118 759 568 539 265 454 - 279 248 17 281 239 496 Lisbon MA 100.00% 8.0% 38.2% 17.8% - 18.8% 1.2% 16.1%
Source: INE; IDESCAT.
Notes: * Primary level consists of 6 years schooling; ** Lower Secondary corresponds to 9 years in Portugal and 10 years in Spain. ** It is the Upper Vocational Training.
The same phenomenon can be approached by analysing the level of qualification of the employed population (see table 6). Similarity between the two areas is a striking feature, the major difference being the larger proportion of manufacturing workers (plant and machine operators) in Barcelona, and of clerks, in Lisbon, which is understandable in the light of the central administrative function played by the latter and the industrial tradition of the former. Another difference is the importance of unskilled
12
workers, who were much more relevant in Lisbon MA than in Barcelona MA (15% against 10%). But a closer inspection of the data reveals an even more important aspect that is common to both areas: the meagre proportion of the two first groups (legislators. senior officials and managers; and professionals). Professionals, who represent only around 12% in the two areas, encompass all the creative highly skilled professionals6. This means that at least according to our data, creative professions are not very significant in both metropolitan areas, in 2001.
Table 6
Employed population, according to the national classification of occupations (CNP) (2001) (percentage) Total CNP1 CNP2 CNP3 CNP4 CNP5 CNP6 CNP7 CNP8 CNP9 Lisbon MA 1 284 673 7.54 12.04 12.97 14.88 15.74 0.91 14.49 5.44 14.88 Barcelona MA 1 965 394 8.64 12.69 14.24 11.45 14.56 0.64 15.91 12.25 9.62 Source: INE and IDESCAT.
Definitions: 1. Legislators, senior officials and managers; 2. Professionals; 3. Technicians and associate professionals; 4. Clerks; 5. Service workers and shop and market sales workers; 6. Skilled agricultural and fishery workers; 7. Craft and related trades workers; 8. Plant and machine operators and assemblers; 9. Elementary occupations.
We may conclude that human capital is not a major competitive attribute of both MA, at least when we take the most advanced countries as a reference. We now turn to innovation and knowledge society dimensions, as measured by a few conventional indicators.
2.4 Innovation and knowledge society indicators
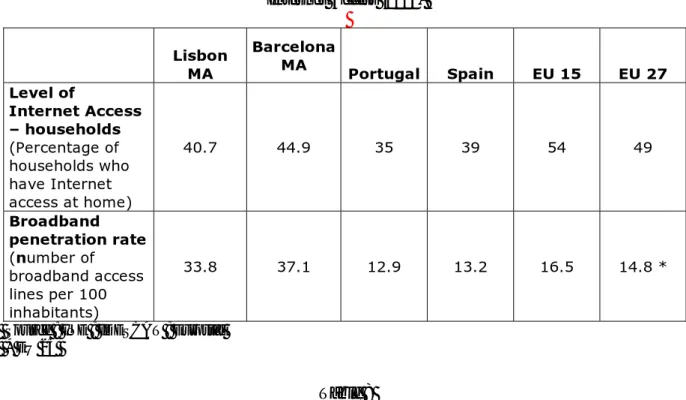
Both metropolises are below the European average in regard to most innovation and knowledge society indicators, with the remarkable exception of the broadband penetration rate where both exhibit a notable performance (table 7). Connectedness to high speed networks is also well above the respective national rates, meaning that there exists a strong inequality across countries in what concerns the use of broadband Internet. Again, the levels of the two MA are very similar.
As to R&D, a usual proxy of innovative performance, although both areas perform better that their respective countries, they still remain below the European average and very far from the leading
6According to the 1988 ISCO (international Standard Classification of Occupations) definition of professionals: “This
major group includes occupations whose main tasks require a high level of professional knowledge and experience in the fields of physical and life sciences, or social sciences and humanities. The main tasks consist of increasing the existing stock of knowledge, applying scientific and artistic concepts and theories to the solution of problems, and teaching about the foregoing in a systematic manner. Most occupations in this major group require skills at the fourth ISCO skill level”.
countries, which devote more than 2.5% of GDP to research and development (Sweden, Finland, Denmark, Germany, Austria, Switzerland, Iceland, Japan and the USA). However, the picture is moving so fast, that we would need to go deeper into the analysis, namely through the characterisation of the catching up process pursued by Portugal, in regard to scientific and technological achievements, in recent years.
Looking at table 8, we see that Lisbon region responds for half of the Portuguese researchers, which is a symptom of the huge polarisation of (scientific) resources around the capital city. This is not the case in Barcelona MA (Catalonia represented less than one quarter of Spain’s researchers).
We can add that most domestic science and technology parks are located in our two regions. Lisbon MA hosts Tagus Park, Madan Parque, Lisbon Technopolis and two important private foundations with research facilities (Gulbenkian and Champalimaud Foundations7), besides a large number of research centres or laboratories connected to public universities. Barcelona MA, in turn, has eight science and technology parks and more than one hundred research institutes, while Catalonia comes first among all Spanish autonomous communities in the number of research institutions and S&T parks. One of its success cases is the emerging cluster of biomedical research in L’Hospitalet that is likely to develop in connection with the chemical industry located in the region.
Another case in point is that of 22@, that corresponds to the reconversion of an area of around 100 ha. in Poublenou (formerly dedicated to industrial usage), into a neighbourhood that hosts ICT firms and other knowledge-intensive activities. This operation has been conducted by Barcelona county authorities and, in 2006, involved more than two hundred enterprises (table 9). Barcelona Activa and Barcelona Innova, county agencies for local development and innovation, have also promoted initiatives aiming at the support of entrepreneurship, innovation and diffusion of new technologies.
Universities are major players in this game. In fact, much of the research is carried out in their laboratories and institutes or in research centres that have close ties with them. Large universities stand side by side with medium and small ones, but excellence is irrespective of size. In Barcelona, for instance, Pompeu Fabra University (with around 10 000 students only) has been recognized as an example of high quality by international standards. In Lisbon, engineering degrees offered by a large technical institute - Instituto Superior Técnico - have obtained a high international reputation. So, among Barcelona Universities8 and Lisbon Universities9, Polytechnics Institutes and other independent higher
7 While the recent Champalimaud Foundation is focused on life sciences research, Calouste Gulbenkian Foundation –
one of the largest foundations in Europe - spreads its activities across a number of domains, both through funding outdoor activities and directly performing others, among which stands a reputed scientific research institute.
8 University of Barcelona, the largest one, has a student population in excess of 200 000; Autonomous University
of Barcelona; Open University of Barcelona; Polytechnic University of Barcelona; Ramon Llul University; Pompeu Fabra University; International University of Catalonia; and University Abat Oliva CEU. The latter two are private while the others are public universities.
14
studies institutions there are domains of excellence in teaching and research that will help the host regions to leap forward in the future.
Table 7 Internet Access (2006) Lisbon MA Barcelona MA Portugal Spain EU 15 EU 27 Level of Internet Access – households (Percentage of households who have Internet access at home) 40.7 44.9 35 39 54 49 Broadband penetration rate (number of broadband access lines per 100 inhabitants) 33.8 37.1 12.9 13.2 16.5 14.8 *
Source : INE ; IDESCAT ; Eurostat * EU 25
Table 8
Research & Development (2007)
Lisbon MA Catalonia* Portugal Spain EU euro zone EU 27 GERD (% of GDP) 1,76 (2008) 1,48 1,21 1,27 1,87 1,85 Total researchers (FTE) 14188 25 063 27 986 122 624 949 793 1 355 680 Total personnel in R&D (FTE) 17 438 43 037 35 333 193 024 (2006) 1 401 980 2 016 341 Source: Eurostat ; IPCTN07, GPEARI / MCTES; IDESCAT; INE.
* Not available for Barcelona MA. ** Computed by the authors.
9 Public universities in Lisbon metropolitan area are: University of Lisbon; Technical University of Lisbon; New
University of Lisbon; ISCTE - Lisbon University Institute; and Open University. Main private universities are: Autonomous University; Lusófona University; Lusíada University; Atlântica University; and Catholic University. There are also a few public Polytechnic Institutes (Lisbon and Setúbal) and a number of other private higher studies institutions.
Table 9
Firms in 22@, Barcelona, by sector (2006)
ICT 83
Media, marketing and communication 34
Biomedical 9 Energy 11 Education 6 Institutions for the promotion of economic
activities 8
Other institutions and services 10
Public administration, construction and
architecture 19
Finance and insurance 24
Fashion 8 Food and beverages, hotels and restaurants 23
Transportation 3
Other 19 TOTAL 257 Source: www.22barcelona.com.
2.5 Infrastructures, quality of life and attractiveness
In a certain way, it is misleading to rely only upon indicators such as the number of cinemas, theatres, museums, art galleries, libraries and so on, to characterise the cultural life of a city. Those figures are with no doubt important to outline the cultural dynamics of the regions, but they represent only a part of the whole picture. We also have to collect data on the dynamics and on the level of the activities that take place in those venues. As to the dynamics, we have to know the effective use of those venues (number of events, number of users or attendants). As to the level, we have to obtain qualitative information on the content of the activities they host, namely, in regard to the performing arts, the temporary art exhibitions, the museums’ collections, the libraries’ funds and organisation, etc.
Both metropolises have a large provision of cultural facilities and a relevant offer of cultural events. Barcelona, however, is much more inserted in the networks of international circulation of exhibitions and events than Lisbon, both as a producer and as a consumer of “imported” events. Furthermore, it has achieved to organise “hallmark” events, such as the 1992 Olympic Games, while
16
Lisbon has achieved to host the 1998 International Exhibition (1998 Expo), after having been the European Capital of Culture in 1994. Cities compete for those events, because they provide high visibility and a positive international image.
The quality of life is another major aspect in regard to competitiveness. Health facilities and services are provided in both metropolises, both public and private, at a high standard of quality. As to housing, both cities face the problem of a dramatic speculation at the historical centre, what has had severe consequences, mostly in Lisbon, where there has been a large depletion of population, together with the expansion of unqualified and not planned urban areas in the outskirts of the city, over the last decades The impact on environment is clear, since this urban model has boosted the use of private individual transport for daily commuting.
However, both metropolitan areas display natural advantages that have been the basis of their recent success as tourism destinations: geographical location by the sea (and a river, in Lisbon); mild climate; preserved historical centres; a large offer of cultural activities and of leisure facilities.
2.6 The international standing
At this point, we are turning to two significant elements: the international cities’ rankings published mainly by private consultants firms; and the international tourism rankings. As to the first, we have selected The European Cities Monitor that is based on the interviews to 500 senior executives from leading European companies and is published since the 1990. In its 2009 edition (European Cities Monitor, 2009), cities are ranked according to several criteria. According to the criterion “best cities to locate a business today”, Barcelona scores very well, appearing as number four of a list headed by London, Paris and Frankfurt (table 10), while Lisbon is just number 17.
When asked which city they think is doing the most to actually improve themselves, the leading European companies put Barcelona at the top of the list (table 11). According to other criteria, Barcelona also scored very well, while Lisbon stands mostly at an intermediate level.
Table 10
Best European cities to locate a business today
18
Table 11
Cities improving themselves
3. CREATIVITY AND CITIES’ COMPETITIVENESS
3.1 The importance of creativity
Creativity is gradually becoming a significant concept for the discussion about competitiveness. Authors such as Florida or Landry claim that creativity is essential in this new era. In fact, and according to the UE, creative industries represented already, in 2003, 2.6% of the European GDP and were responsible for the employment of 5.8 million people (Runge, 2009).
According to the UK Creative Industries Task Force (1997, quoted by Costa et al 2007a), and United Nations (Creative Economy Report 2008), creative and cultural sectors have a huge potential for the creation of welfare, employment, trade opportunities, social cohesion and community interaction through generation and trading of intellectual and creative property. For Landry (2000), the cultural sector has the largest growth at the world’s economy, which gives singularity and values heritage. Hall (2000) also believes that cultural creativity generates technological innovation and new industrial activities.
But, as it is referred by Seixas (2005), the prospects for boosting urban competitiveness do not automatically originate the promotion of urban creativity. However, a broader concept of competitiveness - including urban values now increasingly considered basic, such as quality of life, sustainability or ecological development - could be faced as considerably closer to the prospects of urban creativity, and vice versa.
Several concepts emerge related to this topic, such as: "cultural industries" (Adorno and Horkheimer, Towse), "creative industries" (Caves, DCMS), "creative cities" (Landry, Hall, Ebert), "creative class" (Florida), "creative Europe" (ERICArts), “cultural economy” (Scott) (quoted by Rato et al, 2009). None of these concepts has a consensual meaning. Therefore, we will try to contribute to clarify them.
Cultural and creative industries and sectors are related, even though they are not the same. Creative industries include heterogeneous sectors, from traditional arts, publishing, music, and visual and performing arts, to more technology-intensive and services-oriented groups of activities (film, television and radio broadcasting, new media and design) (United Nations, 2008). On the other hand, cultural industries according to UNESCO are those which “combine the creation, production and commercialisation of contents which are intangible and cultural in nature” (Throsby, 2001, p.89).
20
3.2 Creativity in Lisbon and Barcelona – an overview
First of all, it is important to underline that, in both metropolitan areas of Lisbon and Barcelona, creative and cultural activities have high rates of productivity, hence becoming significant sectors of the economy. They represent an important added value and also a relevant proportion in terms of employment (0.9% in Barcelona, according to the Department of Culture of the Catalonia’s Government, and 2.42% in the metropolitan area of Lisbon10) However, they are both below the average for Europe, which is 2.5% (2002).
But a creative city is obviously not only a place where these activities exhibit good performances. Rato et al (2009, p.3) emphasize a typology that synthesizes creative cities topics, originally developed by Costa et al (2007a), and based on three well-known approaches. The first approach addresses the creative cities and creativity as a toolkit for urban development (developed by Landry, 2000, who claims that creativity, conceived as the ability to develop creative solutions, plays a central role for urban dynamics in its various dimensions). The second approach is related to the recognition of the creative city as a city with strong dynamics, concerning the creative productive sector (concept explored by Pratt, 2004 and the Department for Culture, Media and Sport, of the UK). The third approach sees the creative city as a place which has the ability to attract creative competences, e.g. creative human resources (Florida, 2002), arguing that this attraction of creative classes (groups of people that give economic value for the city throughout creativity) is essential for the promotion of competitiveness and urban development.
Even in the absence of a consensus over the concept of creative cities, many authors agree that, for a city to turn into a creative city there are multiple elements which are fundamental, such as: people and activities’ density and diversity (to create critical mass); a liveliness atmosphere; valuable heritage and natural resources and a good level of amenities supply. Those elements are present in the regions of Lisbon and Barcelona. Both cities present the most favourable position within their respective countries.
However, there are other aspects which are considered weak points. These are related with the existence of a population that is not as qualified as the population of other major European capitals and with a problematic trend for population ageing. Furthermore, there are problems related with a less efficient spatial planning, which entail congestion or lack of public space. In Lisbon, these problems are being felt more severely (Costa, 2009).
10Data collected from INE, Censos 2001; and from Quadros de Pessoal, Gabinete de Estratégia e Planeamento,
For Florida, besides creating jobs and providing the necessary amenities, it is fundamental the creation of a climate of more tolerance, technology and talent (“The Rise of the Creative Class”, 2002)11. According to him (2004), for instance, in an analysis of these three aspects through a group of countries, Spain, and Portugal mainly, have very low positions in terms of talent (e.g. creative occupations in the total employment, average annual rate of change of creative occupation); tolerance (e.g. rankings of attitudes, values and self expression) and technology (e.g. innovation and R&D rates). He supports the idea that these two countries “will find hard to compete in the creative age” (Florida and Tinagli, 2004, p.38).
According to the Strategic Plan of Barcelona, however, Barcelona is a creative city which attracts artists from all around the world, particularly from Europe and South America. But, in fact, when compared with other European regions, it is not that attractive and the weight of qualified immigrants in the overall population is not very relevant (Musterd, 2004). Lisbon is also not as attractive as other cities and many local artists decided, at some point, to move, due to the lack of specialised higher education. Furthermore, there is, in both regions, a lack of appropriate locations for creation and experiment, in order to make it attractive for the artists to remain.
According to many authors (e.g. Markusen, quoted by Costa et al, 2007b), public authorities have been working in many directions to make the city more creative and attractive. Investing in big events (to create a place’s image) or in cultural or media industries, promoting the existence of gatekeepers, specific spaces for conviviality, network connections or creative neighbourhoods, (usually located in cities’ historical centres or old industrial districts) are some of the measures already taken (further ahead we will deal with how this is linked with urban governance).
In these two regions, these dynamics are being developed, even with different degrees of intensity and at different paces. Barcelona has cherished this sector for some time now, by developing many big events, such as the Olympic Games, in 1992, and the Cultural Forum, in 2004, which played a fundamental role on the diffusion of Barcelona’s image abroad and on the increase of tourism, while revitalising the city as well (in terms of infrastructures, public space qualifications, facilities, etc.). Moreover, the current Strategic Metropolitan Plan identifies the promotion of the cultural and creative sectors as two of the main strategic guidelines for the future of the city. Several other important events
11Some authors do not agree with Florida, arguing that this idea of great mobility of people is not that valid (social
and family relationships, for instance, prevent citizens from changing so easily) or that this theory of the openness of barriers and high people’s mobility can lead to the growth of marginalisation and unemployment. Robert Palmer is one of those that disagree with the idea of culture as a way for the improvement of economic performance and the increase of competitiveness, arguing that it is an ecosystem outside the economic sector, which requires the establishment of multidisciplinary and multi-sectoral relations.
22
have occurred, such as Gaudí 2002, thematic years, the libraries network, or the sponsorship of the Woody Allen’s movie (“Vicky, Cristina, Barcelona”).
At the same time, Barcelona’s government has been investing in the creation of autonomous agencies to promote arts, which work together with universities, artists and associations (example: Terminal B – a cultural platform; Disseny Hub Barcelona, created by the Cultural Institute of Cataluña, for the promotion of design). In territorial terms, one of the main examples is the 22@, an operation with the purpose of revamping an industrial and harbour area into a place with high technology companies but also with spaces for creative, leisure and cultural activities. In this area, there is a prime example of the conversion of disused industrial buildings into cultural and creative spaces: Palo Alto foundation. Moreover, some independent initiatives have met with favourable reception and they are increasingly playing a more important role at the creativity sphere (according to the Cultural Plan of Barcelona). Today, conditions are improving to support cultural and artistic production and the provision of the main cultural equipments is at a very good level.
In Lisbon, this potential is recognised as well and it is also translated into strategic plans and policies, but not with the same emphasis. In this context, one of the most important landmarks was the 1998 World Exhibition which, besides improving attractiveness, represented the leitmotiv to revitalise the city. Nowadays, many dynamics exist, both related to the public action or to private initiative, with different natures and scales, such as international festivals and exhibitions – Experimenta Design -, but also small local markets – Príncipe Real market. The neighbourhoods can be specialised through a creative cluster – Santos District Design, or seen as cultural spots – Bairro Alto. Technological parks (even not so related to creativity) are also important for the dynamics of the region. Specific private projects are also turning up and reveal a large acceptance and interest among artists, such as the Lx Factory project12. Moreover, in the metropolitan area of Lisbon, the number of cinemas, art galleries, museums and libraries is increasing.
Nevertheless, there are also some weak points emerging: a deficit of Lisbon connection to international networks, a fragile private initiative, and a weak distinction of Lisbon compared to other cities, due to the lack of specialisation in both cultural and creative sectors (Costa, 2009).
Therefore, growth perspectives for this sector are evident in both metropolitan areas. In both cases, the main dynamics takes place at the cities of Lisbon and Barcelona, which result in a big gap between the central and the peripheral municipalities. It is also true that the sectors are growing at different rates. In Barcelona, the cultural sector is being recognised, since the last decade, as one of the
12Some of these initiatives will be more extensively analysed further in the paper, in the context of governance
main instruments for the urban and economic development. Nowadays, Barcelona can be considered as a creative city. In Lisbon, even with the emergence of policies focused on the cultural and creative activities, the cultural activities don’t play a significant role yet, and Lisbon is a bit far behind this Spanish region to achieve such status.
4. GOVERNANCE FOR REGIONAL COMPETITIVENESS
4.1 Governance
Governance is a broad concept related with the action and interrelation between a diversified range of public and non-public actors. It has its roots in the changing notion of government and, thus, state action. It takes us to a sphere of analysis where the government agencies reorganise themselves throughout the territory, both in terms of geographical coverage and competences, characterized by an increasing interrelation with private non-public actors, in an attempt to answer to the complex demands of inter-territorial competitiveness (John, 2001). On the other hand, governance is also applied to the analysis of the dynamics of the social fabric, where what matters are bottom-up initiatives, solely related with the capacity of individuals or groups to take articulated action towards a common aim (Bagnasco and Le Galés, 2000) and create economic activities in a specific socio-economic environment.
Creating value, diminishing transaction costs, increasing the competitive advantage of firms through the exploitation of specific territorialised knowledge bases, are objectives at the heart of public and non-public governance strategies. These stem from the effects of globalisation, especially, from the re-territorialisation of socio-economic factors, meaning that the local or regional specificities – at social, institutional and technological levels – are the ones that determine migration and investment flows. Brenner (1999), Sassen (2000) or Scott and Storper (2003), amongst others, describe this process and these localities as agglomeration economies, where what distinguishes them from one another is the interplay between endogenous infrastructures, social, economic and political actors.
The innovativeness, creativeness and attractiveness of these localities or regions make them more or less competitive in the world economy. This logic penetrated governmental authorities and promoted their institutional and territorial reorganisation. It is what Brenner (2004) described as an ongoing “state rescaling” and simultaneous “state re-bordering” in the past decades, depending on the changing economic aspects, socio-cultural circumstances, settlement patterns and political opportunity.
According to Boelens (2009: 26), all kinds of regional public bodies that have arisen since the 1960´s were supposed to coincide more closely with the emergent network reality of the urban economy, housing market, social life and transport system of the metropolises. They have taken diverse shapes, but
24
the recent trend of the past decade and a half is characterised by flexible and entrepreneurial type organisations, such as the Metropolitan City Agreement of Bologna, the Greater London Authority, the Hannover Regional County, the Greater Copenhagen Authority or the Metropolitan Region of the Frankfurt/Rhein-Main, amongst others. The degree of decentralisation of competences varies according to the country. This debate is usually framed within the option for a more centrally planned (Westphalian) Germanic model, or a more open, neo-liberal Anglo-Saxon one (Herrschel and Newman, 2002; Boelens, 2009). It draws on the notion already outlined above and related with Florida’s creative class concept, or Landry’s creative city concept. In this line of reasoning, regions and places have to be seen not just as passive places to be planned or designed by an authority. They are active milieux that influence and are influenced by the interactions of actors (Giddens, 1994) and, in turn, this fact closely relates with their competitive capacity and with the governance strategies followed.
4.2 Analysing Lisbon and Barcelona governance dynamics
With the aim of building a sound analytical basis of governance strategies for competitiveness, for the two city-regions under study, the Barcelona Metropolitan Area and the Lisbon Metropolitan Area, one can sub-divide governance into two main dimensions, for analytical purposes: a top-down and a bottom-up approach.
In the second approach we will trace and map the governance dynamics that underpins the emergence of creativity, as well as how this relates to local competitive capacity. Therefore, the analysis will be based on the study of some selected localities of Lisbon and Barcelona undertaken within the “Creatcity Project”. The information was collected through direct interviews and visits to these localities and their main creative institutions, in order to analyse their vitality, creativeness and competitiveness dynamics13.
A top-down approach
This approach is focused on the territorial reorganisation of public authorities and corresponding competences. Here, what is the locus of our analysis is the degree of centralisation vs. decentralisation in public action, as well as its degree of openness to private actors’ collaboration and participation, or, as Clarence Stone (in Boelens, 2009) puts it, the capacity of public authorities to develop “informal arrangements by which public and private interests function together in order to be able to make and carry out governing decisions”.
13 The empirical development of the Creatcity Project involved the study of 22@, Palo Alto and Barrio de Gracia
As a comparative study (Herrschel and Newman, 2002) shows, focusing on the different territorial organisation of state agencies and functions in the UK and Germany, there seems to exist no direct relation between a more decentralized model of political-institutional territorial organisation and a higher competitive edge. Nevertheless, what seems increasingly clear is that, independently of the institutional organisation of public bodies throughout the territory, the competitive logic underpinning our current social and economic structures is based on knowledge flows and on the development of innovative and creative products and processes, including governance processes that stem from the collaboration between private and public actors. In this way, what is at stake here is (Herrschel and Newman, 2002):
‐ The intensity of the relation between public and private actors;
‐ The capacity to identify common interests in a specific territorial perimeter;
‐ The intervention capacity, meaning the capacity to develop relevant and efficient policies.
When one considers this in relation to a region’s competitiveness capacity, the fact that this region is integrated in a contingent national and supranational context, and this can lead to an extremely complex model of institutional organisation and decision making, certain conditions should be present (Silva and Syrett, 2006) to guarantee efficiency and legitimacy:
‐ The development of an integrated strategic vision for the region, complemented by a strong and legitimate leadership;
‐ Integrated and coordinated provision and organisation of services;
‐ A clear demonstration of responsibility/reliability and democratic legitimacy of policy-making and decision-policy-making processes.
The ongoing analysis of the Lisbon MA and the Barcelona MA indicates that even though we are talking about a very different institutional setting in what concerns the major region where these metropolitan areas are included, the same tension is felt: that of a lack of capacity to develop supra-municipal planning and project implementation. Lisbon MA is equivalent to a NUT II, but the same doesn’t happen to Barcelona MA. None are institutionalised. As a consequence, planning, management and administrative processes do not match, and are characterised by overlapping responsibilities between various levels of government, as well as by a lack of effective and clear leadership.
26
Table 12
Levels of government in Lisbon MA and Barcelona MA
NUTS II Management level Directly
elected Lisbon
MA
Yes Scattered: ‐ Central government
‐ Regional Development Coordination Commission of Lisbon
‐ Metropolitan Area of Lisbon
No
Barcelona MA
No Scattered: ‐ Catalonia government
‐ Metropolitan Area of Barcelona ‐ Municipal Association
‐ Transport regional authority ‐ Environment regional authority
No
The delivery of an integrated and coordinated provision of services is identified in both regions as a major shortcoming, by some of the most recent studies (Vitorino et al, 2006). So, even relying upon very different political-institutional settings - Barcelona is within a quasi-federalist Spanish system of government, whereas Lisbon is within a very centralised system, where only certain competencies are given to regional entities that act on behalf of the central government -, similar difficulties in political planning and implementation are felt. Current governance systems of both regions are based on several tiers of administration and are characterised by a lack of conformity between the geographical jurisdiction of central government (Lisbon MA) and regional government (Barcelona MA) departments, the functional metropolitan area and the metropolitan government jurisdiction (table 12).
Nevertheless, some governance arrangements emerged along the last two decades, mainly related with the undertaking of very large infrastructure and regeneration projects (the Vasco da Gama bridge, or Expo 98 in Lisbon; the 1992 Olympic Games, the Cultural Forum, in 2004, or the regeneration of the space designated as 22@ and the ongoing regeneration of the Zona Franca, with the project Barcelona Zona Innovaciò, in Barcelona). Central to the development of these governance forms, that effectively meant private-public collaboration, was a changing relationship between private and public sectors, within a background of ongoing privatisation and liberalisation of both the Spanish and Portuguese economies. In this context it is important to refer the "Barcelona model", seen as a good example, in terms of the efficient articulation and coordination of efforts between public, private and community entities that occurred during the organisation of big events. However, according to Montaner (2007), this model is outdated and it is not effective in the promotion of real changes of the various agents involved in current activities.