Revista de Informática Aplicada, Volume 12, Número 1, 2016
1
01
Urban Mobility Challenges – An Exploratory Analysis of Public
Transportation Data in Curitiba
Juan J. Rodriguez Vila1 Nádia P. Kozievitch2 Tatiana M. C. Gadda3 Keiko V. O. Fonseca4 Marcelo O. Rosa5 Luiz C. Gomes-Jr6 Monika Akbar7
Abstract: Smart transportation systems have been generating a large amount of data overtime (bus routes, users data, bus schedules, etc.). Such data provide a number of opportunities to identify various facets of user behavior, transportation needs, and traffic trends. In this paper we address some of the urban mobility challenges (addressed by the Brazilian Computer Society), from a number of different perspectives, including (i) pattern discovery, (ii) statistical analysis, (iii) data integration, and (iv) open and connected data. In particular, we present an exploratory data analysis with GIS for public transportation toward a case study in Curitiba, Brazil, using different data sources.
Keywords: GIS, Public Transportation. Urban Mobility. Curitiba. Exploratory Anlysis, Challenges.
1. Universidade Tecnológica Federal do Paraná (UTFPR), Curitiba, PR – Brazil; [email protected] 2. Universidade Tecnológica Federal do Paraná (UTFPR), Curitiba, PR – Brazil; [email protected] 3. Universidade Tecnológica Federal do Paraná (UTFPR), Curitiba, PR – Brazil; [email protected] 4. Universidade Tecnológica Federal do Paraná (UTFPR), Curitiba, PR – Brazil; [email protected] 5. Universidade Tecnológica Federal do Paraná (UTFPR), Curitiba, PR – Brazil; [email protected] 6. Universidade Tecnológica Federal do Paraná (UTFPR), Curitiba, PR – Brazil; [email protected] 7. University of Texas at El Paso, El Paso, Texas, USA: [email protected]
Revista de Informática Aplicada, Volume 12, Número 1, 2016
2
1 Introduction
The concept of smart cities is usually linked to efficiency in the use of resources [1]. Public transportation is a critical factor for the functioning of a city. It provides mobility to the masses and helps to mitigate traffic and pollution. With the advent of smart technologies, urban transportation systems are able to capture a lot of useful data. Such data can be used to shed light on a number of factors, including user trends and traffic patterns. These items are essential for urban planning, optimizing the transportation system (e.g., fuel, time), reducing environmental impacts of mass transport (e.g., noise pollution, air pollution, congestion control).
Public transportation is one of the most critical areas of smart cities. In Brazil, the vehicle fleet in major cities grew more than the road structure [2]. Mobility challenges have already gained attention of computer science community in Brazil [3]. In particular, these challenges can be grouped in the following areas: (i) discovery of patterns, (ii) data statistics, (iii) data integration, (iv) location and tracking, (v) open and connected data, (vi) contextual information, (vii) security and privacy, (viii) energy and management, (ix) use of cloud resources, and (x) trajectories with semantic information, among others.
In this paper we address the mobility challenge (by the public transportation view), from the top 5 perspectives previously mentioned, with a case study in Curitiba. Curitiba, a city located in the south of Brazil, with 1.8 million people in a total area of 430,9 km2 , according to the Brazilian Institute of Geography
and Statistics (IBGE) [4]. This area encompasses 75 districts, and is surrounded by other 29 cities, known as the metropolitan region of Curitiba (with the Portuguese acronym RMC).
Curitiba was recognized as considered one of the world’s smartest cities [5]. The city belongs to a group of cities called C40 cities [6], which set ambitious targets to improve urban life quality and protect their environment. Curitiba has developed and implemented mass transport corridors, densification of land-use along these cor- ridors, and mobility solutions using Bus Rapid Transit (BRT) systems from the 1970s, where one main feature of the success of the system is its complex network of feeder lines [7].
Routes run in exclusive lanes using high capacity bi-articulated buses, which transport up to 250 passengers per bus. Most of the buses in this system are currently powered by diesel engines. However, due to environmental concerns and sustainable principles, they should be gradually replaced by buses that use other sources of energy, like Battery Electric Vehicle buses [8].
Curitiba Municipality has adopted an open data policy that is gradually implemented by its department [10] and associated entities, for example Instituto de Planejamento de Curitiba (IPPUC) [9] and URBS [45]. They should open its non-confidential data according to directives published by the Information Technology department. In the academy, although it has been studied under distinct perspectives [8][11][12][13], further analysis of the available data can provide us a better understanding of a current state of mobility and related challenges.
The efforts of integrating different datasets to explore the state of public transportation include:
(i) from the GIS perspective, the challenge is how to effectively integrate different sources, how to address different semantics, how to maximize the efficiency of data integration, and how to build a robust framework capable of handling integration;
(ii) from the integration perspective, the challenge is how to avoid a bottleneck;
(iii) from the data perspective, the challenge is to detect the quality of the data, find reliable metadata, understand the limitation of the captured data, and provide an unified view to navegate the data;
(iv) and from the pedagogical perspective, the challenge is to be able to explore all these datasets while preserving their semantics. Another challenge is how to create a learning environment that incorporates such data to foster interdisciplinary learning and research. While it would be useful to investigate the effect of various data collecting parameter (e.g., hardware [14], networks [15] or integrate environment-related parameters), the scope of the article is limited to analyzing the sources, exploring related challenges, their impacts on the analytical process, along of a general understanding of the behavior of the system. The main goal is to explore the mobility challenge with an exploratory data analysis with GIS, and address some of the urban mobility challenges (already discussed by the Brazilian Computer Society), including (i) pattern discovery, (ii) statistical analysis, (iii) data integration, and (iv) open and connected data. Kozievitch et al. [49] already proposed an exploratory analysis of the public transportation data in Curitiba. This paper extends the proposal with specific issues over official and unofficial data sources integration, along with useful techniques to understand this data (such as clustering algorithms, and libraries).
The rest of this document is organized as follows: Section 2 presents related work. Details of the data is presented in Section 3. Analyses of behavioral trends
Revista de Informática Aplicada, Volume 12, Número 1, 2016
3
are presented in Section 4. Section 5 concludes thepaper along with future work.
2 Related Work
This section presents the related work regarding exploratory data analysis, GIS, GIS-T, and Smart Cities.
2.1 Exploratory Data Analysis
Exploratory Data Analysis (EDA) is an approach to navigate various aspects of available data with the goal of identifying latent knowledge, relationships, proporties or structures of data [16]. There are no imposed techniques to apply to the data set, but graphical visualization plays an important role in this approach [17]. The non-inferential approach in data analysis encourages the openness perspective required to integrate new domains. The availability of processing power and data storage enables new tools to process large amounts of data thus allowing flexible search of evidences in the available data through designed experiments [18].
2.2 GIS and GIS-T
Geographic Information System (GIS) stores data from heterogeneous sources in several formats in the form of geodatabases representing spatial features, storing latitude and longitudinal positions. Geodatabases are increasing nowadays generating large volume of data from satellite images, day traffic, among other sources. Many of these application systems are based on global positioning systems (GPS) [19], using specific data (such as the real time bus locations, spatial rail and spatial bus stop information) and specific techniques (such as spatial data mining [20]). An enterprise geodatabase can help address certain group of transportation challenges [21]: the many origins, destinations, paths, and conveyances that may be present, along with their locations. Kozievitch et al. [49] proposed an exploratory analysis of the public transportation data in Curitiba, however, it did not mention specific issues over official and unofficial data sources integration, along with useful techniques to understand this data (such as clustering algorithms, and libraries).
In particular, geographic information systems for transportation (GIS-T) are interconnected hardware, software, data, people, organizations and institutional arrangements for collecting, storing, analyzing, and communicating particular types of information about the earth [21].
Within transportation systems, the GIS database for transportation is organized on the basis of the road
network map. Each link can have different types of topographic attributes (e.g. nodes UTM coordinates, total length), toponomastic (street names), physical (traffic directions, number of lanes), transport (road typology by means of the speed-flow curves) and transit (description of public transport lines and corresponding frequencies) information [22]. Here, generally origin destination matrices express the traffic demand.
Examples of applications include SIGGESC [23], which associates the spatial and alphanumeric data of the bus lines with the occupation of the territory, mobility, census information, etc., available to the public through a web portal. Usually, these applications can explore open data, through different categories, such as public transit tracking (such as Chicago Transit Authority Bus Tracker [24]), stakeholders information (such as Chicago Transit Authority [25]), mobile phones [19], among others. Some of the GIS-T challenges include the different standards, the representation within databases, unambiguous communication of locations, economic models, response to new technologies, and applications to other fields [26].
Considering visualization, several techniques have been already cited by the literature, such as clustering [46], online libraries [47][49][50], map visualization [33] or specific metrics (such as Eigenvector Centrality [35]). In particular, the clustering process is defined as a grouping of information according to (i) the existence of a strong similarity between the elements belonging to the same group; (ii) the existence of a weak similarity of elements belonging to different groups [52]. In geographic clustering, there are two important concepts that we must take into account: markers, which are points that represent the geographic location of a particular element and clusters, which feature groups of markers [52].
2.3 Smart Cities
Smart Cities have been defined as the integration of technology into a strategic approach to sustainability, citizen well-being, and economic development [27]. Smart city platforms (such as the one listed at Figure 1) are designed to provide and agglutinate heterogeneous services to support a variety of application domains. In particular, the data integration (GIS, historical, real time) includes sensor nodes, actuators, software components, and other devices that gather data from the city infrastructures and citizens [28]. The delivery of the information can take advantage of open data models, without charging any fee to developers and contributors. In Brazil, several communities and projects have been created toward open data [29], smart cities [30] , and smarter use of resources [31] .
Revista de Informática Aplicada, Volume 12, Número 1, 2016
4
Figure 1 - Generic platform showing the main components to support heterogeneous smart city applications [28].
From IT perspective, there are still challenges regarding the architecture of this infrastructure [32], such as (i) lack of integration across government systems, (ii) restrictions regarding the integration capabilities of existing internal systems; (iii) lack of knowledge regarding interoperability; and (iv) availability and compatibility of software, systems, and applications.
As mentioned earlier, we will explore some of these mobility challenges using GIS and data collected from public transportation, in a use case in Curitiba, Brazil.
3 Data
The datasets used in this paper come from IPPUC, URBS [45] , the Municipality of Curitiba, along with data from Open Street Map [33] and Google Maps. Figure 2 shows the input sources, divided between stationary and dynamic data. General statistics are presented in Table 1 [34]. Details are listed below.
Figure 2 - Overview of the dataset.
Table 1 - General Statistics of the Data and Bus Network.
Description Quantity
Official Number of Bus Vehicles 1500 Official Number of Daily
Passen-gers 1.620.000
Official Number of Bus Routes 250 Number of Bus Terminals 23 Number of Tube Bus Stations 342 Average Bus Routes KMs by day 480.000 Average Age of the Fleet 7 Number of Bus Vehicles Detected
with data sample 1368
Number of Bus Stops Detected
with data sample 9940
Average number of Bus User Cards
using GIS Online Tracking 349.729 Average number of Bus Routes
using GIS Online Tracking 269 Average number of Bus Vehicles
using GIS Online Tracking 1522 Number of Roads within Curitiba 9.135
Stationary Data. Stationary (or static) data includes
georeferenceddata from bus lines, bus stops, terminals, and streets that do not change often.
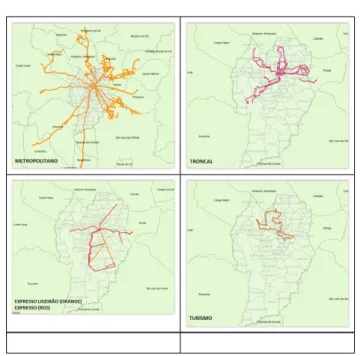
Bus Routes. The city has 482 bus routes distributed within 11 categories (Metropolitano, Linha Direta, Expresso Ligeirão, Interbairros, Expresso, Troncal,
Table 2 - Official Statistics of bus types and capacities[45].
Category Vehicle type Capacity # of Vehicles # of Lines
Expresso
Ligeirão Biarticulado 250 29 2 Expresso Biarticulado 230 136 5
Expresso Articulado 170 34 5
Linha Direta Articulado 150 40 15 Alimentador Articulado 140 78 129
Troncal Articulado 140 5 15
Interbairros Articulado 140 99 8 Linha Direta Padrão 110 208 15
Revista de Informática Aplicada, Volume 12, Número 1, 2016
5
Interbairros Padrão 100 2 8 Alimentador Comum 85 341 129 Troncal Comum 85 73 15 Conven-cional Comum 85 101 74 Troncal Híbrido 79 5 15 Conven-cional Híbrido 79 15 74 Interbairros Híbrido 79 10 8Alimentador Micro Especial 70 30 129 Troncal Micro Especial 70 4 15
Conven-cional Micro Especial 70 112 74
Turismo Double Deck 65 8 1
Conven-cional Micro 40 3 74
Circular
Centro Micro 40 7 1
Figure 4 - Representation of bus stops from IPPUC (blue) and
URBS (yellow). Regions A and B indicate bus stops within Curi-tiba that do not belong to both sources.
Figure 5 - Representation of tube bus stop (left), chinese hat bus stop (central) and platform bus stop (right). Figure 3 - Representation of bus routes (blue) and bus ter-minals (red) on upper left, followed by the eleven bus
Revista de Informática Aplicada, Volume 12, Número 1, 2016
6
Figure 6 - Clusters of bus stations obtained by k-means (K=40) [46].
Figure 7 - Clusters of bus stations obtained by Marker
Cluste-rer Algorithm [47].
Figure 8 - Clusters of bus stations for chinese hat bus stops (blue), platforms (red) and tube bus stops (orange), obtained
by Marker Clusterer Algorithm [47].
Convencional, Turismo, Circular Centro, Interhospitais, Alimentador), as shown by green lines in Figure 3. The categories Alimentador and Convencional have the majority of lines, with 265 and 65 units respectively. In particular, these vehicles can have 8 types (Articulado, Biarticulado, Padrão, Híbrido, Comum, Micro, Micro Especial e Double-Deck). The category Expresso Ligeirão has the biggest capacity, with 250 passengers, with 29 vehicles and two distinct lines. Table 2 presents the official data for the bus types, categories and capacities [45].
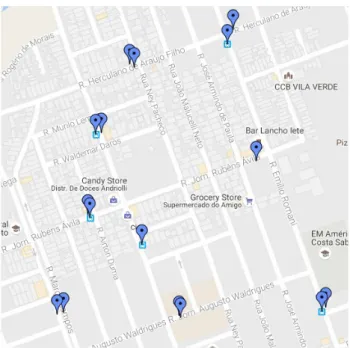
Bus Stops. The city has 9940 bus stops detected within the stationary data, from IPPUC. Considering URBS, the city has 6498 bus stops. The main difference is not only due to the metropolitan area Curitiba, but also within Curitiba, as indicated in Figure 4. Figure 4-A indicates bus stops which are present within URBS source, but are absent in IPPUC, and Figure 4-B indicates the opposite. Bus stops have 14 categories, which include the chinese hat type (the biggest category, with 2017 units), the tube bus station (285 units along the city), and platforms (307 units), as shown in Figure 5. The tube stations are bus stops which look like tubes, for specific bus routes, such as Expresso and Linha Direta. The districts named CIC and Centro have the majority of them, with a total of 1628 and 667 units each one. The bus line which has the highest number of bus stops is 030 or Interbairros III, with 161 bus stops.
Revista de Informática Aplicada, Volume 12, Número 1, 2016
7
Bus Terminals. The city has 23 terminals (buses)and one terminal which also use trains, as shown by red points in Figure 3. The oldest one is named Guadalupe, from January 1st, 1956, with official five lines. Nevertheless, the region is served with several routes, since it is a downtown area. The districts CIC and Boqueirão concentrate their majority, with 3 and 2 units each one.
Streets. The city has 9.135 streets, divided among 17 categories (Anel Central, Central, Coletora 1, Coletora 2, Coletora 3, Externa, Linhão, Normal, Outras Vias, Pedestre, Prioritária 1, Prioritária 2, Rodovia Estadual Duplicada, Rodovia Estadual Simples, Rodovia Federal Duplicada, Rodovia Federal Simples, and Setorial). The districts CIC and Sı́tio Cercado have their majority, with 1217 e 524, each one.
Different clustering techniques can be used to better understand and analyze the data, such as K-means (as shown in Figure 6, with K=40[46]). In this case, bus stops are not equally distributed, as indicated within clusters 2 and 16. Figure 7 presents the same bus stops, using the Marker Clusterer Algorithm[47]. Note that the downtown area concentrates their majority, with 722 bus stops. Figure 8 presents the clusterization of 3 bus stops (chinese hat, platform and tube) from the 14 categories. Note that the oldest bus stop type (chinese hat) is more equally distributed than the other two categories. Nevertheless, the downtown area concentrates the three bus types. But still, comparing with other sources such as Google Maps, several differences might be found, as indicated in Figure 9. From the 16 bus stops, only 5 have their match on Google Maps.
Figure 9: Comparison of bus stops from URBS and Google
Maps.
And Figure 14 presents the density of how bus lines
are present in the city. Gray lines present streets with an average of 1-17 lines, the green lines represent an average of 17-37 lines, the pink lines represent an average of 37-55 lines, and the red lines represent streets with 55-73 lines. The zoom at the same figure presents the density of bus lines within the downtown area, having each edge the respective number of lines. For the same region with zoom within Figure 14, we calculated the Eigenvector Centrality [35] of the the bus lines, as shown in Figure 11. The Eigenvector Centrality (also the basis for the PageRank algorithm) captures the influence of nodes in a network, taking into account that nodes with influential neighbors should have higher centrality values. In a bus line network, high centrality values indicate points of (potentially) intense traffic. Identifying the points with high centrality score in the Figure 14 reaffirms our observation that traffic within the Guadalupe Bus Terminal (the green triangle at the Figure) concentrates intense traffic.
Dynamic Data. Dynamic data includes data from
bus lines, and user cards (which register payment and entrance of users in buses, bus terminals and stops), transmitted at an average frequency of 5 minutes. In particular, the selected data was between October 19th, 2015 and October 26th, 2015.
User Cards. This set of data represents the commuting information comprising trip data per user card: the vehicle id, line code, the user card number, and the date of the trip. Within the date range selected, it was detected 349.729 different user cards, 269 different bus lines were present, divided among 1522 vehicles. Part of the vehicles and lines represented here have geolocated data, presented within the following set.
Revista de Informática Aplicada, Volume 12, Número 1, 2016
8
Figure 11 - Eigenvector Centrality of the bus lines within the Central District. Larger and darker circles
Figure 10 - Representation of streets, by each category.
indicate higher centrality scores.
Figure 12 - Number of Lines, Vehicles, and User Cards in a Week.
Figure 13 - Number of user cards by hour. Vehicles and Respective Bus Routes. This set of data represents the daily itinerary, having as data the vehicle id, line code, the datetime, and the latitude and longitude. Within the data range selected, it was detected 1623 distinct vehicles (information contraditory to the 1500 official vehicles on Table 1) and 703 different bus routes (here one route might have other categories, such as clockwise and anticlockwise, information which conflicts against the official numbers on Table 1). Figure 12 presents the number of lines, vehicles, and user cards in a week. Figure 13 presents the number of user cards by hour.
The complete dataset were inserted in a PostGIS [37] database. Different sources were created as different tables in the database. Later, specific tablespaces and
Revista de Informática Aplicada, Volume 12, Número 1, 2016
9
indexes were created in order to optimize the access.During data integration (URBS, IPPUC, Curitiba Municipality, Openstreet Maps and Google Maps), we can mention the following challenges:
(i) within streets: ambiguity arising from the names of streets, different lengths, missing squares, and issues regarding temporality (older streets that can not be represented anymore)[36]; (ii) within bus stops: as already mentioned in
Figure 4 and 9, misleeding data is present within sources. A higher difference is present at unofficial data sources;
(iii) within bus terminals: compared to other cities (such as New York[48]), Curitiba presents several bus terminals, with open data which is easy to download and integrate;
(iv) within bus lines: from stationary data, official numbers (Table 1) and real data present differences, since lines can have subcategories. Different sources may also present different line names (some with abbreviation, for example). (v) from dynamic data, we can mention the partial
georeferenced lines, and vehicles which are used to several routes at the same day, but do not record this information (Figure 15);
(vi) within user cards: only a set of bus lines which have user cards have been georeferenced, and the destination information from the user is not
present.
For the initial characterization, we used text similarity (e.g., street names), spatial information (e.g., location of the street block), and text-spatial comparison (correlation of street name x neighborhood x spatial location). Note that these issues only confirm what literature already listed on section 2.3.
4. Behavioral trends
The analysis of dynamic data from user cards indicated some trends:
(i) Over the week of data analyzed, there is an average of 350 bus lines, an average of 1500 vehicles, and an average of 250.000 user cards (Figure 12) per day. Sundays presented the lowest number of user cards. Note that these numbers present only a partial total presented on Table 1.
(ii) The analysis of user cards by hour indicated that the peak hours for traffic are 7 AM, 5 PM, and 6 PM (Figure 13). Friday (October 23rd, 2015) presented the highest amount of different user cards (264.224), and Sunday (October 25th, 2015) presented the lowest amount of user cards (53.510).
(iii) The top 5 bus lines which had the majority of the user cards during the time range were ”Oper s/Linha”, ”Op. Contingência”, ”Sistema Araucária”, ”Interbairros IV” and ”Interb. II Anti H”. The first one indicated bus operating without a specific line. The second one indicated extra buses to the already existing lines. The third one connects the metropolitan region to Curitiba. The last two lines operate within the Interbairros category. These lines connect several districts. They are also responsable for having the majoriy of the vehicles during the time range which was analyzed.
Figure 11 - Eigenvector Centrality of the bus lines within the Central District. Larger and darker circles
Revista de Informática Aplicada, Volume 12, Número 1, 2016
10
Figure 14 - Density of Bus Routes within streets in Curitiba, with zoom in the central district. Pink and red streets present
higher bus densities.
The analysis of the dynamic data from bus lines also presented particular characteristics:
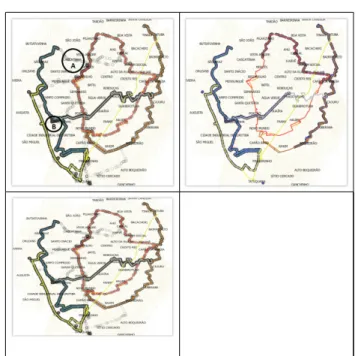
(i) The analysis of Interbairros IV bus line data indicated that the vehicles were also used to other lines at the same category (as indicated in Figure 9: instead of just using the blue line indicated in the figure, vehicles were also using other lines).
(ii) Routes which are not included within the respective line, were also present (Region A in Figure 15). The analysis of which streets are used by vehicles to connect different lines and how they are used during the peak hours could be used for the planning of the routes to optimize various parameters of the transportation system of the city.
(iii) In parallel, routes which are regularly accessed, but are not present by main route were also detected (Region B in Figure 15). The behavior was present within both the peak and off-peak hours.
(iv)The busiest route (Interbairros IV - blue line at Figure 15 - left) surrounds the central district, connecting several different neighborhoods and five bus terminals (Santa Felicidade, Campo Comprido, Fazendinha, CIC e Pinheirinho). The data indicates peaks for six A.M. (average of 902 users), seven A.M. (average of 938 users) and six P.M. (average of 604 users) within the bus line.
Figure 15: Representation of Interbairros IV line, during all day (left), seven A.M.(center) and five P.M. (left).
In summary, from the mobility challenge perspective already mentioned by the computer science society in Brazil [3], the detected patterns and associated challenges are as follows:
1. Pattern Discovery: we used not only textual, but also spatial and textual-spatial correlation within the data sources. For higher data concentrations, K-means and Marker Clusterer algorithms (Figures 6-8), along with Eigenvector Centrality(Figure 11) were used for an initial exploratory analysis;
2. Data Integration: the different coordinate systems, formats, and information (mentioned within Section 3) along the several government institutions and non official sources keep the data integration as a challenge, even considering only Brazilian cities such as São Paulo (through the Municipality of São Paulo [38]), Recife (through the Municipality of Recife [39]) and Rio de Janeiro (through Sistema Municipal de Informações Urbanas - RJ [40]). In general, formats such as CSV, Excel, Json and Shapefile are preferred (some use APIs and KML). Not all of them provide metadata or data visualization. Some services still have issues (such as the download of spatial files from the Municipality of Rio de Janeiro). In particular, the data within the use case had text, excel and shapefile formats;
3. Data Statistics: initial data statistics indicated impacts by peak hours, days of the week, contingency and metropolitan
Revista de Informática Aplicada, Volume 12, Número 1, 2016
11
vehicles, among others. Bus route densitiesindicated higher concentration within bus terminal areas. Visualization indicated vehicles use among several bus lines, with intermediary routes to connect them; 4. Open and Connected Data: the use case
presented used Open Data resulted from decree 1135/2012, from law 12.527 [41]. Besides this policy, Curitiba municipality is also using the data for competitions named Hackatons [42], as well as integration of partners for future projects (regional and international) [43] [44]. Note that open data efforts may vary from city to city, even considering only Brazilian territory. Open Data portals, along with their use with real applications by citizens are still not common in Brazil.
4 Conclusion
While the number of vehicles operating in a city increases rapidly, the change in infrastructure is a rather slow process. In order to accommodate the users and their transportation needs, a city must carefully analyze data sources to determine the user needs and possible changes in transportation to support those needs.
This paper presented an initial investigation in order to identify scenarios and implications from the public transportation data from the city of Curitiba, integrating several sources, including stationary open data, dynamic open data, and non official data sources. Finally, this paper also correlates the mobility challenges already cited by the Brazilian Computer Science society. Detected characteristics can be used for further analysis in order to optimize the transportation system and its further integration. This work will be extended to provide recommendation and optimization for alternative and existing bus routes that minimizes various parameters including travel time and number of transfers. To accomplish that, we are designing a more robust infrastructure to tackle the computational challenges associated with the issues mentioned in this paper. We expect to develop streamlined processes to integrate the diverse data sources, providing the necessary inputs to more elaborated analysis. This will enable further investigations on temporal aspects, geographic trajectories and complex networks.
Acknowledgments. We would like to thank the Municipality of Curitiba, IPPUC, URBS, CAPES, CNPq. This work is partially funded by the National Science Foundation (NSF) grant HRD-1242122 and EU-BR EUBra-BigSea project (MCTI/RNP 3rd Coordinated Call).
References
[1] SOUZA, R. et al. Beyond efficiency: How to use geolocation applications to improve citizens well -being. In INTERNATIONAL CONFERENCE ON SMART SYSTEMS, DEVICES AND TECHNOLO-GIES. 4., 2015. Proceedings... 2015. p. 37-40.
[2] MONTEIRO, A. Frota de veículos cresce
mais rápido que a estrutura viária no país.
Dispo-nível em: <http://www1.folha.uol.com.br/cotidia-no/2014/08/1503030-frota-de-veiculos-cresce-mais -rapido-que-a-estrutura-viaria-no-pais.shtml. Acesso em: mar. 2015.
[3] Salgado, A. C.; DA MOTTA, C. L. R.; SAN-TORO, F. M. Grandes Desafios da Computação no
Brasil – Relatos do 3º Seminário. Disponível em:
<http://www.sbc.org.br/documentos-da-sbc/send/141- grandes-desafios/802-grandesdesafiosdacomputaono-brasil>. Acesso em: mar. 2015.
[4] IBGE. Instituto Brasileiro de Geografia e Es-tatística. Disponível em: <http://www.ibge.gov.br>. Acesso em: mai. 2015.
[5] KOTKIN, J. The World’s Smartest Cities. Disponível em: <http://www.forbes.com/2009/12/03/ infrastructure-economy-urban-opinions-columnists -smart-cities-09-joel-kotkin.html>. Acesso em: abr. 2015.
[6] C40 CITIES. Disponível em: <http://www. c40.org>. Acesso em: may 2015.
[7] DUARTE, F., T. et al.What to expect from the future leaders of bogotá and curitiba in terms of pu-blic transport: Opinions and practices among univer-sity students. Transportation Research Part F: Traffic
Psychology and Behaviour, v.38, p.7-21, 2016.
[8] SEBASTIANI, M. T.; LUDERS AND, R.K.; FONSECA, V. O. Evaluating electric bus operation for a real-world brt public transportation using
simu-Revista de Informática Aplicada, Volume 12, Número 1, 2016
12
lation optimization. IEEE Transactions on Intelligent
Transportation Systems, p.1–10, 2016.
[9] IPPUC - Instituto de Pesquisa Planejamento Urbano de Curitiba. Disponível em: <http://ippuc.org. br/>. Acesso em: mar. 2015.
[10] CURITIBA. Portal da Prefeitura de Curitiba – Dados Abertos. Disponível em: <http://www.curitiD -ba.pr.gov.br/DADOSABERTOS/>. Acesso em: may 2015.
[11] P. H. T. Zannin, F. B. Diniz and W. A. Barbo-sa. Environmental noise pollution in the city of Curi-tiba, Brazil. Applied Acoustics, v.63, n.4, p.351-358, 2012.
[12] A. CALIXTO, F. B. DINIZ, AND P. ZAN-NIN. The statistical modeling of road traffic noise in an urban setting. Cities, v.20, p.1–74, 2016.
[13] ZANNIN, P. H. T. et al. A survey of urban noise annoyance in a large Brazilian city: the impor-tance of a subjective analysis in conjunction with an objective analysis. Environmental Impact Assessment
Review, v.23, p.245–255, 2003.
[14] SURESH, D. C. et al. Energy-efficient encod-ing techniques for off-chip data buses. ACM
Trans-actions on Embed. Computing Systems, v.8, n.2, p.
9-1/9:23, 2009.
[15] PARK, H.S.; KIM, J.D. Modeling and Analy-sis of DTN in Metropolitan Bus Network. In: ICUI-MC ’11. Proceedings… 2011. p. 20:1–20:10.
[16] NIST/SEMATECH. E-Handbook of Statistical Methods. Disponível em: <http://www.itl.nist.gov/ div898/handbook/. Acesso em: set. 2016.
[17] HARTWIG, F.; DEARING, B. Exploratory
Data Analysis. 07. SAGE Publications. 1979.
[18] MARTINEZ, W.; MARTINEZ A.; SOLKA J. Ex-ploratory Data Analysis with MATLAB, Second Edition.
Chapman & Hall/CRC Computer Science & Data Analy-sis. Taylor & Francis, 2010.
[19] STENNETH, L. et al. Transportation mode detec-tion using mobile phones and gis informadetec-tion. In: GIS ’11.
Proceedings…New York, ACM, 2011. p.54–63.
[20] MENNIS, J.; GUO, D.. Spatial data mining and geographic knowledge discovery - an introduction.
Com-puters, Environment and Urban Systems, v.33, n.6, p. 403
– 408, 2009.
[21] BUTLER, J. A. Designing Geodatabases for
Transportation, Esri Press, 2008.
[22] ARAMPATZIS, G. A gis-based decision support system for planning urban transportation policies.
Euro-pean Journal of Operational Research, v.152, n.2, p. 465
– 475, 2004.
[23] DE OLIVEIRA, T. H. M.; PAINHO, M.; HEN-RIQUES R. A spatial decision support system for the Portuguese public transportation sector. In: IWGS ’12,
Proceedings…2012. p.84–90.
[24] CTA Bus Tracker. Disponível em: <http://www. ctabustracker.com/. Acesso em: abr. 2016.
[25] CHICAGO Transit Authority (CTA). Disponível em: <http://www.transitchicago.com/about/facts.aspx>. Acesso em: abr. 2016.
[26] GOODCHILD, M. F.. Gis and transportation: Sta-tus and challenges. Geoinformatica, v.4, n.2, p.127–139, 2000.
Revista de Informática Aplicada, Volume 12, Número 1, 2016
13
should watch. Disponível em: <http://business.inquirer.net/208811/smart-cities-5-security-areas-cios-should-watch>. Acesso em: abr. 2015.
[28] VILAJOSANA, I. et al. Bootstrapping smart cities through a self-sustainable model based on big data flows. IEEE Communications Magazine, v.51, n.6, p.128– 134, 2013.
[29] OKFN. Dados abertos. Disponível em: <http:// br.okfn.org/category/dados-abertos/>. Acesso em: abr. 2016.
[30] SMART Cities. Disponível em: <http://smartci -tiesforumbrasil.com.br/>. Acesso em: abr. 2016.
[31] REDES INTELIGENTES BRASIL. Disponível em: <http://redesinteligentesbrasil.org.br/o-projeto.html>. Acesso em: abr. 2015.
[32] CHOURABI, H., et al. Understanding smart cit-ies: An integrative framework. In: SYSTEM SCIENCE (HICSS), Hawaii International Conference. 45. 2012.
Pro-ceedings… 2012. p. 2289–2297.
[33] OPEN Street Map. Disponível em: <http://www. openstreetmap.org>. Acesso em: may 2015.
[34] CURITIBA. Urbanização de Curitiba. Disponível em: <https://www.urbs.curitiba.pr.gov.br/>. Acesso em: abr. 2016.
[35] COSTA, L. da F.. Characterization of complex networks: A survey of measurements. Advances in Physics, 56(1), páginas 167–242, 2007.
[36] BARCZYSZYN, G. L. Integração de dados
geográficos para planejamento urbano da cidade de Curi-tiba. Trabalho de Conclusão de Curso, Universidade
Tec-nológica Federal do Paraná, 2015.
[37] POSTGIS. Disponível em: <http://www.postgis. net>. Acesso em: may 2014.
[38] SÃO PAULO. Portal de Dados Abertos da Prefei-tura de São Paulo. Disponível em: <http://dados.prefeiPrefei-tura. sp.gov.br/>. Acesso em: jun. 2015.
[39] SÃO PAULO. Portal de Dados Abertos da Prefei-tura de Recife. Disponível em: <http://dados.recife.pe.gov. br/dataset>. Acesso em: mai 2015.
[40] PORTAL de Dados Geográficos Abertos da Cidade do Rio de Janeiro. Disponível em: <http://portalgeo.pcrj. opendata.arcgis.com/>. Acesso em: mai. 2015.
[41] CURITIBA. Política de Dados Abertos. Disponível em: <http://multimidia.curitiba.pr.gov. br/2014/00147194.pdf>. Acesso em: abr. 2015.
[42] HACKATHON Curitiba. Disponível em: <http:// hackathon.curitiba.pr.gov.br>. Acesso em: mai. 2015.
[43] CURITIBA.Curitiba e Holanda vão trabalhar juntas em projetos de ciclomobilidade para a cidade. Dis-ponível em: <http://www.curitiba.pr.gov.br/noticias/curin- tiba-e-holanda-vao-trabalhar-juntas-em-projetos-de-ciclo-mobilidade-para-a-cidade/37601>. Acesso em: abr. 2016.
[44] CURITIBA. MoU between Brazilian and Swedish Institutions to promote sustainable urban development in Curitiba. Disponível em: <http://multimidia.curitiba. pr.gov.br/2015/00166636.pdf>. Acesso em: abr. 2016.
[45] URBS. Disponível em: <https://www.urbs.curitit-ba.pr.gov.br/>. Acesso em: apr. 2016.
[46] SILVA, E. L. C. Combining K-means Method and Complex Network Analysis to Evaluate City Mobility. In: EEE INTERNATIONAL CONFERENCE ON INTELLI-GENT TRANSPORTATION SYSTEMS, 19., 2016.
Pro-ceedings… 2016.
[47] MARKER Clusterer Algorithm. Too many makers. Disponível em: <https://developers.google.com/maps/artil-cles/toomanymarkers>. Acesso em: apr. 2016.
Revista de Informática Aplicada, Volume 12, Número 1, 2016
14
[48] MTA. Developer Data Terms. Disponível em: <http://web.mta.info/developers/developer-data-terms. html#data>. Acesso em: apr. 2016.
[49] KOZIEVITCH, N. P. et al. Exploratory Analysis of Public Transportation Data in Curitiba. In: SEMINÁRIO INTEGRADO DE SOFTWARE E HARDWARE, 43., Por-to Alegre, 2016. Anais… PorPor-to Alegre, 2016. p.1656-1666.
[50] LEAFLETJS. Disponível em: <http://leafletjs. com/>. Acesso em: apr. 2016.
[51] HEATMAP. Heat Player. Disponível em: <https:// developers.google.com/maps/documentation/javascript/ heatmaplayer>. Acesso em: apr. 2016.
[52] ZAIANE, O. R. On Data Clustering AnalysisL Scalability. Constraints, and Validations. Advances in
Knowledge Discovery and Data Mining, London:
![Figure 1 - Generic platform showing the main components to support heterogeneous smart city applications [28].](https://thumb-eu.123doks.com/thumbv2/123dok_br/18278064.881319/4.892.461.849.146.675/figure-generic-platform-showing-components-support-heterogeneous-applications.webp)
![Figure 7 - Clusters of bus stations obtained by Marker Cluste- Cluste-rer Algorithm [47].](https://thumb-eu.123doks.com/thumbv2/123dok_br/18278064.881319/6.892.108.371.176.597/figure-clusters-stations-obtained-marker-cluste-cluste-algorithm.webp)