Nitrate addition to groundwater impacted by ethanol-blended
fuel accelerates ethanol removal and mitigates the associated
metabolic
fl
ux dilution and inhibition of BTEX biodegradation
Henry Xavier Corseuil
a,⁎
, Diego E. Gomez
b, Cássio Moraes Schambeck
a,
Débora Toledo Ramos
a, Pedro J.J. Alvarez
caFederal University of Santa Catarina, Department of Sanitary and Environmental Engineering, Florianópolis, Santa Catarina, Brazil bUniversity of Exeter, Centre for Water Systems, Exeter, Devon EX4 4QF, United Kingdom
cDepartment of Civil and Environmental Engineering, Rice University, MS-317, 6100 Main St., Houston, TX 77005, USA
a r t i c l e
i n f o
a b s t r a c t
Article history:
Received 10 June 2014
Received in revised form 13 December 2014 Accepted 15 December 2014
Available online 14 January 2015
A comparison of two controlled ethanol-blended fuel releases under monitored natural attenuation (MNA) versus nitrate biostimulation (NB) illustrates the potential benefits of augmenting the electron acceptor pool with nitrate to accelerate ethanol removal and thus mitigate its inhibitory effects on BTEX biodegradation. Groundwater concentrations of ethanol and BTEX were measured 2 m downgradient of the source zones. In both field experiments, initial source-zone BTEX concentrations represented less than 5% of the dissolved total organic carbon (TOC) associated with the release, and measurable BTEX degradation occurred only after the ethanol fraction in the multicomponent substrate mixture decreased sharply. However, ethanol removal was faster in the nitrate amended plot (1.4 years) than under natural attenuation conditions (3.0 years), which led to faster BTEX degradation. This reflects, in part, that an abundant substrate (ethanol) can dilute the metabolic flux of target pollutants (BTEX) whose biodegradation rate eventually increases with its relative abundance after ethanol is preferentially consumed. The fate and transport of ethanol and benzene were accurately simulated in both releases using RT3D with our general substrate interaction module (GSIM) that considers metabolic flux dilution. Since source zone benzene concentrations are relatively low compared to those of ethanol (or its degradation byproduct, acetate), our simulations imply that the initial focus of cleanup efforts (after free-product recovery) should be to stimulate the degradation of ethanol (e.g., by nitrate addition) to decrease its fraction in the mixture and speed up BTEX biodegradation.
© 2014 Elsevier B.V. All rights reserved. Keywords:
Mixed substrates BTEX
Fuel ethanol Metabolic flux Natural attenuation GSIM
1. Introduction
Environmental contamination by single compounds rather than mixtures is uncommon, and microorganisms often face complex mixtures of potential organic substrates. For example,
fuel releases contain a wide variety of compounds, including the relatively water-soluble and toxic BTEX compounds (e.g., benzene, toluene, ethylbenzene and xylenes). Unlike the less soluble hydrocarbons in gasoline that exhibit limited migration potential, BTEX concentrations in impacted ground-water are commonly monitored to assess risk and determine the need for remediation.
Ethanol is increasingly being used as a fuel additive to alleviate dependence on imported oil and greenhouse gas emissions due to fossil fuel combustion (Goldemberg, 2007),
–
⁎Corresponding author at: University of Santa Catarina, Department of Sanitary and Environmental Engineering, Florianópolis, Santa Catarina CEP: 88040-970, Brazil. Tel.: + 55 48 3721 2130; fax: +55 48 3234 6459.
E-mail address:[email protected](H.X. Corseuil).
http://dx.doi.org/10.1016/j.jconhyd.2014.12.004
0169-7722/© 2014 Elsevier B.V. All rights reserved.
Contents lists available atScienceDirect
Journal of Contaminant Hydrology
which increases the likelihood of ethanol-blended fuel releases. Preferential degradation of ethanol and its high electron acceptor demand may decrease the rate of BTEX degradation and increase plume reach (Chen et al., 2008; Corseuil et al., 1998; Da Silva and Alvarez, 2004; Gomez et al., 2008; Mackay et al., 2006; Ruiz-Aguilar et al., 2002; Schaefer et al., 2010).
Although the molecular structure of a compound can significantly influence its susceptibility to degradation (Alvarez and Illman, 2006), the relative biodegradability of a compound in a mixture of alternative substrates (as reflected by degradation rates) is often a concentration-dependent phenomenon (Egli, 1995). Specifically, the relative abundance of alternative substrates in a mixture can significantly influence biodegradation rates of the compound of interest (Bielefeldt and Stensel, 1999; Dou et al., 2008; Freitas et al., 2011; Lendenmann et al., 1996; Lovanh et al., 2002). For example, higher proportions of toluene in various mixtures of toluene and ethanol result in higher toluene biodegradation rates (Lovanh et al., 2002). This phenomenon, termed metabolic flux dilution (Lovanh and Alvarez, 2004), is a form of noncompet-itive inhibition of the degradation of a target substrate due to the metabolism of another (likely initiated by different enzymes). This hindrance by alternative substrates in the mixture (e.g., ethanol) can be accounted by using the metabolic flux dilution factor, which is calculated as the aqueous concentra-tion of a target substrate divided by the total concentraconcentra-tion of other dissolved species, expressed as total organic carbon (TOC):
f ¼STOC=TTOC¼ri=r0 ð1Þ
wherefis the metabolic flux dilution factor (dimensionless), STOCis the available concentration of a specific substrate as total
organic carbon (mg L−1),T
TOCis the total available organic
carbon concentration (mg L−1), r
iis the degradation rate of compound i when present in a mixture, and r0 is its degradation rate when present alone. Thus, ri = f × r0 (Gomez et al., 2008).
Principles and concepts regarding the use of multiple substrates are more easily developed under simple laboratory conditions; however, they have to be validated in real, natural environments. Conditions leading to sequential substrate deg-radation have different time scales, and therefore, might lead to different observations in the field. In addition, due to differences in the dilution processes, rates of biodegradation and changes in redox conditions, it is very difficult to design laboratory experiments to encompass the complex dynamics of biodegra-dation in the subsurface. This suggests the need for long-term field studies to determine the effect of ethanol preferential degradation on the attenuation of BTEX compounds.
This study evaluates at the field scale how substrate proportions influence biodegradation of ethanol and BTEX in groundwater, in two controlled release experiments under different redox conditions. Field data are compared with computer simulations using the Modular Three-Dimensional Finite Difference Groundwater Flow (MODFLOW; Harbaugh et al., 2000), Reactive Transport in 3 Dimensions (RT3D; Clement, 1997), and the General Substrate Interactions Module (GSIM;Gomez et al., 2008). These simulations of the dynamics of ethanol and BTEX plumes were used to assess the validity of the metabolic flux dilution model, and to gain
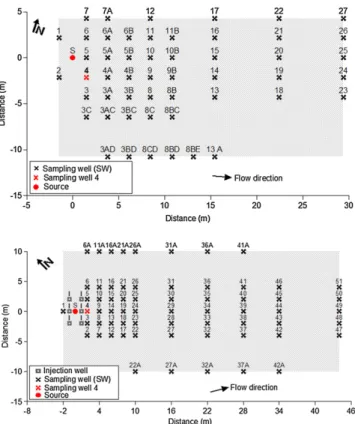
Fig. 1.Schematic view of MNA (A) and NB (B) experimental areas configuration.
fundamental insight to recommend practical solutions to accelerate BTEX biodegradation (e.g., add nitrate to increase the electron acceptor pool and stimulate faster degradation of ethanol and other easily degradable substrates that hinder BTEX biodegradation).
2. Materials and methods
Two controlled releases of Brazilian gasoline (ethanol content 24% v/v) were considered: one under natural attenuation (MNA) and the other under nitrate biostimulation (NB) conditions (Fig. 1). A detailed description of the experiments is presented elsewhere (Corseuil et al., 2011; Da Silva and Corseuil, 2012). Briefly, the experimental areas are located in the Ressacada Farm, Florianópolis, SC, Brazil (Latitude: 27°30′S, Longitude: 48°30′W). Climate in the region is mesothermic humid with an annual average precipitation of 1600 mm. Regional geology is charac-terized by unconsolidated deposits of eolian, alluvial, lacustrine and marine sands with less than 5% of silt and clay. Each release consisted of one pulse of 100 L at the groundwater table level. Initial masses of benzene, toluene, ethylbenzene and total xylenes released were 355, 2234, 680 and 3756 g,
respectively. The releases were 400 m apart to avoid co-mingling. Groundwater seepage velocity was approximately 3.1 m year−1and 5.1 m year−1, respectively, for the MNA and NB experiments. For the NB experiment, 5 L of a solution containing sodium nitrate and potassium dihydrogen phosphate (4 g L−1) was injected into six injection wells upstream of the source zone three times a week for approximately 9 months after the release. Groundwater monitoring was performed using multilevel sampling wells (SW) installed perpendicular to groundwater flow direction. Data used to evaluate multiple substrate interactions were located at SW4 approximately 2.0 m downgradient of the source at 2.0 m below ground surface (bgs) for the MNA experiment and 2.3 m bgs for the NB experiment.
Dissolved total organic carbon (TTOC, expressed as mg TOC
L−1) included ethanol, BTEX and acetate, which is a common byproduct of ethanol degradation. However, acetate represented less than 2% and 1% ofTTOCin the MNA and NB experiments,
respectively, thus exerting a minor contribution to metabolic flux dilution.
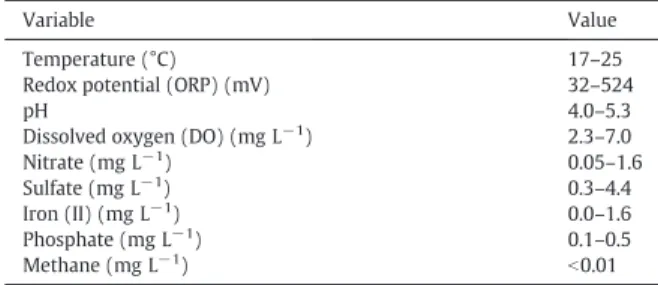
Pseudo-first-order decay coefficients were determined for BTEX after the lag period (about 1.7 years for MNA and 3 years for the NB release), by fitting the concentration versus time data from SW4 to an exponential decay model. Background groundwater concentrations of geochemical parameters are presented inTable 1.
A General Substrate Interaction Model (GSIM), using Monod multiplicative kinetics, was used to evaluate 3-dimensional interactions between substrates (ethanol and BTEX) and microbial populations present in the soil. The GSIM model (Gomez et al., 2008) works as a module for RT3D (Clement, 1997), and requires groundwater flow conditions from MODFLOW (Harbaugh et al., 2000). Together, these models incorporate common fate and transport processes such as: advection, dispersion, adsorption, biodegradation and depletion
Fig. 2.Dissolved TOC concentrations for ethanol and BTEX for the MNA (SW4, 2.0 m bgs) and NB (SW4, 2.3 m bgs) experiments.
Table 1
Background groundwater characteristics.
Variable Value
Temperature (°C) 17–25
Redox potential (ORP) (mV) 32–524
pH 4.0–5.3
Dissolved oxygen (DO) (mg L−1) 2.3–7.0
Nitrate (mg L−1) 0.05–1.6
Sulfate (mg L−1) 0.3–4.4
Iron (II) (mg L−1) 0.0–1.6
Phosphate (mg L−1) 0.1–0.5
Methane (mg L−1)
b0.01
of available electron acceptors. The GSIM model further incorporates important, and often ignored, substrate inter-action processes between ethanol and BTEX compounds, which can cause slower degradation rates of BTEX at sites with high ethanol concentrations (Lovanh and Alvarez, 2004). These interactions include: (a) metabolic flux dilution (MFD; Lovanh and Alvarez, 2004), (b) catabolite repression (CR; Madigan et al., 2000), and (c) changes in specific microbial populations of ethanol/BTEX degraders. Metabolic flux dilution refers to a lower specific BTEX utilization rate by microorganisms due to non-competitive inhibition by ethanol or other preferen-tially degraded substrate (Lovanh and Alvarez, 2004). The model is capable of simulating contaminant plume elongation and degradation over time, with the associated changes in microbial populations following the traditional sequential development of different electron accepting conditions (aerobic, nitrate reducers, iron reducers, sulfate reducers and methanogenic microbes), associated with the depletion of corresponding electron accep-tors. The model requires as input contaminant concentrations over time at the source zone, and does not consider LNAPL dissolution dynamics (Gomez et al., 2008).
The Ressacada field site conditions were simulated in the RT3D/GSIM domain considering a hydraulic conductivity of 1.1 × 10⁻⁴cm s−1, effective aquifer porosity of 0.2, average groundwater velocity of 3.1 m year−1and average hydraulic gradient of 0.018 m/m (Corseuil et al., 2011; Da Silva and Corseuil, 2012). Hydraulic flow conditions in the simulated domain, as generated by MODFLOW, were corroborated by simulations with the MODPATH software (Pollock, 1994). Particles generated by MODPATH similarly traveled 3.1 m over the course of 1 year of simulation time. Due to the complex
source zone physical conditions, including a variable height water table, source zone dissolution rates for ethanol and BTEX were estimated using initial total mass (355 g for benzene and 18,900 g for ethanol). Biokinetic parameters for ethanol and benzene degradation were based on those described byGomez and Alvarez (2010), modified for calibration of specific Ressacada site conditions (Table 3). The aquifer material has an organic content (foc) of 0.06% (Corseuil et al., 2011), suggesting linear
partitioning coefficients (Kd) of 3.55 × 10⁻¹³mg m−3for ethanol
and 4.24 × 10⁻¹¹mg m−3for benzene. Partitioning coefficients were calculated using the relationship Kd= 0.63 ×foc× Kow
(Karickhoff et al., 1979) with water-octanol partition values obtained from the literature (Hilal et al., 2004).
3. Results and discussion
Converging lines of evidence indicate that biodegradation was largely responsible for the significant decreases in ethanol and BTEX concentrations in both releases, after initial increases associated with the dissolution and migration of the released fuel (Fig. 2).
This evidence includes (1) the geochemical footprint; i.e., simultaneous consumption of released substrates (Fig. 2) and electron acceptors with accompanying decrease in ORP and methane generation (for the MNA experiment) before rebounding to initial conditions after the release was attenu-ated (Fig. 3); (2) an adequate fit of the data by model simulations (Figs. 5 and 6) using typical biokinetic coefficients (Table 2); and (3) past studies demonstrating the correspond-ing indigenous biodegradation capabilities at this site (Corseuil et al., 2011; Da Silva and Corseuil, 2012).
Fig. 3.Redox potential (ORP) (A and B), dissolved oxygen (DO) (C and D), nitrate (E and F) and methane (G and H) for the monitored natural attenuation experiment (SW4 2.0 m bgs) and nitrate biostimulation experiment (SW4 2.3 m bgs). Dashed lines indicate onset of BTEX decay.
When an ethanol-blended fuel is released to the environment, the preferential degradation of ethanol (which has a relatively simple molecular structure) can hinder BTEX degradation. Potential inhibitory mechanisms include the depletion of favorable terminal electron acceptors (e.g., dissolved oxy-gen) and nutrients during ethanol consumption, proliferation of microbial populations that grow on ethanol but cannot degrade BTEX, thermodynamic constraints posed by accumulation of fermentation products that are common to ethanol and BTEX degradation pathways (e.g., acetate and H2), catabolite repres-sion and metabolic flux dilution (Cápiro et al., 2007; Da Silva and Alvarez, 2002; Gomez et al., 2008; Lovanh and Alvarez, 2004). Previous modeling studies showed that metabolic flux dilution can be the most influential inhibitory mechanism for BTEX biodegradation in ethanol-blended fuel spill scenarios (Gomez et al., 2008; Lovanh and Alvarez, 2004). Furthermore, the concept of metabolic flux dilution is relatively simple to model at the reactor and field scales (Eq.(1)). Therefore, the metabolic flux dilution model was used to analyze the release data.
For ethanol-blended fuel spills, initial aqueous concentrations of ethanol tend to be much higher than BTEX concentrations. Ethanol concentrations near the source zones of the MNA and NB
releases reached about 2000 mg L−1(1100 mg-TOC L−1), while maximum BTEX concentrations were approximately 40 mg L−1 (38 mg-TOC L−1) (Fig. 2), representing only 3% of the total available substrate as dissolved TOC. Consequently, significant BTEX metabolic flux by the more abundant ethanol would be expected, which would result in the apparent preferential biodegradation of ethanol. Accordingly, BTEX concentra-tions started to decrease only after the onset of ethanol removal, which occurred earlier in the NB experiment (after 1.4 years) than the MNA experiment (after 3.0 years). The onset of BTEX degradation in both experiments occurred when the metabolic dilution factor (f) approached 1 (Fig. 4A and B).
First-order decay constants (determined after the compound-specific onset of biodegradation) are summarized inTable 3. These rate constants were significantly lower for the MNA experiment (k = 0.76 ± 0.60 for benzene; 0.81 ± 0.97 for toluene; 0.33 ± 0.13 for ethylbenzene, 0.28 ± 0.14 year−1for xylenes and 0.71 ± 0.43 year−1for ethanol) than for the NB experiment (k = 2.84 ± 2.01 for benzene; 3.27 ± 1.10 for toluene; 2.58 ± 0.52 for ethylbenzene, 2.52 ± 0.48 years−1 for xylenes, and 2.48 ± 1.96 years−1 for ethanol). Nitrate addition to increase the electron acceptor pool accelerated the
Table 2
Biokinetic Parameters of Modeled Compounds.
First-order degradation rate coefficient,
λ(1/d)a
Source Maximum specific growth rate,μm(1/d)
Source Half saturation constant,Ks(mg/l)c
Source Microbial cell yield,
Y(g/g)
Source
Ethanol
Aerobic 0.35 Powers et al., 2001
11.04 Lovanh et al., 2002
63.09 Calculatedc 0.50 Heulekian
et al., 1951
Nitrate reducing 0.53 Corseuil et al., 1998
0.35 Calculatedb 0.25 Calculatedc 0.26 Calculatedb
Sulfate reducing 0.10 Corseuil et al., 1998
0.21 Calculatedb 1.17 Calculatedc 0.18 Calculatedb
Iron reducing 0.17 Corseuil et al., 1998
0.21 Calculatedb 0.67 Calculatedc 0.18 Calculatedb
Methanogenic 0.2 Powers et al., 2001
0.16 Calculatedb 0.12 Calculatedc 0.07 Lawrence
and McCarty, 1969
Benzene
Aerobic 0.68 Alvarez et al., 1991
3.24 Alvarez
et al., 1991
1.22 Calculatedc 0.39 Grady
et al., 1989
Sulfate reducing 0.02 Kazumi et al., 1997; Wiedemeier et al., 1996
1.25 Gödeke et
al., 2007
3.25 Calculatedc 0.24 Calculatedb
Iron reducing 0.00 Rifai et al., 1995; Wilson et al., 1990
0.15 Lovley and
Lonergan, 1990
3.05 Calculatedc 0.14 Calculatedb
Methanogenic 0.003 Kazumi et al., 1997; Wilson et al., 1990
0.30 Ulrich and
Edwards, 2003 2.00 O'Rourke, 1968 0.05 O'Rourke, 1968 Value Source Other parameters
Aerobic microbial decay rate (bAer) 0.2 1/d Based on mix culture aerobic systems [McCarty and Brodersen, 1962]
Anaerobic microbial decay rate (bAn) 0.03 1/d Based on methane fermentation [Lawrence and McCarty, 1969]
Alcohol aerobic degraders initial population 106cells/g-soil Chen et al., 1992
Alcohol anaerobic degraders initial population 105cells/g-soil 10% of alcohol degrading aerobic populations
Benzene aerobic degraders initial population 105cells/g-soil 10% of total populations
Benzene anaerobic degraders initial population 103cells/g-soil 1% of Benzene degrading aerobic populations a First order degradation rates estimated on water half-lives of the compounds [Howard et al., 1991].
b Values estimated using the Thermodynamic Electron Equivalents Model for Bacterial Yield Prediction [McCarty, 2007]. c Values estimated on the basis of the relationshipλ= (
μX/Y Ks) [Alvarez and Illman, 2006].
biodegradation of ethanol, which resulted in earlier onset of BTEX biodegradation (Fig. 2). Nitrate amendment also resulted in a higher redox potential and no methane was detected in the NB release (Fig. 3). Moreover, nitrate consumption was consistent with the onset of ethanol and BTEX biodegrada-tion (Fig. 3), providing evidence that nitrate reducbiodegrada-tion was the main biodegradation pathway in NB experiment.
The metabolic flux dilution model predicts that specific removal rates should be proportional to the fraction of the available substrates in the mixture (Eq.(1)). BTEX degradation follows this trend (Fig. 4, panels E and F; r2≥0.9). More favorable thermodynamic conditions for biodegradation under NB conditions resulted in higher degradation rates
(maximum of 2000 and 82 mg L−1.year−1for ethanol and BTEX, respectively) relative to MNA (maximum of 800 and 16 mg L−1.year−1for ethanol and total BTEX, respectively). Furthermore, the faster removal of ethanol in the NB experiment (at 1.4 years compared to 3.1 years for MNA) resulted in a faster disappearance of its inhibitory effect (i.e., metabolic flux dilution) and an earlier onset of BTEX biodegradation. These observations are in accordance with previous laboratory studies (Dou et al., 2008; Lendenmann et al., 1996; Lovanh and Alvarez, 2004; Lovanh et al., 2002).
Field data from both experiments were simulated using GSIM model. Using data from the MNA experiment to calibrate the source zone LNAPL dissolution rates and the GSIM model half
Fig. 4.Ethanol (○) and BTEX (▲) as TOC fractions in the mixture (calculated according to Eq.(1)) for the MNA (SW4 2.0 m bgs) (A) and NB (SW4 2.3 m bgs) (B) experiments. Ethanol (○) and BTEX (▲) degradation rates (ri=f× r0) as a function of time after the release in MNA (C) and NB (D) experiments. BTEX compounds
degradation rate (r0= k C) after ethanol depletion ( ) and their relative fraction in the mixture for the MNA (E) and NB (F) experiments.
Table 3
BTEX Pseudo-first-order attenuation constants (k) near the source zones (SW4) for the natural attenuation and nitrate biostimulation experiments.
Experiment Substrate Timeframea(years) k(year−1) R2 n p-value
Monitored natural attenuation Benzene 3.1 to 7.6 0.76 ± 0.60 0.84 5 b0.05 Toluene 3.1 to 7.6 0.81 ± 0.97 0.94 5 b0.05
Ethylbenzene 3.1 to 7.6 0.33 ± 0.13 0.95 5 b0.05
Xylenes 3.1 to 7.6 0.28 ± 0.14 0.93 5 b0.05 Ethanol 1.0 to 3.7 0.71 ± 0.43 0.96 4 b0.05 Nitrate biostimulation Benzene 1.4 to 2.6 2.84 ± 2.01 0.95 4 b0.05 Toluene 1.4 to 2.6 3.27 ± 1.10 0.99 4 b0.05 Ethylbenzene 1.4 to 2.6 2.58 ± 0.52 1.00 4 b0.05 Xylenes 1.4 to 2.6 2.52 ± 0.48 1.00 4 b0.05
Ethanol 0.3 to 2.1 2.48 ± 1.96 0.94 4 b0.05
a Period after gasohol release. The timeframes correspond to the highest compound concentration until its depletion.
saturation coefficients for Ethanol and Benzene (KS,Table 2), the
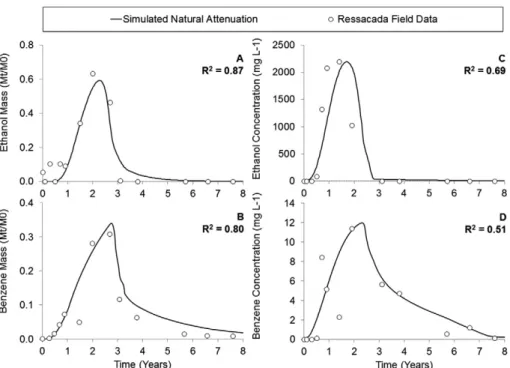
calculated total plume mass over time was accurately simulated for both ethanol and benzene (Fig. 5). Calculated R2values are 0.87 and 0.80 for ethanol and benzene respectively. Simulated contaminant concentrations at SW4 (Fig. 5c and d) fit the observed patterns with R2 of 0.69 and 0.51 for ethanol and benzene respectively. Modeled accuracy was hindered by coarse
model domain cell resolution (1 m × 1 m in XY plane), which are required for feasible execution times, and to significant spread of the field data, particularly for benzene measurements. Neverthe-less, the model adequately simulated peak concentration values at point SW4 and concentration evolution over time (Fig. 5).
The total contaminant plume mass in the system (Fig. 5a and b) was correctly simulated to increase initially due to ethanol
Fig. 5.Comparison of natural attenuation simulation using GSIM (solid line) with Ressacada field data (dots), considering: (A) Ethanol plume total mass (R2= 0.87); (B) Benzene
plume total mass (R2= 0.80); (C) Ethanol concentration over time at point SW4 (R2= 0.69); and (D) Benzene concentration over time at Point SW4 (R2= 0.51).
Fig. 6.Maximum benzene plume length reached using the GSIM model, with and without ethanol in the system: (a) 14 m for the 1 mg L−1contour with ethanol present
after 1005 days; (b) 6.5 m for the 1 mg L−1contour without ethanol present after 525 days. Source zone is shown as gray area.
and benzene source zone dissolution, reaching a peak after about 2 years of simulation time, at which point degradation and diffusion processes dominate and the total dissolved mass begins to decrease. The total dissolved ethanol mass is significantly reduced by year 3, and ethanol disappears from the system by year 5. Benzene mass removal increases markedly once ethanol disappears from the system. The simulated maximum plume lengths (1 mg L−1 contours) reach 19 m for ethanol and 14.5 m for benzene. This is significantly longer (8 m increase) than the simulated plume length for benzene alone at these concentrations (Fig. 6).
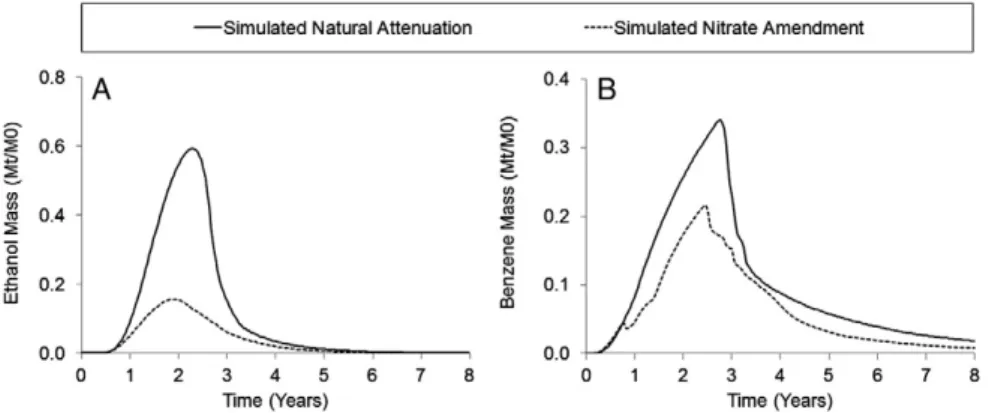
The benefits of nitrate addition to enhance ethanol biodeg-radation and mitigate its inhibitory effect on BTEX degbiodeg-radation are evident by comparing GSIM simulations of MNA versus NB conditions (Fig. 7). Using a constant near-source zone concen-tration of 80 mg L−1of nitrate results in a reduction of 74% for ethanol total plume mass (Fig. 7a). A 53% reduction of the benzene total plume mass present in the system over time was also observed (Fig. 7b). Benzene mass reduction corroborates that the presence of ethanol in the system hinders benzene natural attenuation. These results are in agreement with the metabolic flux dilution model (Gomez et al., 2008; Lovanh and Alvarez, 2004; Madigan et al., 2000), which adequately simulat-ed ethanol and benzene plume dynamics for these two releases under different redox conditions. Since metabolic flux dilution proved to be suitable to model MNA and NB field data and that proportionality among substrates fraction in the mixture and degradation rates was demonstrated, it is plausible to infer that the late BTEX biodegradation relative to ethanol was influenced by its relative contribution to the mixture.
4. Conclusions
Previous studies of ethanol-blended fuel releases indicated that ethanol can delay BTEX degradation independently of redox conditions. This study shows that the apparent preferential degradation of ethanol may be largely explained by the metabolic flux dilution model, which considers the simulta-neous degradation of multiple substrates with compound-specific degradation rates being proportional to their relative abundance in the mixture. Accordingly, the metabolic flux
dilution factor used to simulate non-competitive inhibition in the presence of alternative substrates (previously presented for lab-scale batch and continuous flow experiments) was shown to be applicable to complex, field–scale systems involving subsur-face spills of ethanol-blended fuel. However, caution should be exercised in recognizing the limitations of this model (Gomez et al., 2008): microbial growth is assumed as fully penetrated biofilms in the aquifer matrix with no attachment/detachment kinetics (Chen et al., 1992; Harvey et al., 1984; Lehman et al., 2001); biological degradation activity occurs in the liquid phase, and decay of sorbed constituents is ignored; dissolved total organic carbon is assumed to be fully available to microorgan-isms; the model does not consider degradation byproducts such as acetate or propionate; and the model does not consider complex capillary zone transport behavior of high alcohol content mixtures.
One important practical implication of this work is that the initial focus of effort to remediate releases of ethanol-blended fuel (after free-product recovery) should be to accelerate the degradation of ethanol (e.g., by augmenting the electron acceptor pool through stoichiometric nitrate addition). This would more rapidly decrease the fraction of ethanol in the mixture and speed up the biodegradation of BTEX that are the main regulatory drivers.
Acknowledgments
This research was funded primarily by Petróleo Brasileiro S/ A—PETROBRAS. Additional funds (scholarships) were provided by Coordination of Improvement of Higher Education Personnel (CAPES) and the National Council for Scientific and Technolog-ical Development (CNPq). The authors also thank students, technicians and researchers that directly or indirectly helped for the development and monitoring of the experiments.
References
Alvarez, P.J.J., Anid, P.J., Vogel, T.M., 1991. Kinetics of aerobic biodegradation of benzene and toluene in sandy aquifer material. Biodegradation 2, 43–51.
http://dx.doi.org/10.1007/BF00122424.
Alvarez, P.J.J., Illman, W.A., 2006.Bioremediation and Natural Attenuation of Groundwater Contaminants: Process Fundamentals and Mathematical Models. John Wiley & Sons (ISBN No. 0-471-65043-9. 608 p.).
Fig. 7.Comparison of total plume mass (Mt) present in the simulation domain over time, shown as a ratio of the total contaminant mass injected in the system (M0), for
simulated natural attenuation versus nitrate biostimulation. (A) Nitrate amendment results in a 74% increase in ethanol degradation; (B) Nitrate amendment results in a 53% increase in benzene degradation.
Bielefeldt, A.R., Stensel, H.D., 1999.Modeling competitive inhibition effects during biodegradation of BTEX mixtures. Water Res. 33 (3), 707–714.
Cápiro, N.L., Stafford, B.P., Rixey, W.G., Bedient, P.B., Alvarez, P.J., 2007. Fuel-grade ethanol transport and impacts to groundwater in a pilot-scale aquifer tank. Water Research 41 (3), 656–664.
Chen, Y., Abriola, L.M., Alvarez, P.J.J., Anid, P.J., Vogel, T.M., 1992. Modeling transport and biodegradation of benzene and toluene in sandy aquifer material: comparisons with experimental measurements. Water Resour. Res. 28 (7), 1833–1847.http://dx.doi.org/10.1029/92WR00667. Chen, Y.D., Barker, J.F., Gui, L., 2008.A strategy for aromatic hydrocarbon
bioremediation under anaerobic conditions and the impacts of ethanol: a microcosm study. J. Contam. Hydrol. 96, 17–31.
Clement, T.P., 1997.RT3D—a Modular Computer Code for Simulating Reactive Multi-species Transport in 3-Dimensional Groundwater Systems— Publi-cation PNNL-11720. Pacific Northwest National Laboratory, Richland, Washington, pp. 1–59 (99352).
Corseuil, H.X., Hunt, C.S., Dos Santos, R.C.F., Alvarez, P.J.J., 1998.The influence of the gasoline oxygenate ethanol on aerobic and anaerobic BTX biodegrada-tion. Water Res. 32, 2065–2072.
Corseuil, H.X., Monier, A.L., Fernandes, M., Schneider, M.R., Nunes, C., Do Rosário, M., Alvarez, P.J.J., 2011.BTEX plume dynamics following an ethanol blend release: geochemical footprint and thermodynamic constraints on natural attenuation. Environ. Sci. Technol. 45, 3422–3429.
Da Silva, M.L.B., Alvarez, P.J.J., 2002.Effects of ethanol versus MTBE on benzene, toluene, ethylbenzene, and xylene natural attenuation in aquifer columns. J. Environ. Eng. 128 (9), 862–867.
Da Silva, M.L.B., Alvarez, P.J.J., 2004.Enhanced anaerobic biodegradation of benzene–toluene–ethylbenzene–xylene–ethanol mixtures in bioaugmented aquifer columns. Appl. Environ. Microbiol. 70, 4720–4726.
Da Silva, M.L.B., Corseuil, H.X., 2012.Groundwater microbial analysis to assess enhanced BTEX biodegradation by nitrate injection at a gasohol-contaminated site. Int. Biodeterior. Biodegrad. 67, 21–27.
Dou, J., Liu, X., Hu, Z., 2008.Anaerobic BTEX degradation in soil bioaugmented with mixed consortia under nitrate reducing conditions. J. Environ. Sci. 20, 585–592.
Egli, T., 1995.The ecological and physiological significance of the growth of heterotrophic microorganisms with mixtures of substrates. Adv. Microb. Ecol. 14, 797–806.
Freitas, J.G., Mocanu, M.T., Zoby, J.L.G., Molson, J.W., Barker, J.F., 2011.Migration and fate of ethanol-enhanced gasoline in groundwater: a modelling analysis of a field experiment. J. Contam. Hydrol. 199 (1–4), 25–43.
Goldemberg, J., 2007.Ethanol for a sustainable energy future. Science 315 (5813), 808–810.
Gomez, D.E., Alvarez, P.J.J., 2010.Comparing the effects of various fuel alcohols on the natural attenuation of benzene plumes using a general substrate interaction model. J. Contam. Hydrol. 113 (1–4), 66–76.
Gomez, D.E., De Blanc, P.C., Rixey, W.G., Bedient, P.B., Alvarez, P.J.J., 2008.
Modeling benzene plume elongation mechanisms exerted by ethanol using RT3D with a general substrate interaction module. Water Resour. Res. 44 (5), 1–12.
Gödeke, S., Vogt, C., Schirmer, M., 2007. Estimation of kinetic Monod parameters for anaerobic degradation of benzene in groundwater. Environ. Geol. 55, 423–431.http://dx.doi.org/10.1007/s00254-007-0988-z. Grady, C.P., Aichinger, G., Cooper, S.F., Naziruddin, M., 1989.Biodegradation
kinetics for selected toxic/hazardous compounds. Proceedings of the 1989 A&WMA/EPA International Symposium on Hazardous Waste Treatment: Biosystems for Pollution Control. Cincinnati, OH (February 1989), pp. 141–153.
Harbaugh, B.A.W., Banta, E.R., Hill, M.C., Mcdonald, M.G., 2000. MODFLOW-2000, the U. S. Geological Survey Modular Ground-Water Model—User Guide to Modularization Concepts and the Ground-Water Flow Process.
Harvey, R.W., Smith, R.L., George, L., 1984.Effect of organic contamination upon microbial distributions and heterotrophic uptake in a Cape Cod, Mass. aquifer. Appl. Environ. Microbiol. 48 (6), 1197–1202.
Heulekian, H., Orford, H.E., Manganelli, R., 1951.Factors affecting the quantity of sludge production in the activated sludge process. Sewage Ind. Waste. 23, 945–958.
Hilal, S.H., Carreira, L.A., Karickhoff, S.W., 2004.Prediction of the solubility, activity coefficient, gas/liquid and liquid/liquid distribution coefficients of organic compounds. QSAR Comb. Sci. 23 (9), 709–720.
Howard, P.H., Boethling, R.S., Jarvis, W.F., Meylan, W.W., Michalenko, E.M., 1991.Handbook of Environmental Degradation Rates. CRC Press ISBN-13: 9780873713580.
Karickhoff, S.W., Brown, D.S., Scott, T.A., 1979. Sorption of hydrophobic pollutants on natural sediments. Water Res. 13, 241–248.
Kazumi, J.C., Caldwell, M.E., Suflita, J.M., Lovley, D.R., Young, L.Y., 1997.
Anaerobic degradation of benzene in diverse anoxic environments. Environ. Sci. Technol. 31, 813–818.
Lawrence, A.W., McCarty, P.L., 1969.Kinetics of methane fermentation in anaerobic treatment. J. Water Pollut. Control Fed. 41 (2), R1–R17.
Lehman, R.M., Colwell, F.S., Bala, G.A., 2001.Attached and unattached microbial communities in a simulated basalt aquifer under fracture- and porous-flow conditions. Appl. Environ. Microbiol. 67 (6), 2799–2809.
Lendenmann, U., Snozzi, M., Egli, T., 1996. Kinetics of the simultaneous utilization of sugar mixtures byEscherichia coliin continuous culture. Appl. Environ. Microbiol. 62, 1493–1499.
Lovanh, N., Alvarez, P.J.J., 2004.Effect of ethanol, acetate, and phenol on toluene degradation activity andtod–luxexpression inPseudomonas putidaTOD102: evaluation of the metabolic flux dilution model. Biotechnol. Bioeng. 86, 801–808.
Lovanh, N., Hunt, C.S., Alvarez, P.J.J., 2002. Effect of ethanol on BTEX biodegradation kinetics: aerobic continuous culture experiments. Water Res. 36, 3739–3746.
Lovley, D.R., Lonergan, D.J., 1990.Anaerobic Oxidation of Toluene, Phenol, and p-Cresol by the Dissimilatory Iron-Reducing Organism, GS-15. Appl. Environ. Microbiol. 56, 1858–1864.
Mackay, D.M., De Sieyes, N.R., Einarson, M.D., Feris, K.P., Pappas, A.A., Wood, I.A., Jacobson, L., Justice, L.G., Noske, M.N., Scow, K.M., Wilson, J.T., 2006.Impact of ethanol on the natural attenuation of benzene, toluene, ando-xylene in a normally sulfate-reducing aquifer. Environ. Sci. Technol. 40, 6123–6130.
Madigan, J.T., Martinko, J.M., Parker, J., 2000.Brock Biology of Microorganisms. 9th ed. Prentice-Hall, Upper Saddle River, N. J.
McCarty, P.L., Brodersen, C.F., 1962.Theory of extended aeration activated sludge. Journal (Water Pollution Control Federation) 34, 1095–1103.
McCarty, P.L., 2007. Thermodynamic electron equivalents model for bacterial yield prediction: modifications and comparative evaluations. Biotechnol. Bioeng. 97 (2), 377–388.http://dx.doi.org/10.1002/bit.
O'Rourke, J.T., 1968.Kinetics of anaerobic treatment at reduced temperatures. Ph.D. dissertation. Stanford Univ., Stanford, Calif.
Pollock, D.W., 1994.User's Guide for MODPATH/MODPATH-PLOT, Version 3: a Particle Tracking Post-Processing Package for MODFLOW, the U.S. Geolog-ical Survey Finite-Difference Ground-Water Flow Model: U.S. GeologGeolog-ical Survey Open-File Report 94—464, 6 ch.
Powers, S.E., Hunt, C.S., Heermann, S.E., Corseuil, H.X., Rice, D., Alvarez, P.J.J., 2001. The transport and fate of ethanol and BTEX in groundwater contaminated by gasohol. Crit. Rev. Environ. Sci. Technol. 31 (1), 79–123.
http://dx.doi.org/10.1080/20016491089181.
Rifai, H.S., Ward, C.H., Borden, R.C., Wilson, J.T., 1995.Intrinsic bioattenuation for subsurface restoration In Intrinsic bioremediation.
Ruiz-Aguilar, G.M., Fernandez-Sanchez, J.M., Kane, S.R., Kim, D., Alvarez, P.J.J., 2002.Effect of ethanol and methyl–tert–butyl ether on monoaromatic hydrocarbon biodegradation: response variability for different aquifer materials under various electron-accepting conditions. Environ. Toxicol. Chem. 21, 2631–2639.
Schaefer, C.E., Yang, X., Pelz, O., Tsao, D.T., Streger, S.H., Stefan, R.J., 2010.
Anaerobic biodegradation of iso-butanol and ethanol and their relative effects on BTEX biodegradation in aquifer materials. Chemosphere 81, 1111–1117.
Ulrich, A.C., Edwards, E.A., 2003. Physiological and molecular characterization of anaerobic benzene-degrading mixed cultures. Environ. Microbiol. 5, 92–102.http://dx.doi.org/10.1046/j.1462-2920.2003.00390.x.
Wiedemeier, T.H., Swanson, M.A., Wilson, J.T., Kampbell, D.H., Miller, R.N., Hansen, J.E., 1996.Approximation of biodegradation rate constants for monoaromatic hydrocarbons (BTEX) in groundwater. Groundwater Mon-itoring & Remediation 16 (3), 186–194.
Wilson, B.H., Wilson, J.T., Kampbell, D.H., Bledsoe, B.E., Armstrong, J.M., 1990.
Biotransformation of monoaromatic and chlorinated hydrocarbons at an aviation gasoline spill site. Geochem. J. 8, 225–240.