Licenciada em Química Aplicada
Chlorite Dismutase from perchlorate reducing bacteria
A potential biocatalyst to eliminate chlorinated species from
polluted water resources and industrial wastes
Dissertação para obtenção do grau de Mestre em Bioquímica Estrutural e Funcional
Orientador: Doutor Pablo Javier González, Investigador Auxiliar, FCT/UNL
Co-orientador: Prof. Doutora Maria Cristina de Oliveira Costa, Professor Auxiliar, FCT/UNL
Júri:
Presidente: Prof. Doutor José Ricardo Ramos Franco Tavares Arguente: Prof. Doutor Eurico José da Silva Cabrita
Vogais: Doutor Pablo Javier González
Prof. Doutora Maria Cristina de Oliveira Costa
Chlorite Dismutase from perchlorate reducing bacteria (A potential biocatalyst to eliminate chlorinated species from polluted water resources and industrial wastes)
Copyright Diana Mendes Freire, FCT-UNL, UNL
Acknowledgements
Neste item gostaria de demonstrar o meu sentido agradecimento a todos aqueles que me acompanharam ao longo deste projecto, cuja ajuda foi essencial para o seu desenvolvimento.
Antes de passar aos agradecimentos individuais, tenho que agradecer à Fundação Calouste Gulbenkian por ter acreditado, distinguido e financiado este projecto no Programa de Estímulo à Investigação.
Um agradecimento ao Dr. Pablo González que me assistiu ao longo de todo o meu mestrado, principalmente durante o projecto para a minha tese final, por todos os ensinamentos e por todos os conselhos que me transmitiu e que me permitiram crescer como pessoa, tanto a nível profissional como a nível pessoal.
Devo um agradecimento especial à professora Maria Cristina Costa que desde a minha licenciatura, por diversas situações, me guiou e ajudou com muito apreço a resolver algumas dúvidas existenciais que se foram colocando durante o meu percurso académico.
À Dr. Gabriela Rivas por toda a ajuda em várias circunstâncias e especialmente pelo acompanhamento durante todo o estudo relativo a técnicas de biologia molecular.
À Dr. Teresa Santos Silva pelo acompanhamento e ajuda prestadas durante a minha iniciação na técnica de cristalografia de raios-X.
I would like to thank to Professor Sabine Van Doorslaer for monitoring, sympathy and for the interest shown during my stay in Antwerp.
Um obrigado aos meus colegas de laboratório André, Catarina, Jacopo, Leonardo, Iris, Rashmi, Nathália, Cecília e Cláudia por todo o apoio que me deram durante este ano.
Gostaria de agradecer aos meus amigos e companheiros de laboratório Rita Otrelo, Cintia Carreira e Hugo Correia que compreendem tão bem o que foi este ano de tese repleto de entusiasmo, sucesso, apesar de que por vezes acompanhado por percalços e um pouco de frustração.
Fica um agradecimento especial ao Steve Fernandes que esteve sempre comigo nos momentos de maior alegria e entusiasmo mas também naqueles mais críticos em que o cansaço e frustração começaram a falar mais alto, ajudando-me sempre a recuperar a minha motivação e o meu sorriso para seguir em frente.
Abstract
Magnetospirillum (M.) sp. strain Lusitani, a perchlorate reducing bacteria (PRB), was previously isolated from a wastewater treatment plant and phylogenetic analysis was performed to classify the isolate. The DNA sequence of the genes responsible for perchlorate reduction and chlorite dismutation was determined and a model was designed based on the physiological roles of the proteins involved in the pcr-cld regulon.
Chlorite dismutase (Cld) was purified from Magnetospirillum sp. strain Lusitani cells grown in anaerobiosis in the presence of perchlorate. The protein was purified up to electrophoretic grade using HPLC techniques as a 140 kDa homopentamer comprising five ~28 kDa monomers.
Steady-state kinetic studies showed that the enzyme follows a Michaelis-Menten model with optimal pH and temperature of 6.0 and 5°C, respectively. The average values for the kinetic constants KM and Vmax were respectively 0.56 mM and 10.2 U, which correspond to a specific
activity of 35470 U/mg and a turnover number of 16552 s-1. Cld from M. sp. strain Lusitani is
inhibited by the product chloride, but not by dioxygen. Inhibition constants KiC= 460 mM and KiU=
480 mM indicated that sodium chloride is a weak mixed inhibitor of Cld, with a slightly stronger competitive character.
The X-ray crystallography structure of M. sp. strain Lusitani Cld was solved at 3.0 Å resolution. In agreement with cofactor content biochemical analysis, the X-ray data showed that each Cld monomer harbors one heme b coordinated by a histidine residue (His188),
hydrogen-bonded to a conserved glutamic acid residue (Glu238). The conserved neighboring arginine residue
(Arg201) important for substrate positioning, was found in two different conformations in different
monomers depending on the presence of the exogenous ligand thiocyanate.
Resumo
Magnetospirillum (M.) sp. estirpe Lusitani, uma bactéria redutora de perclorato, foi previamente isolada de uma estação de tratamento de águas residuais, tendo sido realizada uma análise filogenética por forma a classificar e isolar a mesma. A sequência de ADN dos genes que codificam as proteínas responsáveis pela redução de perclorato e dismutação do clorito (regulão
pcr-cld) foi determinada. Foi também desenhado um modelo com base nas funções fisiológicas de
cada uma das proteínas envolvidas no referido regulão.
A dismutase do clorido (Cld) foi purificada a partir de células de Magnetospirillum sp. estirpe Lusitani em anaerobiose e na presença de perclorato. A proteína foi purificada a nível electroforético utilizando técnicas de cromatografia de alta eficiência, determinando-se a proteína como um homopentâmero de 140 kDa apresentando cinco monómeros de ~28 kDa.
Estudos cinéticos pela teoria do estado estacionário demostraram que a enzima segue um modelo de Michaelis-Menten, com o pH e temperatura óptima de 6,0 e 5°C, respectivamente. Os valores médios para as constantes cinéticas KM e Vmax foram, respectivamente, 0,56 mM e 10,2 U, o
que corresponde a uma actividade específica de 35470 U / mg e um kCat de 16552 s-1. A Cld de M.
sp. estirpe Lusitani é inibida pelo produto da reacção de dismutação, o cloreto, mas não pelo oxigénio molecular. Foram determinadas constantes de inibição KiC = 460 mm e KiU = 480 mm que
indicam que o cloreto de sódio é um inibidor misto fraco da Cld, com um carácter um pouco competitivo.
A estrutura de cristalografia de raios-X da Cld de M. sp. estirpe Lusitani foi resolvida a 3,0 Å de resolução. De acordo com a análise bioquímica do teor em cofactores, os dados de raios-X revelaram que cada monómero da Cld contém um grupo hemo do tipo b coordenado por um resíduo de histidina (His188), que apresenta uma ponte de hidrogénio com um resíduo de ácido glutâmico
conservado (Glu238). O resíduo de arginina conservado (Arg201) na vizinhança do grupo hemo
revelou ser importante para o posicionamento do substrato, tendo em conta que foram encontradas duas possíveis conformações para o referido resíduo em diferentes monómeros, dependendo da presença do ligando tiocianato.
Table of Contents
Acknowledgements ... I Abstract ... III Resumo ... V Table of Contents ... VII List of Figures and schemes ... XI List of Tables ... XVII Symbols and Notations ... XIX
1. Introduction ... 1
1.1. Chlorinated species: environmental impact ... 1
1.2. Perchlorate reducing bacteria ... 3
1.3. Chlorite Dismutase ... 5
1.4. Project objectives ... 9
2. Materials and methods ... 11
2.1. Bacterial strain and culture conditions... 11
2.2. Genomic DNA extraction ... 11
2.3. Sequencing of pcrABCDE and cld genes ... 12
2.3.1. DNA sample for PCR ... 12
2.3.2. 16s Ribosomal DNA ... 12
2.3.3. cld partial gene amplification ... 13
2.3.4. pcrA partial gene amplification ... 14
2.3.5. pcrA and cld genes orientation in pcr-cld operon ... 14
2.3.6. Inverse PCR ... 15
2.3.6.1. pcrA gene ... 15
2.3.6.2. cld gene ... 17
2.4. Chlorite dismutase purification ... 18
2.4.1. First purification protocol ... 18
2.4.2. Second purification ... 18
2.6. Mass spectrometry and identification by MALDI-TOF-MS ... 19
2.7. Kinetic studies ... 19
2.8. X-ray crystallographic structure ... 20
2.9. Spectroscopic studies ... 20
2.9.1. UV/Visible spectroscopy ... 20
2.9.1.1. Heme quantification ... 20
2.9.1.2. UV-Visible pH titrations ... 21
2.9.1.3. Cld ligands ... 21
2.9.2. CW-EPR ... 21
3. Results and discussion ... 23
3.1. Preliminary taxonomic studies ... 23
3.1.1. Phylogenetic analysis ... 23
3.1.2. Detection and analysis of pcrA and cld partialgene sequences ... 26
3.1.3. Amplification and sequencing of the pcr-cld operon ... 28
3.1.4. Analysis of the pcr-cld operon ... 32
3.1.5. Physiological role of the proteins of the pcr-cld operon ... 44
3.2. Biochemical properties of chlorite dismutase ... 47
3.2.1. Basic biochemical characterization ... 47
3.2.2. Electrophoretic profile ... 47
3.2.3. Kinetic studies ... 48
3.2.3.1. Determination of the optimal buffer ... 49
3.2.3.2. Determination of the optimal pH ... 50
3.2.3.3. Inactivation of Cld by temparature ... 51
3.2.3.4. Determination of kinetic parameters ... 54
3.3. X-ray crystallographic structure ... 56
3.3.1. Crystallization ... 56
3.3.2. Structure determination, model building and refinement ... 56
3.3.3. Structure characterization ... 60
3.4. Spectroscopic studies ... 66
3.4.1. Influence of the purification protocol in the Cld as-prepared state. ... 66
3.4.3. The pH influence on the heme environment ... 72
3.4.4. Influence of exogenous ligands on the UV-Visible and CW-EPR spectra ... 76
4. Final remarks and outlook ... 79
List of figures and schemes
Figure 1. Phylogenetic distribution of perchlorate- and chlorate-reducing microorganisms (Figure reproduced from reference [21]). ... 4
Figure 2. Mechanism of perchlorate and chlorate reduction by perchlorate reducing bacteria (Figure reproduced from reference [21]). ... 5
Figure 3. Overview of Cld’s heme b containing monomer structure. (A) heme b structure [28]; (B)
The monomer is shown in green cartoon, the porphyrin in grey and the iron atom in brown (Figure 4B reproduced from reference [1]). ... 6
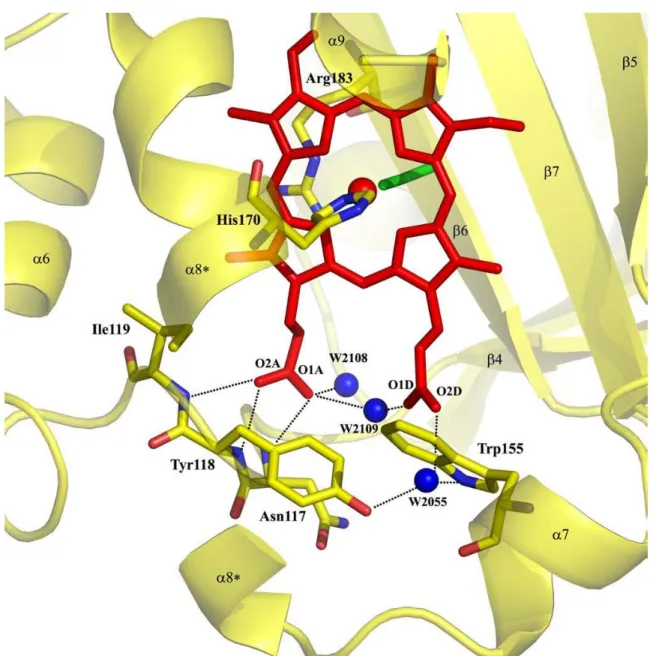
Figure 4. Metal binding site and possible hydrogen bonds for heme coordination reported for Cld from Azospira oryzae strain GR-1. The heme is presented as red sticks, the coordinating His170 is yellow (carbon), blue (nitrogen), and red (oxygen). The same coloring is used for the amino acids Ile119, Tyr118, Asn117, Arg183, and Trp155. The coordinating thiocyanate in this crystal structure is green and the water molecules (W) are depicted as blue circles. For clarity, a part of the helix α8 (between the asterisks) has been omitted from this drawing. The possible hydrogen bonds are presented as black dots. Figure was reproduced from reference [25]. ... 7
Figure 5. Crystal Structure of Chlorite Dismutase from (a) Azospira Oryzae strain GR-1 (Figure reproduced from reference [25])and (b) Candidatus Nitrospira defluvii (Figure reproduced from reference[26]). ... 8
Figure 6. Proposed mechanisms for chlorite decomposition and O2 evolution catalyzed by Cld
(Figure reproduced from reference [1]). ... 9
Figure 7. Agarose gel electrophoresis of the pcr product obtained using primers 27F and 1492F (designed for amplification of the 16s rRNA). Gene RulerTM 1kb DNA Ladder from
Fermentas (left) and gene amplification of the 16S rRNA using the bacterial isolate used as source of the Cld enzyme (right). ... 24
Figure 8. Phylogenetic tree based on the nucleotide sequence of the gene encoding the 16S rRNA. The evolutionary history was inferred using the Neighbor-Joining method.[40] The bootstrap
consensus tree inferred from 10000 replicates is taken to represent the evolutionary history of the taxa analyzed.[41] Branches corresponding to partitions reproduced in less than 40%
bootstrap replicates are collapsed. The percentage of replicate trees, in which the associated taxa clustered together in the bootstrap test (10000 replicates), are shown next to the branches.[41] The evolutionary distances were computed using the p-distance method[42] and
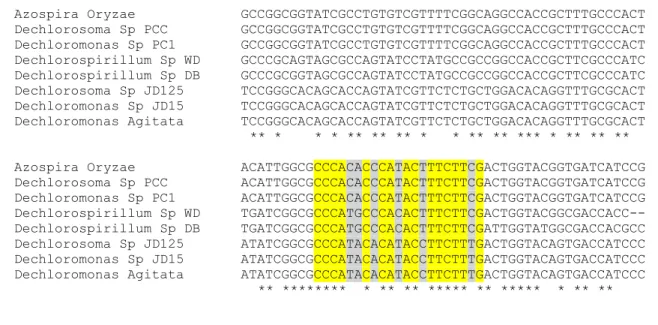
Figure 9. Multiple DNA sequence alignment of the annotated partial sequences of Azospira oryzae
GR1, Azospira sp.PCC, Dechlorosoma sp. JD125, Dechloromonas sp. JD15, Dechloromonas
agitata CKB, Dechloromonas sp. PC1, Magnetospirillum sp. WD and Magnetospirillum sp.
cl-31-Sarno River. Conserved areas chosen for primer designed are highlighted yellow and respective degenerated sites in grey. ... 27
Figure 10. Agarose gel electrophoresis of the PCR product obtained using primers to amplify the partial gene sequence of cld (A) and pcrA (B). (Gene RulerTM 1kb DNA Ladder from
Fermentas). ... 27
Figure 11. pcr-cld operon organization in D. aromatica RCB, Azospira suillum PS, D. agitata CKB,
I. dechloratans, Pseudomonas sp. strain PK and M. bellicus VDYT. ... 29
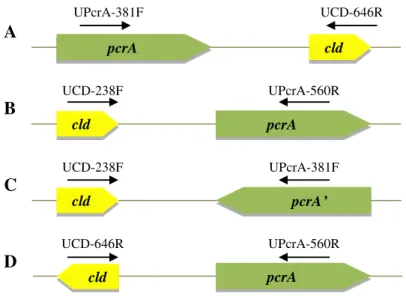
Figure 12. Schematic representation of the four possible pcrA and cld genes orientations. ... 30
Figure 13. Agarose gel electrophoresis of the PCR product obtained using primers RDsInvI and PcrA-esp to amplify the pcr-cld operon. Left, Gene RulerTM 1kb DNA Ladder from Fermentas; Right, PCR product. ... 30
Figure 14. Agarose gel electrophoresis of the PCR product obtained from the inverse pcr for cld (A) and pcrA (B) genes. (Gene RulerTM 1kb DNA Ladder from Fermentas). ... 31
Figure 15. DNA fragment containing the cld-pcr operon. Fluorescent green, PcrA; cyan, PcrB; orange, PcrC; dark green, PcrD; violet, c-type tetra-hemic membrane-anchored protein belonging to the NapC/NirT family; and yellow, Cld. Highlighted in grey and red are shown the partial DNA sequence of the genes encoding MoaA and a Mo-containing oxidoreductase, respectively. Transcripcional elements identified in the DNA sequence: one binding motif for NarL (double underlined orange characters), one for sigma-70 (double underlined pink characters), one for Fis (double underlined red characters), and two for IHF (double underlined blue characters). ... 39
Figure 16. Phylogenetic analysis based on the comparison of the amino acid sequences of PcrA from Magnetospirillum sp. Lusitani with other members of the DMSO reductase family of mononuclear Mo-enzymes. The evolutionary history was inferred using the Maximum Parsimony method. The bootstrap consensus tree inferred from 10000 replicates is taken to represent the evolutionary history of the taxa analyzed.[41] Branches corresponding to
partitions reproduced in less than 40% bootstrap replicates are collapsed. The percentage of replicate trees, in which the associated taxa clustered together in the bootstrap test (10000 replicates), are shown next to the branches.[41] The MP tree was obtained using the
Close-Neighbor-Interchange algorithm (pg. 128 in ref.[42]) with search level 1 in which the initial trees were obtained with the random addition of sequences (10 replicates). The analysis involved 31 amino acid sequences. All positions containing gaps and missing data were eliminated. There were a total of 438 positions in the final dataset. Evolutionary analyses were conducted in MEGA5.[43] Proteins with reported crystallographic structure are identified with
Figure 17. Primary amino acid sequence of PcrB from Magnetospirillum sp. strain Lusitani. Cysteine Residues highlighted in red, green and blue are responsible for the binding of three different 4Fe-4S clusters (FeS1, FeS2 and FeS3) and cysteine residues in orange bind a 3Fe-4S cluster (FeS4). ... 42
Figure 18. Primary amino acid sequence of PcrC from Magnetospirillum sp. strain Lusitani. Residues highlighted in red, green and blue are responsible for the binding of three different low-spin c-type hemes, residues in orange binds a high-spin c-type heme. ... 43
Figure 19. Perchlorate reduction by pcr-cld enzymes; (B) pcr-cld operon organization in M. sp. Lusitani. ... 45
Figure 20. Illustration of the chlorite dismutase (Cld) 12.5 % SDS-PAGE gel. ... 47
Figure 21. Plots of 1/Vi vs. [I] (Dixon plot, left) and of [S]/Vi vs. [I] (Cornish plot, right) at different
substrate concentrations (in mM: black, 0.3 ; red, 0.6; blue, 0.9; green, 1.2; pink, 1.5; mustard, 2.5). Least-square fitting of the experimental data was performed using OriginPro v.8. ... 50
Figure 22. Chlorite dismutase activity as function of the pH. Left and right panels show the dependence of the initial rates and the kCat/KM ratio versus pH, respectively. ... 50
Figure 23. Timecourse of chlorite dismutation at different temperatures. ... 52
Figure 24. Michaelis-Menten plot of the Cld kinetics performed in 50 mM KPB pH 6.0 at 5 ºC. Experimental data was fitted using the software OriginPro v8 with the equation Vi = (VM.[S]) /
(KM + [S]). ... 55
Figure 25. Crystals of Cld from Magnetospirillum sp. strain Lusitani obtained using L-cysteine and potassium thiocyanate as additives. ... 56
Figure 26. Difraction pattern from the Cld crystal (resolution limits: 59.4 and 3 Å)... 57
Figure 27. Overview of the asymmetric unit for Cld crystals from Magnetospirillum sp. strain Lusitani. The right view is rotated 90° from the left view along the horizontal axis shown in the center. This Figure was generated using Qutemol.[67] ... 60
Figure 28. Overview of the Cld quaternary structure. The pentamer is colored by chain with the hemes drawn in grey, blue and red sticks respectively for carbon, nitrogen and oxygen atoms. The iron atoms are represented as grey spheres. This Figure was generated using CCP4 MG.[60] ... 61
refinement cycle. The β-sheets are depicted as pink arrows and α-helices as red cylinders. (C) Cld sequence aligned with secondary structure. The β-sheet are depicted as arrows and α-helices as α-helices. α-α-helices are labeled in blue (H1, H2, …) and strands by their sheets (A). The motifs β, γ and are respectively a beta turn, gamma turn and beta hairpin. The red dots correspond to the amino acid residues that interact to the ligands (heme and thiocyanate anion). B and C were generated using PDBsum (www.ebi.ac.uk/pdbsum). ... 62
Figure 30. Overview of the Cld monomer. The heme was drawn in grey, blue and red sticks respectively for carbon, nitrogen and oxygen atoms and the iron heme as a grey sphere. This Figure was generated using DS Viewer 3.5.[68] ... 63
Figure 31. Overview of Cld active site in the presence (A and B) and in the absence (C and D) of the thiocyanate anion. The heme, His188, Arg201 and thiocyanate anion are drawn. Carbon,
nitrogen, and oxygen atoms are respectively colored in green, blue and red. The iron heme is drawn as an orange sphere. This Figure was generated using CCP4 MG.[60] ... 64
Figure 32. Hidrogen bond between Glu238 and His188. Carbon, nitrogen, and oxygen atoms are
respectively colored in green, blue and red. The iron heme is drawn as an orange sphere. This Figure was generated using CCP4 MG.[60] ... 65
Figure 33. X-band CW-EPR spectra of Cld from the first (black) and second (red) purification protocols, along with Cld incubated with a large excess of NaCl (blue). Cld was at 500 μM in 50 mM KPB pH 6.0 in all cases. EPR measurements conditions as described in section 2.9.2. ... 66
Figure 34. SDS-PAGE of Cld purified by the first and second purification process. ... 68
Figure 35. UV-Vis absorption spectra of Cld at pH 6.0 in as-prepared (red) and dithionite-reduced (black) conditions. ... 69
Figure 36. Upper panels: kinetics of dithionite-reduction under argon atmosphere (left) and UV-Vis absorption spectra corresponding to the species detected during the timecourse of the reaction (right). Lower panels: kinetics of dithionite-reduction in the presence of air (left) and UV-Vis absorption spectra corresponding to the species detected during the timecourse of the reaction (right).Reactions were performed in 50 mM KPB pH 6.0 at room temperature in quartz cells provided with a magnetic stirrer. The colors of the timecourse traces (left panels) correspond to the color of the UV-Vis spectra (right panels), i.e. red: as-prepared, black: dithionite-reduced, blue: oxidation-intermediary, green: oxidation product. ... 70
Figure 37. Representation of the UV/Visible titration over the pH ranges A) 7.2-9.7, B) 3.5-6.4 and C) 9.8-12.6. The graphs inserted show A) the absorbance at 392 and 411 nm, B) at 392 nm and C) at 411 nm as a function of the pH. ... 74
Scheme 1. The two possible arrangements of the first coordination sphere of the Mo ion observed in respiratory nitrate reductase. Asp stands for aspartate. 40
Scheme 2. Model of the suicide substrate mechanism. E, S and P are the free enzyme, the substrate and the product, respectively. X and Y represent, respectively, the enzyme substrate-complex and a short-lived intermediary that can be transformed into the free enzyme and the product through the pathway ruled by k3, or result in the enzyme inactivation through the pathway
controlled by k4. ... 52
Scheme 3. Comparison between the two Cld purification procedures. ... 67
Scheme 4. Changes in heme coordination environment based on the UV-Vis spectroscopic evidence. ... 72
Scheme 5. Proposal of acid-base transitions observed in Cld from D. aromatica RCB. The pKa
List of Tables
Table 1. Chlorinated species.[2] ... 2
Table 2. Universal primers for 16s Ribosomal DNA amplification.[32, 33] ... 13
Table 3. Metabolic primers for chlorite dismutase gene. ... 13
Table 4. Metabolic primers for perchlorate reductase gene. ... 14
Table 5. Primers used for pcr-cld operon sequencing. ... 15
Table 6. Specific primers for pcrA inverse PCR. ... 16
Table 7. Specific primers for cld inverse PCR. ... 18
Table 8. Data collection statistics. ... 58
Symbols and Notations
ɛ - Molar absorption coefficient
CCP4 – Collaborative Computational Project Number 4 Cld – Chlorite dismutase
cld - Chlorite dismutase gene CW- continuous wave DM – Density Modification DMSO - Dimethyl sulfoxide DNA - Deoxyribonucleic acid
EPA - Environmental Protection Agency EPR – Electronic paramagnetic resonance
HPLC - High-performance liquid chromatography kDa – kiloDalton
KiC - competitive inhibition constants
KiU - uncompetitive inhibition constants
KM - Michaelis constant
kCat – turnover number
KPB – potassium phosphate buffer
PcrA – Perchlorate reductase catalytic subunit pcr - Perchlorate reductase gene
PDB – Protein Data Bank PEG – Polyethylene glycol pI – isoelectric point
PRB – perchlorate reducing bacteria RMSD – Root Mean Square Deviation rR - resonance Raman
SDS-PAGE - Sodium Dodecyl Sulfate Polyacrylamide Gel Electrophoresis Vmax - Maximum rate
Chapter 1
Introduction
1. Introduction
1.1. Chlorinated species: environmental impact
Chlorinated species, especially perchlorate (ClO4-), chlorate (ClO3-) and chlorite (ClO2-),
have been produced relatively recently (≤ 50 years) in large scale by anthropogenic sources. The main source is the chemical industry, which uses these and related compounds in a wide range of applications. The improper storage and/or disposal of chlorine oxoanions and their extensive use, coupled to the high solubility and kinetic inertness of the salts, led to harmful concentrations in surface and groundwater supplies making them serious fresh water pollutants.[1] These
characteristics make them persistent and problematic environmental pollutants of drinking waters, having a direct effect on the health or welfare of a community in several forms. Chemical contamination can be related to trace substances but should be evaluated in relation to other health risks associated with drinking water, in particular, diseases transmission.[2]
Drinking water contamination is clearly related with chlorinated species and it is imperious to refer chlorine dioxide when considering these species. Chlorine dioxide is a yellowish-green photosensitive gas at room temperature that is sTable in the dark but unsTable in light. It is a strong oxidizing agent that under oxidant demand conditions is readily reduced to chlorite, another strong oxidizing agent. The strong oxidizing ability of chlorine dioxide makes it useful as a drinking water disinfectant. Other uses of chlorine dioxide include bleaching textiles and wood pulp for paper manufacturing, antimicrobial applications, and reducing loads of absorbable organic halogenated compounds in industrial effluents.[2, 3]
In aqueous solutions of chlorine dioxide there are usually several chlorinated species that are byproducts of its reaction with water (Equation 1), which are chlorite and chlorate anions, or simply precursors involved in its production, as it is for example sodium chlorate (Equation 2). Table 1 shows the various inorganic chlorinated species with its respective oxidation state.[2-4]
2ClO2 (g) + 2OH- → ClO2- (aq) + ClO3- (aq) + H2O (l) (1)
Table 1. Chlorinated species.[2]
Oxidation state Chlorinated specie Molecular formula
+ 7 Perchlorate ion ClO4
-+ 5 Chlorate ion ClO3
-+ 4 Chlorine dioxide ClO2
+ 3 Chlorite ion ClO2
-+ 3 Chlorous acid HClO2
+ 1 Hypochlorite ion OCl
-+ 1 Hypochlorous acid HOCl
0 Chlorine Cl2
- 1 Chloride ion Cl
-The perchlorate anion has been found in potentially harmful concentrations in numerous water resources. Perchlorate is an inhibitor of thyroid function in environmentally relevant concentrations[5] and also presents carcinogenic properties in animals for which reported studies
demonstrated that high doses of perchlorate in rodents cause statistically significant increases in follicular cell nodules[6], adenomas[7], and carcinomas[8]. There are also of concern
neurodevelopmental, developmental, reproductive, and immunotoxic effects caused by perchlorate salts.[9] These are widely used in the chemical industry and they naturally occur in Chilean
saltpeter[10], a mineral used in some chemical fertilizers. Although, the most significant use of
perchlorate, and probably the main source of environmental contamination, is the salt ammonium perchlorate used in manufacturing solid fuels for rockets and missiles.[11]
In similarity to perchlorate anion, chlorates are powerful oxidizing agents used for several industrial, agricultural and pharmaceutical purposes. They can form explosive mixtures with common materials and must be handled with caution, as it was also seen for ammonium perchlorate. There is no indication that chlorate ion occurs naturally, except as an inorganic by-product of the reaction between chlorine dioxide and water, as it was mentioned before. Due to the extensive use of chlorine dioxide as water disinfectant, an increase of chlorate occurrence is being observed. Manufactured chlorate products are colorless, white or pale yellow crystals very soluble in water that can be toxic to humans and animals, and also be harmful to the environment.[12]
paper. It is also used to whiten sugar, starch, grease, ointment and wax. When used to purify water, little of remained chlorine would be found. It is also used extensively in sterilization, and deodorization in sewage treatment processes.[4] The chlorite anion has been named recently as a top
ten pollutant by the EPA (Environmental Protection Agency - 2002). The health risks associated with chronic chlorite exposure include anemia, together with nervous system problems, in infants and young children. Like other chlorinated species, chlorite is chemically inert and highly soluble in water, leading to appreciable concentrations within affected environments.[13]
The extensive use of oxochlorates, coupled to the high solubility and kinetic inertness of the salts, has made them serious fresh water pollutants of particular concern to the EPA.[1]
Because chlorine oxoanions (ClOX-) are not removed by conventional water treatment
processes, new procedures are needed and biological perchlorate reduction is a promising alternative, converging to the bioremediation concept. Bioremediation is defined as the process whereby organic wastes are biologically degraded under controlled conditions to an innocuous state, or to levels below concentration limits established by regulatory authorities. By definition, bioremediation is the use of living organisms, primarily microorganisms, to degrade the environmental contaminants into less toxic forms. It uses naturally occurring bacteria and fungi or plants to degrade or detoxify substances hazardous to human health and/or the environment.[9, 14]
1.2. Perchlorate reducing bacteria
The presence of significant concentrations of these oxoanions in the environment exerted a selective pressure on living organisms. For instance, bacteria evolved not only to withstand the presence of the polluting oxochlorates, but also to exploit their oxidative properties (ClO4–/Cl–Eo=
1.287 V; ClO3–/Cl– Eo = 1.03 V) using them as final electron acceptors in energy conserving
respiratory processes. Bacterial respiration of perchlorate and chlorate is possible under anaerobic conditions and has been established more than fifty years ago. [15] Perchlorate-reducing bacteria
(PRB) are ubiquitous and have been isolated in a broad diversity of environments such as pristine and contaminated soils and sediments. [16] In some of these environments it would be unexpected to
find PRB due to the limited abundance of (per)chlorate. However, owing to the outstanding metabolic capabilities of PRB, their proliferation in hostile environments should not be surprising. In this regard, all PRB known to date are facultative anaerobes or microaerophiles, and some of them can also use nitrate as oxidizing substrate. Regarding the use of electron donors and carbon sources, PRB can use both soluble and insoluble ferrous iron[17], simple organic acids and
microorganisms that are capable of perchlorate reduction can alternatively use chlorate. However, the same is not necessarily true for chlorate-reducing bacteria, as present data indicate that pure cultures of chlorate-reducing microorganisms are incapable of reductive respiration of perchlorate.[21] (Per)chlorate-reducing bacteria are phylogenetically diverse, taking into account that
different species isolated so far, belong to the α, β, γ and ε classes of the Proteobacteria phylum (Figure 1).[1, 21]
Figure 1. Phylogenetic distribution of perchlorate- and chlorate-reducing microorganisms (Figure reproduced from reference [21]).
Based on their metabolic capabilities, perchlorate reducing bacteria (PRB) offer a potentially viable means for the removal of ClOX- from water supplies. These microorganisms
chlorate reduction. [1, 22] Considering some factors related to the level of amino acid sequence
homology of the protein, and organization and array of cofactors, it was seen that Pcr belongs to the DMSO reductase family of mononuclear Mo-enzymes and was probably generated via duplication of a gene set followed by divergence. However, Cld does not demonstrate any obvious amino acid sequence relationship with well-characterized proteins, not even when comparing to the analogous nitrate respiratory pathways. Nevertheless, recent studies revealed some structural homologies to two other large, ancient, and functionally not well known protein families: DyPs (Dye-decolorizing Peroxidases) and EfeB (Deferrochelatase/peroxidase).[1]
ClO4- ClO3- ClO2- Cl- + O2 (3)
Figure 2. Mechanism of perchlorate and chlorate reduction by perchlorate reducing bacteria (Figure reproduced from reference [21]).
1.3. Chlorite Dismutase
Chlorite dismutase (Cld) catalyzes the splitting of chlorite into chloride anion and molecular oxygen, which is one of the central reactions in the dissimilatory reduction of perchlorate. The name ‘chlorite dismutase’ is in fact not correct, because the reaction is not a dismutation, but an intramolecular redox reaction. The systematic name for this enzyme should be chloride-oxygen oxidoreductase or chlorite O2-lyase as suggested by Hagedoorn et al. [23, 24]
Chlorite dismutases have been purified from different microorganisms and it was found through biochemical and kinetic characterization that, despite the different source, all these enzymes share common properties. The most relevant property from the perspective of using Cld enzymes as biocatalyst for bioremediation is that it catalyzes chlorite decomposition at outstanding high rates. All Cld characterized so far present a periplasmic location and are homo-multimeric complexes, each monomer presenting one iron atom associated to one heme b (Figure 3A).
At present, eight Cld crystallographic structures have been published at the PDB data base: one from Azospira oryzae strain GR-1 in complex with thiocyanate (2.10 Å)[25]; four from
Candidatus Nitrospira defluvii in complex with imidazole (1.85 Å), with cyanide (1.94 Å), mutant
R173A (2.60 Å) and mutant R173K (2.70 Å) [26]; two from Dechloromonas aromatica RCB at pH
6.5 (3.05 Å) and pH 9.0 (3.00 Å) [13]; and one from Nitrobacter winogradskyi (2.10 Å)[27].
Figure 3. Overview of Cld’s heme b containing monomer structure. (A) heme b structure [28]; (B) The monomer is shown
in green cartoon, the porphyrin in grey and the iron atom in brown (Figure 4B reproduced from reference [1]).
Figure 4. Metal binding site and possible hydrogen bonds for heme coordination reported for Cld from Azospira oryzae strain GR-1. The heme is presented as red sticks, the coordinating His170 is yellow (carbon), blue (nitrogen), and red (oxygen). The same coloring is used for the amino acids Ile119, Tyr118, Asn117, Arg183, and Trp155. The coordinating thiocyanate in this crystal structure is green and the water molecules (W) are depicted as blue circles. For clarity, a part of
the helix α8 (between the asterisks) has been omitted from this drawing. The possible hydrogen bonds are presented as
black dots. Figure was reproduced from reference [25].
Among all the reported Cld in literature, either with or without reported crystallographic structure, there are some differences in the protein quaternary structure. Namely, Cld from
Ideonella dechloratans[29] and Pseudomonas chloritidismutans[24] are homotetramers; Cld from
Dechloromonas aromatica[13] and Candidatus Nitrospira defluvii[26] are homopentamers; and Cld
from Azospira oryzae strain GR-1[25] is a homohexamer. Figure 5 shows two examples of reported
Cld quaternary structures.
Figure 5. Crystal Structure of Chlorite Dismutase from (A) Azospira Oryzae strain GR-1 (Figure reproduced from reference [25])and (B) Candidatus Nitrospira defluvii (Figure reproduced from reference [26]).
Different approaches on the catalytic mechanism for chlorite decomposition have been reported [22, 30, 31] but, recently, a mechanism[1] was proposed comprising two possible pathways
involving the heterolytic or the hemolytic cleavage of the chlorite molecule (Figure 6). In both pathways, the first step involves the formation of an enzyme–substrate Michaelis complex. On the first pathway proposed, a heterolytic bond cleavage yields the ferryl-porphyrin cation radical intermediate (compound I) and hypochlorite as the leaving group. The oxygen atom of hypochlorite acts as a nucleophile toward the electron-deficient compound I, forming a peroxychlorite anion that rapidly breaks down into two products. On the other hand, on the second proposed pathway, the same Michaelis complex reacts via homolytic cleavage of the (O)Cl−O− bond, yielding the
porphyrin complex (compound II) and the hypochloryl radical. Finally, the recombination of the radicals yields the peroxychlorite anion and then the reaction products.
Figure 6. Proposed mechanisms for chlorite decomposition and O2 evolution catalyzed by Cld (Figure reproduced from
reference [1]).
1.4. Project objectives
The main goal of this project was to study the chlorite dismutase, a b-type heme containing enzyme that catalyzes the dismutation of the chlorite anion into chloride anion and molecular oxygen.
Chapter 2
Material and methods
2. Materials and methods
2.1. Bacterial strain and culture conditions
Magnetospirillum sp. strain Lusitani 300-L batch culture was previously done (2009) and
stored at 4°C. Bacterial growth was performed in anaerobic conditions in KL medium which was supplemented at each inoculum process, after the sterilization process, with a trace element solution, that corresponded to 0.1% of the medium total volume. The medium was composed of 8.9 mM K2HPO4.3H2O, 7.1 mM NaH2PO4, 4.7 mM NH4Cl, 0.4 mM MgSO4.7H2O, 10.0 mM NaClO4,
20.0 mM NaCH3COO and the trace element solution of 14.4 mM FeSO4.7H2O, 1.7 mM
Na2MoO4.2H2O, 10.3 mM EDTA, 9.7 mM H3BO3, 421 µM NiCl2.6H2O and 570 µM
Na2SeO3.5H2O, which was first dissolved in HCl 1N and then diluted with water. The pH was
adjusted to pH 7.00 with a 5N NaOH solution.
Small scale cultures were performed in 100 ml bottles capped with butyl rubbers stoppers, crimped with aluminium capsules. O2-free medium was obtained by flushing the solution with
argon.
The KL medium was sterilized by autoclaving at 121°C, 1 atm for 20 min. The trace elements solution was sterilized by ultrafiltration and then added to the culture medium prior to its inoculation.
2.2. Genomic DNA extraction
5 ml of the bacterial culture (OD600=0.32) was centrifuged for 10 minutes at 5200 rpm.
inversion, followed by centrifugation at 14000 rpm for 5 minutes. The upper aqueous phase containing DNA was transferred to a fresh tube and 600 µl of phenol/chloroform/isoamyl alcohol (25:24:1) were added, mixed thoroughly, and then centrifuged for 5 minutes at 14000 rpm. The supernatant was transferred to a fresh tube and 360 µl of isopropanol were added to precipitate the DNA. The tube was shaken back and forth until a stringy white DNA precipitate becomes clearly visible. A centrifugation was performed for 5 minutes at 14000 rpm. DNA pellet was washed with 70% cold ethanol and DNA dissolved in 50 µl of DNase-free water.
2.3. Sequencing of pcrABCDE and cld genes
2.3.1. DNA sample for PCR
A 1 ml sample from a bacterial culture with an OD600 of 0.32 stored at 4ºC was taken under
sterile conditions and centrifuged for 3 minutes at 14000 rpm in a microcentrifuge. Supernatant was discarded and the pellet resuspended in 30 µl of DNase-free water. The bacterial cells were disrupted by heat treatment for 5 minutes in a boiling water bath. Disrupted cells were centrifuged for 5 minutes at 14000 rpm in a microcentrifuge and the DNA-containing supernatant was stored at -20°C for further use as DNA template of PCR.
2.3.2. 16s Ribosomal DNA
The 16s rDNA was amplified by PCR using reported universal primers[32, 33] (Table 2). The
PCR was performed on a final volume of 25 µl, using 50 µM of dNTPs (GE Healthcare), 1X Reaction Buffer (GE Healthcare), 1.25 U of Taq DNA polymerase (GE Healthcare), 10 pmol of reverse and forward primers (Table 2.2), 4% DMSO and 1 µl of the obtained DNA-containing sample. Amplification program was executed on a Tpersonal thermocycler (Biometra) and included an initial denaturation step at 95 ºC for 5 minutes. Then, 25 cycles composed by 30 seconds at 95ºC, 30 seconds at 48ºC and 2 minutes at 72ºC were performed. Final elongation step took 10 minutes at 72ºC. A positive control with an E. coli strain was performed using the same conditions and PCR program. Amplified products were analysed by 1% agarose gel electrophoresis in 1X TAE Buffer using GeneRulerTM 1kb DNA Ladder (Fermentas) as DNA marker. To each 5 µl of PCR product, 3
µl of Sample buffer (Quiagen) were added. Electrophoresis was held at 100 V for 30 minutes. Bands were first stained with SYBR SafeTM DNA gel staining (Invitrogen) observed and images
Table 2. Universal primers for 16s Ribosomal DNA amplification.[32, 33]
Primer name Orientation Sequence (5’-3’) Tm (ºC)
1492R Reverse GGTTACCTTGTTACGACTT 53.1
27F Forward AGAGTTTGATCCTGGCTCAG 61.0
2.3.3. cld partial gene amplification
A PCR using reported universal primers[34] was performed to amplify the chlorite dismutase
partial gene. After temperature optimization between a range of 42 and 50.7°C, three reactions were performed on a final volume of 25 µl, using 50 µM of dNTPs (GE Healthcare), 1x High Fidelity PCR Buffer with 15 mM MgCl2 (Fermentas), 2.5 U of High fidelity PCR enzyme mix (Fermentas),
20 pmol of reverse and forward primers (Table 3), 4% DMSO and 2 µl of the obtained DNA-containing sample (see 2.3.1 section). Amplification programs were executed on a Mycycler Thermal cycler (BioRad) and included an initial denaturation step at 95 ºC for 5 minutes. Then, 38 cycles composed by 30 seconds at 95ºC, 30 seconds at annealing temperature and 1 minute at 72ºC were performed. Final elongation step took 10 minutes at 72ºC. During the first 18 cycles, the annealing temperature was decreased by 0.5°C in each cycle, starting from 51°C. Amplified products were analysed by 1% agarose gel electrophoresis in 1x TAE Buffer using GeneRulerTM
1kb DNA Ladder (Fermentas) as DNA marker. To each 5 µl of PCR product, 3 µl of Sample buffer (Invitrogen) were added. Electrophoresis was held at 100 V for 30 minutes. Bands were first stained with SYBR SafeTM DNA gel staining (Invitrogen)observed and images captured on GenoSmart gel
documentation system (VWR). The PCR product was purified using QIAquick PCR purification protocol (Qiagen) and sequenced by Stab Vida (Portugal).
Table 3. Metabolic primers for chlorite dismutase gene.[34]
Primer name Orientation Sequence (5’-3’) Tm (ºC)
UCD-646R Reverse GAGTGGTAVARYTTVCGYTT 55.7
2.3.4. pcrA partial gene amplification
For the perchlorate reductase partial gene amplification by PCR using designed universal primers (see section 3.1.2 for description), after temperature optimization between a range of 44 and 53°C, four reactions were performed on a final volume of 25 µl, using 50 µM of dNTPs (GE Healthcare), 1X High Fidelity PCR Buffer with 15 mM MgCl2 (Fermentas), 2.5 U of High fidelity
PCR enzyme mix (Fermentas), 15 pmol of reverse and forward primers (Table 4), 4% DMSO and 2 µl of the obtained DNA-containing sample (see 2.3.1 section). Amplification programs were executed on a Mycycler Thermal cycler (BioRad) and included an initial denaturation step at 95 ºC for 5 minutes. Then, 38 cycles composed by 30 seconds at 95ºC, 30 seconds at annealing temperature and 30 seconds at 72ºC were performed. Final elongation step took 10 minutes at 72ºC. During the first 18 cycles, the annealing temperature was decreased by 0.5°C in each cycle, starting from 62°C. Amplified products were analysed by 2% agarose gel electrophoresis in 1x TAE Buffer using GeneRulerTM 1kb DNA Ladder (Fermentas) as DNA marker. To each 5 µl of PCR product, 3
µl of Sample buffer (Invitrogen) were added. Electrophoresis was held at 100 V for 30 minutes. Bands were first stained with SYBR SafeTM DNA gel staining (Invitrogen) observed and images
captured on GenoSmart gel documentation system (VWR). The PCR product was purified using QIAquick gel extraction kit protocol (Qiagen) and sequenced by Stab Vida (Portugal).
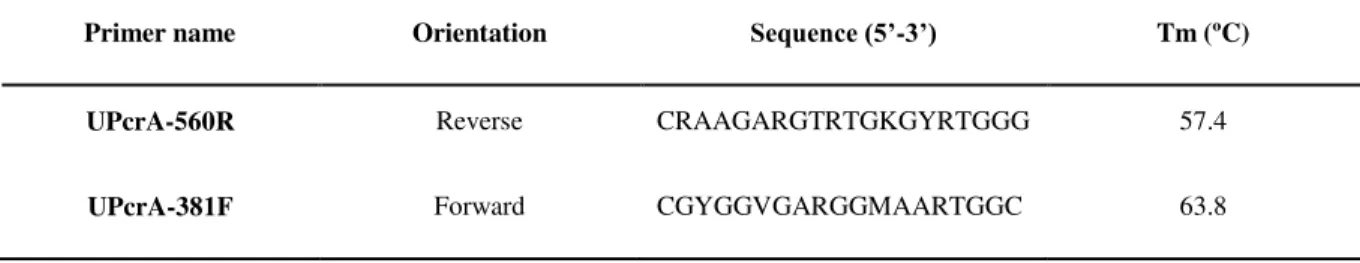
Table 4. Metabolic primers for perchlorate reductase gene.
Primer name Orientation Sequence (5’-3’) Tm (ºC)
UPcrA-560R Reverse CRAAGARGTRTGKGYRTGGG 57.4
UPcrA-381F Forward CGYGGVGARGGMAARTGGC 63.8
2.3.5. pcrA and cld genes orientation in pcr-cld regulon
For the pcrA and cld genes orientation determination, DNA between these genes, considering that pcrA and cld are in the same transcriptional orientation, was amplified by PCR using specific primers for each gene (Table 5), after temperature optimization between a range of 50 and 60°C, best conditions were achieved for a final volume of 25 µl, using 50 µM of dNTPs (GE Healthcare), 1X High Fidelity PCR Buffer with 15 mM MgCl2 (Fermentas), 2.5 U of High fidelity
µl of the obtained DNA-containing sample (see 2.3.1 section). Amplification programs were executed on a Mycycler Thermal cycler (Bio Rad) and included an initial denaturation step at 94ºC for 3 minutes. Then, 10 cycles composed by 30 seconds at 94ºC, 30 seconds at 60ºC and 6 minutes at 68ºC were performed. Then, 20 cycles composed by 30 seconds at 94ºC, 30 seconds at 60ºC and 6 minutes plus 20 seconds cycle elongation for each successive cycle were performed at 68ºC. Final elongation step took 10 minutes at 68ºC. Amplified products were analysed by 1% agarose gel electrophoresis in 1 x TAE Buffer using GeneRulerTM 1kb DNA Ladder (Fermentas) as DNA
marker. To each 5 µl of PCR product, 3 µl of Sample buffer (Invitrogen) were added. Electrophoresis was held at 100 V for 30 minutes. Bands were first stained with SYBR SafeTM
DNA gel staining (Invitrogen) observed and images captured on GenoSmart gel documentation system (VWR). The 6 kb PCR product was purified using QIAquick gel extraction kit protocol (Qiagen) and sequenced by Macrogen, Korea.
Table 5. Primers used for pcr-cld operon sequencing.
Primer name Orientation Sequence (5’-3’) Tm (ºC)
RDsInvI Reverse CGCCAATCCACCAGGAACG 71.0
PcrA-esp Forward CGCCAACAAGATCGTCG 64.3
2.3.6. Inverse PCR
2.3.6.1. pcrA gene
Genomic DNA (see 2.2 section) was digested with EcoRI (Fermentas) restriction enzyme. 1 µg of the obtained genomic DNA were incubated for 2 hours at 37ºC with 20 units of EcoRI and 1X Orange Buffer (Fermentas) in a total volume of 50 µl.
For DNA precipitation, 1 ml of cold absolute ethanol was added to the ligated DNA mix waiting 10 minutes on ice. The mixture was centrifuged at 14 000 rpm for 10 minutes and the supernatant discarded. Circular DNA dried overnight at room temperature.
To dried circular DNA 10 µl of DNase-free water were added and DNA was left on ice for 30 minutes. PCR reactions were optimized for circular DNA during this work. Six reactions were performed on a final volume of 25 µl, using 250 µM of dNTPs (GE Healthcare), 1 x High Fidelity PCR Buffer with 15 mM MgCl2 (Fermentas), 2.5 U of High fidelity PCR enzyme mix (Fermentas),
15 pmol of reverse and forward primers (Table 6), 8% DMSO and 2 µl of obtained DNA. Amplification programs were executed on a Mycycler Thermal cycler (Bio Rad) and included an initial denaturation step at 94 ºC for 4 minutes. Then, 10 cycles composed by 30 seconds at 94ºC, 30 seconds at 55ºC and 3 minutes and 30 seconds at 68ºC were performed. Then, 25 cycles composed by 30 seconds at 94ºC, 30 seconds at 55ºC and 3minutes and 30 seconds plus 2 seconds per cycle elongation for each successive cycle at 68ºC were performed. Final elongation step took 10 minutes at 68ºC. Amplified products were analysed by 1% agarose gel electrophoresis in 1 x TAE Buffer using GeneRulerTM 1kb DNA Ladder (Fermentas) as DNA marker. To each 5 µl of
PCR product, 5 µl of Sample buffer (Quiagen) were added. Electrophoresis was held at 100 V for 30 minutes. Bands were first stained with SYBR SafeTM DNA gel staining (Invitrogen) observed
and images captured on GenoSmart gel documentation system (VWR). The 1.4 kb PCR product was purified using QIAquick gel extraction kit protocol (Qiagen) and cloned in the pJET vector (Fermentas) which was then used to transform E. coli DH5α cells. Positive transformants were verified by colony PCR and then growth to perform the minipreps (NZYTech). The DNA fragments were sequenced in Stab Vida (Portugal) using the vector primers (pJET1.2 forward sequencing primer and pJET1.2 reverse sequencing primer).
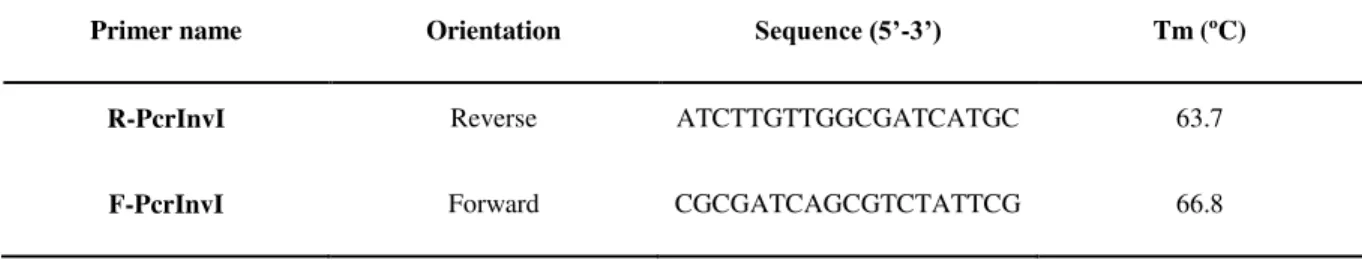
Table 6. Specific primers for pcrA inverse PCR.
Primer name Orientation Sequence (5’-3’) Tm (ºC)
R-PcrInvI Reverse ATCTTGTTGGCGATCATGC 63.7
2.3.6.2. cld gene
Genomic DNA (see 2.2 section) was digested with NcoI (Invitrogen) restriction enzyme. 0.7 µg of the obtained genomic DNA were incubated for 2 hours at 37ºC with 20 units of NcoI and 1X Buffer K (Invitrogen) in a total volume of 50 µl.
After digestion, NcoI was inactivated for 15 minutes at 70ºC. Next step was to self-circularize DNA using T4 DNA Ligase (Fermentas), mixing 50 µl of digested DNA with 1X T4 DNA Ligase Buffer and 20 units of T4 DNA Ligase in a final volume of 500 µl, incubating the mixture for 1 hour at 22°C.
For DNA precipitation, 1 ml of cold absolute ethanol was added to the ligated DNA mix waiting 10 minutes on ice. The mixture was centrifuged at 14 000 rpm in a microcentrifuge for 10 minutes and the supernatant discarded. Circular DNA dried overnight at room temperature.
To dried circular DNA 10 µl of DNase-free water were added and DNA was left on ice for 30 minutes. PCR reactions were optimized for circular DNA during this work. Six reactions were performed on a final volume of 25 µl, using 250 µM of dNTPs (MARCA), 1 x High Fidelity PCR Buffer with 15 mM MgCl2 (Fermentas), 2.5 U of High fidelity PCR enzyme mix (Fermentas), 15
ρmol of reverse and forward primers (Table 7), 8% DMSO and 2 µl of obtained DNA. Amplification programs were executed on a Mycycler Thermal cycler (Bio Rad) and included an initial denaturation step at 95 ºC for 5 minutes. Then, 25 cycles composed by 30 seconds at 95ºC, 30 seconds at 60ºC and 2 minutes at 72ºC were performed. Final elongation step took 10 minutes at 72ºC. Amplified products were analysed by 1% agarose gel electrophoresis in 1 x TAE Buffer using GeneRulerTM 1kb DNA Ladder (Fermentas) as DNA marker. To each 5 µl of PCR product, 5 µl of
Sample buffer (Quiagen) were added. Electrophoresis was held at 100 V for 30 minutes. Bands were first stained with SYBR SafeTM DNA gel staining (Invitrogen)observed and images captured
Table 7. Specific primers for cld inverse PCR.
Primer name Orientation Sequence (5’-3’) Tm (ºC)
RDsInvI Reverse CGCCAATCCACCAGGAACG 71.0
FDsInvI Forward TACGTCTCGAAGGACAAGTCG 64.3
2.4. Chlorite dismutase purification
2.4.1. First purification protocol
For Cld purification, cell extract was centrifuged 30 min at 16000×g and 4°C. The supernatant was subjected to ultracentrifugation at 180000×g for 40 min at 4°C. The supernatant contained the soluble (cytoplasmic and periplasmic) proteins while the pellet the membranes fraction. The soluble extract was dialyzed overnight against 10 mM TrisHCl pH 7.6 and stored at -20°C.
Purification of the enzyme was carried out using liquid chromatography techniques. First, The soluble extract was loaded onto a DE-52 column equilibrated with 10 mM Tris-HCl pH 7.6 and Cld eluted with the flowthrough. The latter was dialyzed against 5 mM MES pH 6.0 and then loaded onto a SP-Sepharose-FF equilibrated with the same buffer. Cld eluted at approximately 100 mM NaCl during a linear gradient to 10 mM MES pH 6.0 containing 500 mM NaCl. The Cld-containing fractions were pooled and loaded on a hydroxyapatite (HTP) column equilibrated with 1 mM potassium phosphate buffer pH 8.0. Cld eluted during a linear gradient to 250 mM from the same buffer at 75 mM. Cld fractions were pooled and stored at -20°C.
2.4.2. Second purification protocol
2.5. Determination of the molecular mass
According to the method of Laemmli [35], the subunits molecular mass was determined by
sodium dodecyl sulfatepolyacrilamide gel electrophoresis (SDS-PAGE), using 12.5% acrylamide gels that were stained with Coomassie Brilliant blue R250. To calibrate the gel, a set of marker proteins was used with the following composition (size in kDa): β-galactosidase (116), Seric Albumin (66.2), Ovalbumin (45), Lactate dehydrogenase (35), REase Bsp98 (25), β-lactoglobulin (18.4) and Lisozyme (14.4).
Size estimation of the size of the native enzyme was performed using the elution volume of Cld on a superdex 200 column (GE Healthcare) which was calibrated using the following standard proteins (size in kDa): Ovalbumin (43), Conalbumin (75), Aldolase (158) and Ferritin (440).
2.6. Mass spectrometry and identification by MALDI-TOF-MS
A Cld sample was digested using an internal protocol and analyzed in MALDI-TOF-MS. A trial to identify the enzyme was performed by Peptide Mass Fingerprint using MASCOT as search engine with MSDB, NCBinr and SwissProt as databases. Modification was performed with fixed carbamidomethyl, the variable was by oxidation and the enzyme used for digestion was trypsin. To determine the molecular mass a Cld sample was analyzed by MALDI-TOF-MS on a positive linear mode.
2.7. Kinetic studies
The catalytic activity of Cld was measured by UV-Visible spectroscopy following the decay of chlorite at 260 nm in an Agilent spectrophotometer (model 8453 DIODE ARRAY) connected with a LAUDA Ecoline RE104 cooling thermostat. At 260 nm neither chloride nor molecular oxygen interferes. The molar absorption coefficient for chlorite at 260 nm is 155.2 ± 0.6 M-1cm-1. [36]
2.8. X-ray crystallographic structure
The first approach of chlorite dismutase crystallization trials was performed at room temperature using a crystallization robot (Oryx 8, Douglas Instruments). Crystals appeared in several conditions which were used in scale-up tests. The latter were carried out using the hanging drop vapour diffusion method.
For the optimization of the crystallization conditions different variables such as temperature (4°C and 20°C), protein concentration (10 to 30 mg/ml), use of different additives, concentration of precipitant agent, and drop volume were tested. Also, attempting to improve the quality and size of the crystals obtained, different types of seeding techniques were performed, although with no success.
The best crystals, with ca 0.2 mm, grew at 4ºC within 7 days using a precipitant solution containing 0.2 M NaCl, 0.1 M phosphate-citrate buffer pH=4.2 and 16% PEG 8K. The drops were prepared with 2 µl of 28 mg/ml protein solution, 1 µl of the precipitant solution, 1 µl of 100 mM L-cysteine, and 1 µl of 100 mM potassium thiocyanate. The two additives have proven to be important for diffraction quality. Before freezing in liquid nitrogen, crystals were soaked in a solution containing 0.2 M NaCl, 0.1 M phosphate-citrate buffer pH=4.2, 20% PEG 8K, and 15% glycerol.
Complete data sets were collected at PXIII of the Swiss Light Source (SLS, Switzerland). The crystals diffracted up to 3.0 Å resolution and belong to the P21 space group. Statistics, structure
determination and refinement are described in the 3.3. section.
2.9. Spectroscopic studies
2.9.1. UV/Visible spectroscopy
UV-Visible spectra were recorded at room temperature either on a spectrophotometer SHIMADZU 1800 or in an Agilent spectrophotometer (model 8453 DIODE ARRAY) connected with a LAUDA Ecoline RE104 cooling thermostat.
2.9.1.1. Heme quantification
Cld at 1.7 µM was incubated with 20 % pyridine, 75 mM NaOH and the spectrum was measured upon the addition of 1.0 mM sodium dithionite.
2.9.1.2. UV-Visible pH titrations
UV-Visible spectra were performed at room temperature using a pH range between 3 and 13. The following buffer systems were used to obtain the desired pH: 50 mM citrate buffer, 50 mM monobasic potassium phosphate, 50 mM dibasic potassium phosphate and 50 mM tripotassium phosphate. Cld was prepared separately at each pH with an enzyme concentration of 3.13 µM and the pH confirmed using a micropH 2002 Crison pH-meter. All spectra were baseline corrected according to the Cld concentration.
2.9.1.3. Cld ligands
For studying the interaction between Cld and the exogenous ligands imidazole, azide and nitrite; 1.69 µM Cld was incubated in 50 mM KPB pH 6.0 with these ligands at concentration 1, 10 and 1 mM, respectively.
2.9.2. CW-EPR
CW-EPR spectra were recorded on an X-band continuous wave spectrometer, Bruker EMX 300, equipped with a double-mode cavity (Model ER4116DM) and a continuous-flow cryostat (Oxford Instruments) that allows working in a temperature range between 4 and 300 K. All the spectra were obtained in nonsaturating conditions at 10 K using microwave power, 0.6 mW; modulation amplitude, 5 G; modulation frequency, 100 kHz.
In order to study the effect of redox agents on Cld, the protein was degassed with argon and put into an anaerobic Glovebox ([O2] < 1 ppm). Dithionite reduction and ferricyanide oxidation
reactions were performed inside the glovebox, then the protein solution was loaded into an EPR tube, sealed and then taken from the glovebox and immediately frozen in liquid nitrogen. Air oxidation reaction was performed by thawing the dithionite-reduced sample at room temperature and opening the tube to allow air to diffuse into the protein solution.
Chapter 3
Results and discussion
3. Results and discussion
3.1. Preliminary taxonomic studies
3.1.1. Phylogenetic analysis
Previous to this work, a preliminary taxonomic study for the classification of the bacterial isolate used as source of the Cld enzyme was performed by Prata et al.[38] However, due to the small
number of DNA sequences annotated in online databases to that date, an incorrect identification was performed. For this reason, in the present work this study was reproduced and the phylogenetic analysis was recalculated using more complete databases and newer informatic tools. In both cases, the phylogenetic analysis was based on the nucleotide sequence of the 16S rRNA gene.[39] Briefly,
the 16S ribosomal RNA is a component of the bacterial ribosomes and is approximately 1.5 kb in length. The bacterial chromosome can harbor one or multiple copies of the 16S rRNA gene which are highly conserved, i.e. contain the same nucleotide sequence. The 16S rDNA contains both highly-conserved and hyper-variable regions and the latter provide signature sequences that are specific of a certain genus or species of microorganisms. Thus, 16S rDNA sequence analysis is a key tool widely used to identify bacteria rapidly and accurately.
Universal primers 27F and 1492R [32, 33] were used to amplify the 16s rRNA gene yielding
1000 bp
-1500 bp -
The BLAST search showed that the 16S rDNA sequence of the isolated bacteria shares 99% sequence homology with the 16S rDNA genes of Magnetospirillum bellicus strain VDYT
(EF405724), Magnetospirillum sp. strain WD, Dechlorospirillum sp. strain DB, Dechlorospirillum
sp. cl-31-Sarno River, and several uncultured bacteria. The phylogenetic analysis of the 16S rRNA gene sequence revealed that the bacterial isolate belongs to the family Rhodospirillaceae of the
Alphaproteobacteria and is closely related to the Magnetospirillum strains VDYT, WD, DB and
cl-31 Sarno River (Figure 8).
Interestingly, the phylogenetic analysis also indicated that the bacterial isolate used in this work is relatively distant from the magnetosome forming species M. magneticum, M.
magnetotacticum,M. gryphiswaldense and A. Polymorphum, which are not PRB. In order to obtain
more information about this point, a PCR of the genes that encode the proteins responsible for magnetosome biosynthesis (mamI and mamL) should be performed, though this study remained to be done.
Figure 7. Agarose gel electrophoresis of the PCR product obtained using primers 27F and 1492F (designed for amplification of the 16S rDNA). Gene RulerTM 1kb DNA Ladder from Fermentas (left) and amplification of gene
Figure 8. Phylogenetic tree based on the nucleotide sequence of the gene encoding the 16S rRNA. The evolutionary history was inferred using the Neighbor-Joining method.[40] The bootstrap consensus tree inferred from 10000 replicates is
taken to represent the evolutionary history of the taxa analyzed.[41] Branches corresponding to partitions reproduced in less
than 40% bootstrap replicates are collapsed. The percentage of replicate trees, in which the associated taxa clustered together in the bootstrap test (10000 replicates), are shown next to the branches.[41] The evolutionary distances were
computed using the p-distance method[42] and are in the units of the number of base differences per site. The analysis
involved 24 nucleotide sequences. All positions containing gaps and missing data were eliminated. There were a total of 1252 positions in the final dataset. Evolutionary analyses were conducted in MEGA5.[43]
Magnetospirillum bellicus VDY Magnetospirillum sp. cl-31-Sarno river Magnetospirillum sp. WD
Isolate Per1
Dechlorospirillum sp. DB
Magnetospirillum aberrantis SpK
Magnetospirillum gryphiswaldense MSR-1 Aquaspirillum polymorphum DSM 9160 Magnetospirillum magneticum AMB-1
Magnetospirillum magnetotacticum DSM 3856 Dechlorospirillum sp SN1
Nitrobacter winogradsky Nb-255 Ideonella dechloratans ATCC51718 Azoarcus sp. BH72
Dechloromonas aromatica RCB Azospira oryzae N1
Azoarcus sp. BS2-3 Azospira oryzae GR-1 Azospira sp. Cu-d-1 Azospira suillum PS Isolate Per2
Azospira sp. cl-6-Sarno river Azospira sp. PCC
Candidatus Nitrospira defluvii
3.1.2. Detection and analysis of pcrA and cld partial gene sequences
In order to confirm the presence of the genes encoding the enzymes responsible for (per)chlorate reduction and chlorite dismutation in the bacterial isolate under study, two PCR using universal primers were performed. For cld gene, the universal primers already published [34] were
used. On the other hand, it was necessary to design universal primers for the pcrA gene. To accomplish this, complete and partial annotated gene sequences of Azospira oryzae GR1, Azospira
sp. PCC, Dechlorosoma sp. JD125, Dechloromonas sp. JD15, Dechloromonas agitata CKB, Dechloromonas sp. PC1, Magnetospirillum sp. WD and Magnetospirillum sp. cl-31-Sarno River were aligned. From the multiple alignments two highly-conserved areas were chosen (Figure 9, yellow highlighted) and one set of forward and reverse primers were designed. The sequence of these primers contained, respectively, 5 and 7 degenerated sites (Figure 9 in grey) out of 19 and 21 nucleotide positions.
Azospira Oryzae TATCAAATACCCTTTGATTCGCGTTGGCGAACGTGGCGAAGGAAAGTGGC Dechlorosoma Sp PCC TATCAAATACCCTTTGATTCGCGTTGGCGAACGTGGCGAAGGAAAGTGGC Dechloromonas SpPC1 TATCAAATACCCTTTGATTCGCGTTGGCGAACGTGGCGAAGGAAAGTGGC Dechlorospirillum Sp WD GATTAAGCATCCATTGATCCGCATCGGCCAACGCGGAGAGGGCAAATGGC Dechlorospirillum Sp DB ---ATCCGCATCGGCCA-CGCGGCGAGGGCAAATGGC Dechlorosoma Sp JD125 CCTGAAATATCCTTTGATCCGGGTTGGCGAACGCGGGGAGGGCAAGTGGC Dechloromonas Sp JD15 CCTGAAATATCCTTTGATCCGGGTTGGCGAACGCGGGGAGGGCAAGTGGC Dechloromonas Agitata CCTGAAATATCCTTTGATCCGGGTTGGCGAACGCGGGGAGGGCAAGTGGC ** ** * *** * ** ** ** ** ** ****
Azospira Oryzae GGCGCGCGACCTGGGAGGAGGCGCTCGACATGATTGCCGACAAGTGCGTC Dechlorosoma Sp PCC GGCGCGCGACCTGGGAGGAGGCGCTCGACATGATTGCCGACAAGTGCGTC Dechloromonas Sp PC1 GGCGCGCGACCTGGGAGGAGGCGCTCGACATGATTGCCGACAAGTGCGTC Dechlorospirillum Sp WD GCCGCGCCAGTTGGGAGGAGGCGCTGCAACTGATCGCTGACCGCACGGTC Dechlorospirillum Sp DB GCCGCGCCAGTTGGGACGAGGCGCTGCAACTGATCGCTGACCGCACGGTC Dechlorosoma Sp JD125 GGCGTGCCACGTGGGAGGAGGCACTAGACCTTACCTCAGACAAGATAATC Dechloromonas Sp JD15 GGCGTGCCACGTGGGAGGAGGCACTAGACCTTATCTCAGACAAGATAATC Dechloromonas Agitata GGCGTGCCACGTGGGAGGAGGCACTAGACCTTATCTCAGACAAGATAATC * ** ** * ***** ***** ** * * ** * *** **
![Figure 1. Phylogenetic distribution of perchlorate- and chlorate-reducing microorganisms (Figure reproduced from reference [21])](https://thumb-eu.123doks.com/thumbv2/123dok_br/16481012.732410/30.918.141.791.345.838/phylogenetic-distribution-perchlorate-chlorate-reducing-microorganisms-reproduced-reference.webp)
![Figure 2. Mechanism of perchlorate and chlorate reduction by perchlorate reducing bacteria (Figure reproduced from reference [21]).](https://thumb-eu.123doks.com/thumbv2/123dok_br/16481012.732410/31.918.268.686.384.761/mechanism-perchlorate-chlorate-reduction-perchlorate-reducing-reproduced-reference.webp)
![Figure 3. Overview of Cld’s heme b containing monomer structure. (A) heme b structure [28] ; (B) The monomer is shown in green cartoon, the porphyrin in grey and the iron atom in brown (Figure 4B reproduced from reference [1]).](https://thumb-eu.123doks.com/thumbv2/123dok_br/16481012.732410/32.918.176.754.460.815/figure-overview-containing-structure-structure-porphyrin-reproduced-reference.webp)
![Figure 5. Crystal Structure of Chlorite Dismutase from (A) Azospira Oryzae strain GR-1 (Figure reproduced from reference [25])and (B) Candidatus Nitrospira defluvii (Figure reproduced from reference [26]).](https://thumb-eu.123doks.com/thumbv2/123dok_br/16481012.732410/34.918.104.814.309.678/structure-chlorite-dismutase-azospira-reproduced-candidatus-nitrospira-reproduced.webp)
![Figure 6. Proposed mechanisms for chlorite decomposition and O 2 evolution catalyzed by Cld (Figure reproduced from reference [1]).](https://thumb-eu.123doks.com/thumbv2/123dok_br/16481012.732410/35.918.129.794.165.449/proposed-mechanisms-chlorite-decomposition-evolution-catalyzed-reproduced-reference.webp)