O
R
I
G
I
N
A
L
A
R
T
I
C
L
E
Characterization of additives in NR formulations by TLC-IR
(UATR)
Lidia Mattos Silva Murakami
1,2, Joyce Baracho Azevedo
1,2, Milton Faria Diniz
3, Leandro Mattos Silva
4and
Rita de Cássia Lazzarini Dutra
1*
1
Instituto Tecnológico de Aeronáutica, São José dos Campos, SP, Brasil
2
Tenneco Automotive Brasil, Cotia, SP, Brasil
3
Divisão de Química – AQI, Instituto de Aeronáutica e Espaço – IAE, São José dos Campos, SP, Brasil
4
Petroquímica Brasken S.A., Capuava, Santo André, SP, Brasil
Abstract
It is a well-established fact that rubber accelerator is essential to provide solution in different sectors. However, there is
a reversal process which can reduce the material performance. Sulfur accelerators donors and organic peroxides have been presented as a solution to the problem. The methodology development that can separate or characterize those
components is a challenge and still allows gaps, explained by the application of conventional technique to reach this goal. This study aimed at contributing to the use of off-line coupling of thin layer chromatography (TLC)/infrared spectroscopy (IR) by Universal Attenuated Total Reflection (UATR) for analysis of N-cyclohexyl-2-benzotiazolsulfenamide (CBS), tetraethylthiuram disulfide (TMTD) and dicumyl peroxide (DCP), in natural poly-cis-isoprene (NR) formulations, containing naphthenic oil. The best results were obtained for the plasticizer and DCP, in formulations that had a greater proportion of these compounds. The separation of CBS and TMTD was made with less effectiveness, due to bands
overlapping.
Keywords: additives, characterization, NR, TLC, UATR.
1. Introduction
The competitive industrial environment has demanded of companies more agility in terms of response to the market.
Companies have embraced some strategies to accomplish
that specific objective and knowing better their own product
substantially is one of them. Not only does this route lead to better process variable evaluation, but also it improves
the employment of technology.
Products based on polymeric materials play a major role in Aerospace and Automotive Industry considering they can withstand harsh environments, reduces production costs and offers flexibility in processing. As a light solution, the polymers
successfully replace metals and traditional compounds due
to its mechanical resistance, corrosion resistance and ease
in the manufacture of parts with narrower tolerance.
A vulcanized rubber is a widely applied polymer throughout several industrial areas. Its counterpart Natural rubber (NR) for instance, is applied in the automotive industry, like tires and hoses[1], and in aerospace industry, as flexible joints[2]. It contains elastomer, vulcanization
agent and accelerator, reinforcing filler, stabilizers, among
other additives. This mixture is vulcanized after passing through thermal processes or after been exposed to high energy radiation[3]. Among these additives, it is possible to
highlight the accelerators, which reduce the cure time and consequently the process costs. They are classified according
to their chemical composition and / or their speed of action
in vulcanization. In Table 1, a list of the most common accelerators[4] is included.
Acknowledge the accelerators and vulcanizing agent of
a formulation is paramount for new polymers development.
Not only does it aid in reducing process costs, but also it
increases the solution spectrum for industry. Taking this into
account, the reversion problem is brought to our attention,
when the polysulfide bond breaks causing reduction of
crosslink density, changing the distribution of the bonds
types and modification in main chain structure. These facts lead to reduced article performance.
Reversion resistance of rubber compounds has been
obtained by controlling the sulfur content in the crosslink
bonds, by applying sulfur donor accelerators and organic peroxides. In terms of thermal stability, their higher bond
strength gives more stability than the carbon/sulfur/carbon bond and gives good properties for aging resistance[5].
Study of sulfur vulcanization has been mentioned in the literature[6]. TMTD, among others accelerator polysulfides
such as N,N-pentamethylenethiuram disulfide (CPTD) were employed and it was concluded that CPTD and its polysulfides are thermally less stable than is TMTD.
As reported by Joseph et al.[7], among the various organic
sulphur containing compounds, TMTD has been the most
stability and negligible modulus reversion. According to radical mechanism, at vulcanization temperatures, interactive
recombination will lead to the formation of accelerator
polysulphides (TMTPs).
Influence of sulfenamide accelerators, such as CBS, on cure kinetics and properties of NR has been studied as well[8].
CBS accelerator shows the fastest sulfur vulcanization rate and the lowest activation energy (Ea) because CBS accelerator
produces higher level of basicity of amine species than other sulfenamide accelerators.
The effect of temperature and peroxide concentration has been studied[9] . DCP was evaluated among other peroxides.
It was observed that DCP and di-tert-butyl peroxide (DTBP)
showed lower amounts of decomposition products compared
to other peroxides studied. DCP and DTBP were suggested as better curing agents for NR based rubber compounds at
higher peroxide concentrations.
TMTD, CBS and DCP were the additives used in this
current paper to be separated and characterized by reason
of their chemical characteristics, good properties, including
thermal stability and lower content decomposition products.
Fourier Transform Infrared Spectroscopy (FT-IR) is one of the techniques that has been largely applied for materials identification and characterization. However, due to the
wide variety of products in the extracts of rubbers and the
small concentration of additives contained, it is necessary
to perform a separation step by thin layer chromatography
(TLC). The association of Infrared Spectroscopy Technique (TLC/IR)[10,11] is required for chemical structure characterization, although it is hardly used in the literature.
In the TLC/ IR technique, using the KBr pyramids, the
extract is dissolved in the solvent used for the extraction
and applied on a suitable silica plate, which is developed
in a closed chromatographic vat using a mobile phase
(eluent). The plate is dried and the spots revealed, with
specific product. The spots are grated and placed in a tube
containing the KBr pyramids. A small amount of solvent
used in the extraction is added to conduct the sample to
the top of the pyramid. After solvent evaporation, this top is removed, scraped and pressed as a KBr disc for IR analysis. This technique was started in our laboratories, in the Brazilian Institute, Instituto de Aeronáutica e Espaço (IAE), in 1996[10] and it was used for additives analysis, in rubbers [12] as in paints, with positive results[11].
Chauveau et al.[13] separated and identified several
vulcanization agents (CBS, MBT, TMTM, DPG, MBT
hospital rubbers (synthetic polyisoprene-isoprene - IR and copolymer of butadiene and styrene - SBR), by means of the TLC technique. In parallel, the identification of additives by GLC coupled to a mass spectrometer (MS) method was
made to confirm the presence or absence of additives. The samples were extracted in acetone and two types of eluents were used: toluene/ethyl acetate/ammonia
(100/5/1) to extract CBS, MBT, IPPD, 6PPD, TMTM and toluene/acetone/ammonia (45/65/1) to extract DPG, MBT, TMTM. UV fluorescent light was applied to reveal the eluted deposits. It was demonstrated that the TLC method was more efficient in the identification of additives, since it presented greater thermal stability, without degradation of it, during the extraction with acetone at 66°C. Despite of it, most additives were separated by TLC, even in small amounts of formulations analyzed. and by MS, through fragmented products, there were difficulties in separating some components, such as TMTM and CBS, under the
conditions used.
Other recent studies, in IAE laboratories, were carried out to identify additives in polymers using the TLC/IR technique (off-line) and selective extraction. Among them
is the Rodrigues et al.[11] publishing, where a painting
formulation containing polyurethane (PU) and nitrocellulose (NC) was evaluated. In this study, three eluent systems were used: ethyl acetate/ethyl alcohol (70/35/30), pure toluene and toluene/ethyl acetate (70/30), applying Gibbs developer. Among the four additives of the formulation, it was possible to characterize two of them (ATBC plasticizer and oleamide slider) by UATR.
Damazio et al.[12] applied the same technique,
TLC/IR technique (off-line), for the analysis of MBT, TMQ, TMTM and TMTD additives, in ethylene propylene diene monomer terpolymer based rubber (EPDM). Two types of EPDM were evaluated with two different kinds of eluent system: an eluent system with hexane, diethyl ether and acetic acid - 70: 30: 5, and Gibbs developer. The formulation studied contained more than one additive, and thus generated band overlap, but the characteristic absorptions of sulfide additives were revealed by UATR, even though they were
in a lower proportion.
Other researches have been done to study rubber additives.
For example, the potential of FT-IR analysis of gaseous pyrolyzates (PY-G/FT-IR) for characterization of EPDM
additives has also been evaluated[14] TMTM, TMTD, and
MBT were employed in this study. Results demonstrated that the PY-G/FT-IR technique can identify additives containing Table 1. Most usual accelerators and vulcanizing agent for elastomeric compositions.
Acronym / nomenclature Acronym / nomenclature
MBT (2-mercaptobenzothiazole) ZDBC (Dibutyldithiocarbamate Zinc) MBTS (benzothiazole disulfide) ZDEC (zinc diethyldithiocarbamate) CBS (N-cyclohexyl-2-benzothiazolesulfenamide) ZDMC (zinc dimethyldithiocarbamate) TBBS (N-tert-butyl-di (2-benzothiazolesulfenamide) DPG (N, N’-diphenyl guanidine)
MBS (2- (4-Morpholinothio) benzothiazole) DOTG (Diortotolylguanidine) TMTD (Tetramethylthiuram Disulfide) DTDM (4,4’-dithiomorpholine) TMTM (Tetramethylthiuram Monosulfide) ETU (2-mercaptoimidazoline) / (ethylene thiourea)
However, the method showed some limitation to detect TMTM and TMTD due to overlapping and to similarities of their PY-G/FT-IR spectra, which could not be distinguished
from each other.
Although the quoted papers presented favorable results for rubber additives, formulations of NR containing peroxides
were not analyzed in comparison with others containing sulfur accelerator or vulcanizing agent systems. There are also limitations for detecting of some sulfur additives.
Then, in this paper, the applicability of the TLC/UATR technique was evaluated to characterization of TMTD, CBS and DCP, which are frequently found in NR and EPDM rubbers formulations, used in the industries mentioned earlier. In short, the interest of Automotive and Aerospace Companies in methodology development for problem solving
and polymer article improvement is the same.
2. Materials and Methods
2.1 Samples
The sample of NR was kindly provided by Tenneco
Automotive. In Table 2, are presented the formulations
developed for NR containing CBS or TMTD or DCP, named, respectively, NR (CBS), NR (TMTD) and NR (DCP).
2.2 Rubbers preparation
The raw material was weighed on a precision scale and
all components, except for accelerators (TMTD and CBS) and vulcanizing agent (DCP and Sulfur), were mixed in a laboratory banbury 2 liters for 240 sec., with a pylon pressure
of 4 kgf/cm2, rotation of 70 rpm and initial temperature of
40°C, to produce the masterbatch. Then it was processed in a roller form six times in an open mill (laboratory cylinder), with rotation of 40 rpm. Later, the masterbatch was accelerated in banbury, with the rest of the weighted components (TMTD,
CBS or DCP and sulfur) for 120 seconds, with 4 kgf/cm2
pylon pressure, rotation of 70 rpm and initial temperature of 40°C. Eventually, the rubber was homogenized in roller form six times in an open mill (laboratory cylinder) with a
rotation of 40 rpm and removed in blanked.
The rheometer curve interferes in the vulcanization
temperature setting of a rubber part. High temperatures can promote a reversal process, where bonds breakage occurs,
and consequently the degradation of the polymer[1].
However, the vulcanization times obtained in rheometric
tests should be performed at the same temperature as the part will be processed. The value of T90 should be the time to be used when the material thickness is between 1.5 and 2.5 mm[1].
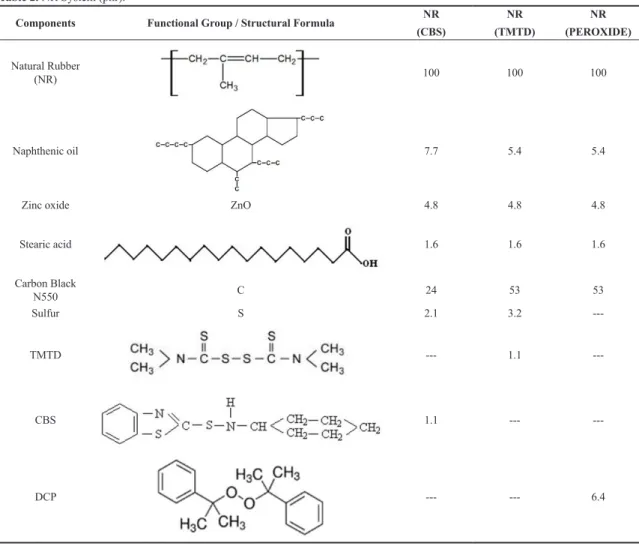
Table 2. NR System (phr).
Components Functional Group / Structural Formula NR (CBS)
NR
(TMTD)
NR
(PEROXIDE)
Natural Rubber
(NR) 100 100 100
Naphthenic oil 7.7 5.4 5.4
Zinc oxide ZnO 4.8 4.8 4.8
Stearic acid 1.6 1.6 1.6
Carbon Black
N550 C 24 53 53
Sulfur S 2.1 3.2
---TMTD --- 1.1
---CBS 1.1 ---
In this current paper, the compounds vulcanization
times were determined from the rheometric curves using a
rheometer, from Alpha Technologies, model MDR 2000, at the same vulcanization temperature (T90@160ºC), and
the specimens thickness were 2.5 mm[1].
For the preparation of vulcanized rubbers slabs, a hydraulic press with vulcanization time of 6 min., temperature in the
plateaus of 160°C and 150 kgf/cm2 of closing pressure
was used.
2.3 Characterization equipment/conditions
For the TLC analysis, Merck glass chromatography plates, measuring 20 × 20 cm and covered with Silica Gel D60 and glass vat were applied. In the FT-IR analysis, a spectrometer
FT-IR Spectrum One PerkinElmer (resolution 4 cm-1, gain
1, 4000 to 400 cm-1, 20 scans) was used. FT-IR spectra
were obtained, by reflection technique, using the UATR accessory. It was used 20 scans for UATR analysis, based
on other papers that they have successfully published for paint [11], rubber [12] and oil analysis[15]. This scan number is a
suitable to smooth noises in the FT-IR reflection techniques, such as UATR, diffuse reflectance (DRIFT) and attenuated total reflection (ATR).
2.4 Methodology
2.4.1 Extraction and analysis by Infrared spectroscopy (IR) of rubbers and additives
Vulcanized rubber slabs were cut into small pieces,
in sizes of approximately 3.0 x 3.0 x 3.0 mm and placed for extraction in acetone in Soxhlet extractor. The rubber
samples were prepared by pyrolysis (thermal degradation) and analyzed as liquids by transmission, by IR. The extracts containing the additives were analyzed by reflection, UATR.
2.4.2 TLC analysis
The TLC plates were labeled and identified with pencils and placed in an oven for 15 minutes at 105°C for activation,
to remove moisture from the silica. With the aid of a micro
syringe, approximately 15 μL of extract and pure additives were deposited, side by side, for use as a color reference and retention factor (Rf) on the TLC plate. The additives (TMTD, CBS and DCP), which were powders, were previously solubilized in acetone. The TLC plate was placed
in the glass vat and the eluent was added until it reached the 1 cm mark. The run time of the eluent on the plate was
timed until it reached the upper marking of 2 cm. Rf is the
ratio of the distance traveled by the sample to the distance
traveled by the eluent in the system (Figure 1).
After running the eluent, excess solvent from the
plate was evaporated at room temperature in the exhaust
hood, then eliminated in an oven for 15 minutes at 105°C. Four eluent systems were used, based on literature data:
Toluene[16]; Toluene/Acetone (45/65) and Toluene/Ethyl
Acetate (100/5)[13], but in the last two cases ammonia was
removed, due it is a product considered to be hazardous to health and the fluorescent developer replaced by the Gibbs reagent. The Toluene/Acetone system (65/45) was also used.
After oven dried and cooled to room temperature, the plates were revealed with a solution of 0.3g of the Gibbs reagent (2,6-dichloro-p-benzoquinone-4-chloroimine) in 30ml of ethyl alcohol. The Rf values and developed colors
were noted for each eluted spot which was separated on the
TLC plate from extract and pure additives.
2.4.3 TLC/UATR analysis
The silica that contained the eluted deposits was scraped washed with 10 ml of acetone and filtered through filter
paper on a watch glass. After the eluent evaporation, at room temperature to avoid degrade the material, the samples were
analyzed by UATR (Figure 2).
3. Results and Discussion
3.1 UATR analysis of NR extracts, containing different additives
For the initial evaluation of the additives, extraction
was carried out with the appropriate solvent, acetone[10].
The extracts were analyzed by UATR as casting films, to avoid the appearance of KBr moisture bands around
3300 and 1640 cm-1, as a result of solid sample pellets
Figure 1. Preparation of the TLC plate for the deposition of the
preparation, for transmission analysis, that could interfere on the observation of NH bands of CBS accelerator.
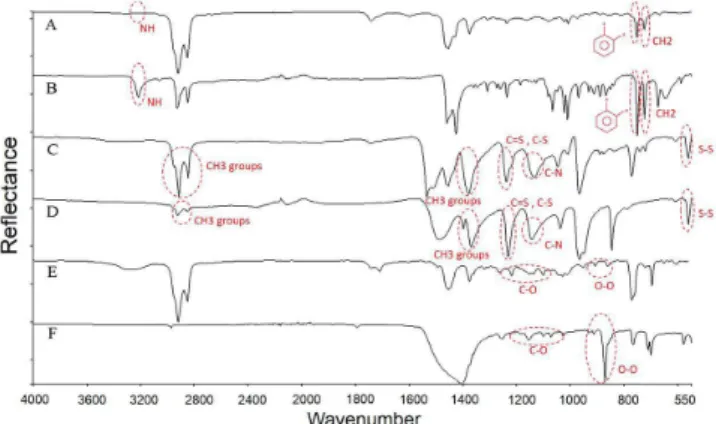
In Figure 3, it is included the UATR spectra of extracts, in
acetone, from the vulcanized NR rubbers samples, compared to additives spectra, taken as references. The objective is verifying if by analyzing of the spectra of NR extracts, it is
possible to indicate the different additives presence.
Although the extract spectrum of a rubber shows absorptions of all soluble additives in the used solvent,
meaning there are overlapping bands of other formulation
additives, it is possible to make some considerations:
• the spectra of Figures 3a, 3c and 3e are different, confirming that the formulations are not the same in terms of organic additives;
• a small number of the major CBS bands, approximately (cm-1), assigned to the following functional groups[17,18]:
3200 (NH) (very low-intensity band, better viewed when the extract spectrum was analyzed separately), 750 (ortho-substituted aromatic ring) and 730 (CH2), is present in the extract spectrum of NR (CBS). However, bands that should appear around 1500, related to
benzothiazole[18], were not visualized. There is also
overlapping, in other regions, of naphthenic plasticizer bands, that have aliphatic CH groups, which absorb at 3000-2900, 1460-1400 and 700-750, and which is in greater proportion, relative to the formulation additives (see Table 2);
• a small number of bands (cm-1) around 1240 (C=S, C-S),
1140 (C-N), 560 (S-S) characterizes the presence of TMTD[12,17] in the NR (TMTD) extract spectrum.
Despite of a greater similarity between NR extract (TMTD) and TMTD spectra that was observed in the fingerprint region, there were overlaps relative to CH3
groups bands between 3000-2900, 1400-1350, present
in other additives;
• a small number of bands (cm-1) around 1250-1100,
980-870, of variable intensity, weak to strong, assigned to the C-O (stronger) and O-O (weaker) groups[18],
may serve as the basis for characterization of DCP presence. However, this typical intensity variation[12] makes their characterization difficult compared to other
additives. Due to other additives band interference in the formulation, it was decided to try to separate the additives, by TLC and TLC/UATR, from the others.
It does not mean that the analysis of rubber extracts was already the first step in the methodology to evaluate the indication of different additives presence.
3.2 TLC analysis of NR extracts and the different additives
Four eluent systems were used: A) toluene, already used in research on the antioxidant N-phenyl-N’-isopropyl-p-phe
nylenediamine (IPPD) in NR[10], B) toluene/acetone (65/45),
C) toluene/acetone (45/65) and D) toluene/ethyl acetate (100/5); B, C and D systems being used in our laboratories
and in research of different accelerators and antioxidants
of NR or poly (cis-isoprene) rubber (IR)[13]. Gibbs reagent,
already used in other NR research[10], was the developer.
3.3 NR (CBS)
In Table 3, TLC data for NR (CBS) rubber are included,
using toluene, toluene / acetone (65/45), toluene / acetone (45/65), toluene/ethyl acetate (100/5), as eluents, and Gibbs reagent as developer, which will respectively be referred to as: NR(CBS) – Toluene/Gibbs, NR(CBS) – Toluene/acetone (65/45)/Gibbs, NR(CBS) – Toluene/acetone (45/65) / Gibbs and NR(CBS) – Toluene / ethyl acetate (100/5)/Gibbs.
In relation to TLC analysis, only the Toluene/Acetone (45/65) / Gibbs system indicated a possible CBS separation. The other systems did not show efficiency for this procedure, since the colors of deposits and/or RF were different from
those observed for respective accelerator. It is apparently caused by the greater plasticizer content and the presence of different products concentrations in the formulation[10]
(Table 2, already shown).
3.4 NR (TMTD)
In Table 4, is included TLC data for NR(TMTD) rubber,
using toluene, toluene/acetone (65/45), toluene/acetone (45/65), and toluene / ethyl acetate (100/5) as eluents and Gibbs reagent as developer, that will be, respectively, referred to as systems: NR (TMTD) -Toluene / Gibbs, NR (TMTD) -
Figure 3. UATR spectra of the acetone extracts of the vulcanized NR, containing additives and references additives: (A) NR (CBS);
Toluene/acetone (65/45)/Gibbs, NR (TMTD) - Toluene/acetone (45/65)/Gibbs and NR (TMTD) - Toluene/ethyl acetate (100/5)/Gibbs. TLC analysis suggested that is possible to separate this accelerator, especially, by the toluene/ethyl acetate (100/5)/Gibbs (1°Rf) system.
3.5 NR (DCP)
In Table 5, are included TLC data for NR(DCP)
rubber, using toluene, toluene/acetone (65/45), toluene/acetone (45/65), and toluene/ethyl acetate (100/5), as eluents, and Gibbs reagent as developer, that will be referred to, respectively, as systems: NR (DCP) - Toluene/Gibbs, NR (DCP) - Toluene/acetone (65/45)/Gibbs, NR (DCP) - Toluene/acetone (45/65)/Gibbs By the TLC analysis, all the eluent systems showed RF closer to those observed for DCP, although some colors presented differences, possibly because of plasticizer presence, which suggests that
the separation is feasible to the accelerator by these eluent
systems, with higher accuracy for the Toluene/Acetone
4. TLC/UATR analysis
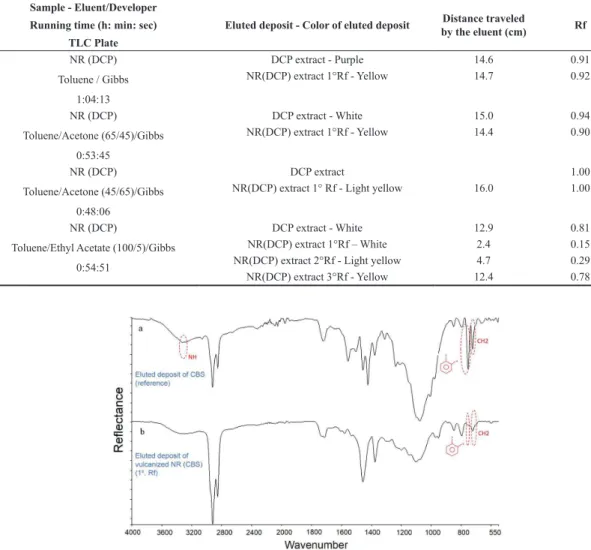
4.1 NR(CBS)
By the IR spectra analysis, the separation of CBS presumably did not occur, due to the greater presence of
plasticizer (see Table 2). There are only indications of
separation beside the evaluation of the spectrum referring
to the extract in toluene/acetone (45/65), through bands in
(cm-1), most likely assigned[17] to the groups: 3329 (NH),
2922, 2853 and 722 (CH2) and 755 (C-H ortho substitution)
(Figure 4).
An interesting fact is under conditions (toluene/Gibbs) for similar formulations of NR [6], the rubber extract usually
produces an eluted deposit, in higher RF and yellow color, which is essentially the plasticizer. Thus, the analysis of the 3°RF deposition in toluene was made to characterize the naphthenic plasticizer in the formulation, succeeding in the
applied methodology (Figure 5), since that the separated
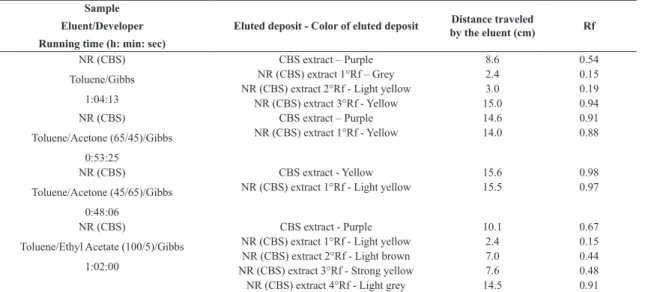
product spectrum (3°Rf) showed the same absorptions of Table 3. TLC data for NR(CBS) Systems.
Sample
Eluent/Developer
Running time (h: min: sec)
Eluted deposit - Color of eluted deposit Distance traveled
by the eluent (cm) Rf
NR (CBS) Toluene/Gibbs
1:04:13
CBS extract – Purple 8.6 0.54
NR (CBS) extract 1°Rf – Grey 2.4 0.15 NR (CBS) extract 2°Rf - Light yellow 3.0 0.19 NR (CBS) extract 3°Rf - Yellow 15.0 0.94 NR (CBS)
Toluene/Acetone (65/45)/Gibbs 0:53:25
CBS extract – Purple 14.6 0.91
NR (CBS) extract 1°Rf - Yellow 14.0 0.88
NR (CBS) Toluene/Acetone (45/65)/Gibbs
0:48:06
CBS extract - Yellow 15.6 0.98
NR (CBS) extract 1°Rf - Light yellow 15.5 0.97
NR (CBS)
Toluene/Ethyl Acetate (100/5)/Gibbs 1:02:00
CBS extract - Purple 10.1 0.67
NR (CBS) extract 1°Rf - Light yellow 2.4 0.15 NR (CBS) extract 2°Rf - Light brown 7.0 0.44 NR (CBS) extract 3°Rf - Strong yellow 7.6 0.48 NR (CBS) extract 4°Rf - Light grey 14.5 0.91
Table 4. TLC data for the NR (TMTD) system.
Sample
Eluent/Developer
Running time (h: min: sec)
Eluted deposit
(Color of eluted deposit)
Distance traveled
by the eluent (cm) Rf
NR (TMTD) Toluene / Gibbs
1:12:44
TMTD extract - Dark yellow 3.6 0.23
NR (TMTD) extract 1°Rf - Light yellow 6.6 0.41 NR (TMTD) extract 2°Rf - Light purple 8.7 0.54
NR (TMTD) Toluene/Acetone (65/45)/Gibbs
0:46:45
TMTD extract - Dark purple 13.0 0.81 NR (TMTD) extract 1°Rf - Light purple 14.0 0.87
NR (TMTD) Toluene/Acetone (45/65)/Gibbs
0:48:06
TMTD extract - Yellow 14.3 0.89
NR (TMTD) extract 1°Rf - Light yellow 15.0 0.94 NR (TMTD) extract 2°Rf - Light yellow 15.9 0.99
NR (TMTD)
Toluene/Ethyl Acetate (100/5)/Gibbs 1:00:00
TMTD extract - Dark purple 8.9 0.56
4.2 NR (TMTD)
Despite the fact there would be loss of material and spectral resolution in the TLC/IR technique, perhaps caused by the conditions applied, mainly due to transmission/pellet
technique[8] application, Figure 6 shows that in the UATR
spectrum of extract, in toluene, of TMTD after TLC, there are very similar absorptions to the reference TMTD UATR spectrum, also to the UATR spectrum of the extract, in toluene/acetone (45/65), which does not happen with the TMTD spectra, obtained in other eluent/developer systems. The Figure suggests that in the analysis of NR spectra, in TLC/UATR technique, the reference spectrum of analyzed accelerator should be used, under the same conditions as the TLC analysis.
By TLC analysis, toluene/ethyl acetate (100:5)/Gibbs that would be used to separate the TMTD, and this can be better visualized by comparing NR(TMTD) (1°Rf) and
TMTD spectra, after TLC, in this system (Figure 7), and
with discussion of the spectra being made according to data found in the literature[12].
In recent paper[12], it was evaluated the additives separation,
including TMTD, in ethylene propylene diene monomer terpolymer (EPDM), with other eluent systems. It was
mentioned that despite the fact there was some overlap of
bands, it was possible to indicate in spectra obtained after TLC, in conditions (70% of hexane / 30% of ethyl ether and
5% of acetic acid), two absorptions in 1240 cm-1 (C=S, C-S)
and 560 cm-1 (S-S) of TMTD, also associated to the bands
shape of sulfur compounds, even in a small proportion in the formulation (also around 1phr, as in current paper).
In Figure 7, albeit there is also overlap, notably in the region of 3000-2800 and 1400-1460 cm-1, of CH
2 and CH3 groups,
the C-N band, around 1140 cm-1, common bands to other
additives, the absorptions of geminated methyl group,
between 1380-1350 cm-1 and around 560 cm-1 (S-S), of
TMTD[12,17], as well as their shape, are better visualized in
the rubber extract spectra, in comparison with the TMTD spectrum, after TLC, suggesting that the used conditions, toluene / ethyl acetate (100:5) / Gibbs, are suitable for the NR rubber, for this purpose. In addition, the TLC analysis Table 5. TLC data for the NR (DCP) system.
Sample - Eluent/Developer
Running time (h: min: sec)
TLC Plate
Eluted deposit - Color of eluted deposit Distance traveled
by the eluent (cm) Rf
NR (DCP) Toluene / Gibbs
1:04:13
DCP extract - Purple 14.6 0.91
NR(DCP) extract 1°Rf - Yellow 14.7 0.92
NR (DCP) Toluene/Acetone (65/45)/Gibbs
0:53:45
DCP extract - White 15.0 0.94
NR(DCP) extract 1°Rf - Yellow 14.4 0.90
NR (DCP) Toluene/Acetone (45/65)/Gibbs
0:48:06
DCP extract 1.00
NR(DCP) extract 1° Rf - Light yellow 16.0 1.00
NR (DCP)
Toluene/Ethyl Acetate (100/5)/Gibbs 0:54:51
DCP extract - White 12.9 0.81
NR(DCP) extract 1°Rf – White 2.4 0.15 NR(DCP) extract 2°Rf - Light yellow 4.7 0.29 NR(DCP) extract 3°Rf - Yellow 12.4 0.78
Figure 4. UATR spectra (after TLC, in toluene/acetone (45/65): (a) Eluted deposit of CBS (reference); (b) eluted deposit of vulcanized
showed Rf of the NR(TMTD) rubber extract equal to that observed for the TMTD (reference), indicating the TLC/UATR coupling was effective, as an indication of this accelerator
4.3 NR (DCP)
By the TLC analysis, all eluent systems used were efficient for the separation of DCP, with better result for Figure 5. UATR spectra (after TLC): (a) Eluted deposit, in toluene, of vulcanized NR (CBS) (3º Rf); (b) naphthenic oil.
Figure 6. UATR spectra: (a) Eluted deposit of TMTD, after TLC, in toluene/acetone (45/65); (b) Eluted deposit of TMTD, after TLC, in
toluene; (c) TMTD, as received; (d) Eluted deposit of TMTD, after TLC, in toluene/acetone (65/45); (e) Eluted deposit of TMTD, after TLC, in toluene/ethyl acetate (100/5).
Figure 7. UATR (after TLC) spectra: (a) eluted deposit of TMTD, in toluene/ethyl acetate (100/5); (b) eluted deposit of vulcanized NR
demonstrated by the UATR analysis, Figure 8. In this figure,
the similarity of the spectra can be noted as well and, with the
bands (cm-1) being around 1250-1100, 980-870, of variable
intensity, weak to strong, assigned to the C-O (stronger) and
O-O (weaker) groups[12], that may fit as reference in the
characterization of the DCP presence, which can be better observed, meeting the TLC data.
After these results, the TLC-IR(UATR) analysis applied to separate and characterize NR additives such as CBS, TMTD and DCP, was considered available to rubber quality control in laboratories because is faster and simpler
than methodologies involving other coupling types such
as TG/IR[19]. In this study[19], although good results were
reached for sulfur additives such as MBT and TMTM,
they were characterized by a complex methodology of its
degradation products. Plasticizer was not detected, whereas in the TLC/UATR showed in this current paper, naphthenic oil was separated and characterized. Degradation studies are not necessary too. However, such methods can be considered complementary, if it necessary wide characterization of
rubber additives.
5. Conclusion
UATR analysis of acetone NR extracts showed some
differences in the formulations, the TMTD presence
were better demonstrated. However, there are overlaps of bands of other additives. Therefore, it is necessary a separation/identification step, such as TLC/IR.
By TLC and TLC/UATR analysis, it was only evidenced the CBS separation/identification using the toluene/acetone system (45/65). By TLC/UATR analysis, it was possible to characterize the naphthenic oil presence, with the system (toluene/Gibbs). Perhaps, this separation/identification has been facilitated by this additive, paraffinic oil, being present in a higher proportion in the formulation (7.7 phr) than the other accelerators like CBS and TMTD (5.4 phr) in their
specific formulations.
TLC analysis suggested that is achievable to separate TMTD, specifically by the toluene/ethyl acetate (100/5) / Gibbs (1°Rf) system. TLC/UATR analysis confirmed this indication, despite of some bands overlaps, which was once registered in EPDM rubber formulations, apparently because of the small TMTD amount in referred formulations.
By the TLC/UATR analysis, all eluent systems used were efficient for the separation of DCP, predominantly the Toluene/Ethyl Acetate (100/5)/Gibbs, 3°Rf, constituting
the best methodology result in terms of characterization
(TLC) and identification (UATR). It may be explained by the higher quantity of the additive (6.4 phr) in relation to the others (1.1 phr), in the specific formulations.
The decision to use the same curing time for all formulations did not affect the analysis because the results showed the
additives separation by TLC and their identification by
FT-IR (UATR), by characteristics bands of DCP (Figure 8)
and TMTD (Figure 7). The unambiguous separation and
identification of CBS may have been impaired due to the higher content of plasticizer in its formulation, which may
have been the factor that facilitated the separation and
identification of naphthenic oil (Figure 5).
In short, it was concluded that the developed TLC/UATR
methodology for studying the additives not only has it contributed to the potential of formulations characterization
in the automotive industry, but also could be applied in the
aerospace area. The reason is related to these compounds
that can be present in NR and EPDM formulations. It is a multiplier effect of acquired technical knowledge, being
extremely useful to predict specific properties for different applications.
6. Acknowledgements
This study was supported in part by the National Senior Professor Program (PVNS) from the Coordenação de Aperfeiçoamento Pessoal de Nível Superior (CAPES). Figure 8. UATR spectra: (a) eluted deposit of DCP, in toluene; (b) eluted deposit of vulcanized NR (DCP), in toluene; (c) eluted deposit
7. References
1. Ciência e Tecnologia da Borracha. Retrieved from in 2017,
March 28, from http://ctborracha.com
2. Mohan, C. H. V. R., Ramanathan, J., Kumar, S., & Gupta, A.
V. S. S. K. S. (2011). Characterization of Materials Used in
Flex Bearings of Large Solid Rocket Motors.Defence Science
Journal, 61(3), 264-269. http://dx.doi.org/10.14429/dsj.61.52.
3. Chemikeys. Retrieved from in 2017, April 18, from http://www. chemkeys.com/blog/wp-content/uploads/2008/09/polimeros. pdf
4. Grinson, E. C. (2010). Borrachas e seus aditivos - Componentes,
Influências e Segredos. Porto Alegre: Ed. Letra & Vida.
5. D’Angelo, A. (2008). Peróxidos resistentes ao oxigênio para
vulcanização contínua em túnel de ar quente.Revista Borracha
Atual, 1-35. Retrieved in 2017, May 25, from Retrieved from
http://www.retilox.com.br/astecnicos/download/peroxidos1. pdf
6. Reyneke-Barnard, C. P., Gradwell, M. H. S., & Mcgill, W.
J. (2000). N,N’Pentamethylenethiuram disulfide- and N,N´´
-Pentamethylenethiuram Hexasulfide-accelerated Sulfur Vulcanization. I. Interaction of Curatives in the Absence of Rubber.
Journal of Applied Polymer Science, 77(12), 2718-2731. http://
dx.doi.org/10.1002/1097-4628(20000919)77:12<2718::AID-APP200>3.0.CO;2-E.
7. Joseph, A. M., George, B., Madhusoodanan, K. N., & Alex,
R. (2015). Current status of sulphur vulcanization and
devulcanization chemistry: Process of vulcanization.Rubber Science, 28(1), 82-121.
8. Charoeythornkhajhornchai, P., Samthong, C., & Somwangthanaroj,
A. (2017). Influence of sulfenamide accelerators on cure kinetics and properties of natural rubber foam. Journal of Applied
Polymer Science, 134(19), 44822. http://dx.doi.org/10.1002/
app.44822.
9. Kruželák, J., Sýkora, R., & Hudec, I. (2014). Peroxide
vulcanization of natural rubber. Part I: effect of temperature
and peroxide concentration. Journal of Polymer Engineering, 34(7), 617-624.
10. Dutra, R. C. L. (1996). Aplicação de técnica de TLC-IR em
estudos de separação, identificação e quantificação de aditivos
em borrachas. Polímeros: Ciência e Tecnologia, 6(2), 26-31. 11. Rodrigues, V. C., Diniz, M. F., Mattos, E. C., & Dutra, R. C.
L. (2016). Separação e identificação de aditivos em tinta por
TLC-IR/ UATR e extração seletiva.Polímeros: Ciência e
Tecnologia, 26(Special Number), 68-74.
12. Damazio, D., Campos, E. A., Diniz, M. F., Mattos, E. C., &
Dutra, R. C. L. (2016). TLC/IR (UATR) off-line coupling for
the characterization of additives in EPDM rubber compositions.
Polímeros: Ciência e Tecnologia, 26(1), 74-80.
13. Chauveau, S., Hamon, M., & Leleu, E. (1991). Separation and identification of various vulcanization agents and antioxidants in two types of rubber by chromatographic and spectrometric methods. Talanta, 38(11), 1279-1283. http://
dx.doi.org/10.1016/0039-9140(91)80106-A. PMid:18965298. 14. Sanches, N. B., Cassu, S. N., Diniz, M. F., & Dutra, R. C. L.
(2014). Characterization of additives typically employed in
EPDM formulations by using FT-IR of gaseous pyrolyzates.
Polímeros: Ciência e Tecnologia, 24(3), 269-275.
15. Mueller, D., Ferrão, M. F., Marder, L., Costa, A. B., & Schneider,
R. C. S. (2013). Fourier Transform Infrared Spectroscopy (FTIR) and multivariate analysis for identification of different vegetable oils used in biodiesel production. Sensors, 13(4), 4258-4271. http://dx.doi.org/10.3390/s130404258. PMid:23539030. 16. Wake, W. C., Tidd, B. K., & Loadman, M. J. R. (1983). Analysis
of rubber and rubber-like polymer (3rd ed.). New York: Applied
Science.
17. Smith, A. L. (1979). Applied infrared spectroscopy. New York:
John Wiley & Sons.
18. Wolfang, W. (1987). Tópicos de espectroscopia no infravermelho.
São José dos Campos: ITA.
19. Sanches, N. B., Cassu, S. N., Diniz, M. F., & Dutra, R. C.
L. (2015). TG/FT-IR characterization of additives typically
employed in EPDM formulations.Polímeros: Ciência e
Tecnologia, 25(3), 247-255.