Optical, Magnetic and Dielectric Properties of Non-Liquid
Crystalline Elastomers Doped with Magnetic Colloids
A.M. Figueiredo Neto,
Instituto de F´ısica, Universidade de S˜ao Paulo,Caixa Postal 66318, 05315-970, S˜ao Paulo, SP, Brazil
M.H. Godinho,
Faculdade de Ciˆencias e Tecnologia e CENIMAT, Universidade Nova de Lisboa,
Quinta da Torre, P-2829-516 Caparica, Portugal
T. Toth-Katona, and P. Palffy-Muhoray
Liquid Crystal Institute, Kent State University, P.O.Box 5190, Kent, Ohio 44242-0001, USA
Received on 8 November, 2004; revised version received on 13 December, 2004
Magnetic nanoparticles from magnetic colloidal suspensions were incorporated in the urethane/urea elastomer (PU/PBDO) by swelling fully crosslinked elastomer samples with a toluene and ferrofluid mixture. It is shown that ferrofluid grains can be efficiently incorporated into the matrix of elastomers. The dependence of the bire-fringence of both the pure and ferrofluid-doped elastomer samples on strain is linear. The ratio of birebire-fringence to strain of the ferrofluid-doped samples is greater than that of the pure elastomer samples, indicating that fer-rofluid grains are oriented by the strained polymer network. We propose that this strain-induced orientation is due to the shape anisotropy of the nanoparticles.
1
Introduction
Complex soft solids, such as liquid crystal elastomers [1] and ferrogels [2] are distinguished by their ready response to even modest stimuli. Because their sensitivity and re-sponsivity makes them well suited for sensor and actuator applications, they are the subjects of considerable current interest.
Polypropylene oxide based urethane/urea elastomers have been widely used as pervaporation membranes. Their versatility allows the possibility of the design and realiza-tion of a wide variety of microstructures [3]. Recently, it was found that mechanical stress induces the formation of a variety of different patterns in these materials [4,5], and that the microstructures formed at the surfaces, revealed by atomic force microscopy (AFM), can be tuned by varying the magnitude and direction of the externally applied me-chanical field [6].
Ferrofluids, or magnetic fluids [7-9], are colloidal sus-pensions of small magnetic grains, with typical dimensions of the order10nm, dispersed in a liquid carrier. Ferroflu-ids, in the absence of external fields, are optically isotropic, and possess large magnetic susceptibility. However, fields which orient the grains, such as magnetic [10] and surface [11, 12] fields, induce birefringence in ferrofluids. Two dif-ferent types of ferrofluids are available. Surfacted and ionic ferrofluids differ in the physical processes used to avoid agglomeration of the grains. Surfacted ferrofluids (SF F) consist of grains, usually magnetite (F e3O4), coated with surfactants, consisting of amphiphilic molecules (e.g., oleic
acid and aerosol sodium di-2 ethylhexyl-sulfosuccinate) to prevent their aggregation. Steric repulsion between grains acts as a physical barrier [13] which keeps the grains in the solution, stabilizing the colloid. If the grains are dispersed in a polar medium (e.g., water), two layers of surfactant are needed to form an external hydrophilic layer. Surfactant molecules with polar heads can be cationic, anionic or non-ionic. On the other hand, when grains are dispersed in a nonpolar medium (e.g., light mineral oil, toluene, octane, hexane, cyclohexane), a single surfactation is enough, with the polar head of the surfactant attached to the surface of the grains and the carbonic chain in contact with the carrier fluid. In the case of ionic ferrofluids [14], repulsive interac-tion is maintained by electrostatic forces.
Elastomers swollen with ferrofluid particles, known as ferrogels, have received considerable attention [15,16]. They are usually formed either by precipitation of the mag-netic particles in the polymer material before, during or after the cross-linking process [17], or by mixing the polymer so-lution and the fully formed magnetic sol together, and subse-quently polymerizing [18]. These materials present remark-able magnetoelastic and magnetostrictive properties. Ferro-gels present giant elastic response when subjected to (even modest) magnetic fields. This property, in particular, has not only interest from the fundamental point of view (coupling between elasticity and magnetic torque) but also allows in-teresting technological applications for this complex mater-ial.
the elastomer is to swell the fully cross-linked material with a solvent containing ferrofluid particles, and then remove the solvent. The magnetic particles are expected to diffuse into the elastomer together with the solvent, and then re-main trapped in the network once the solvent is removed by evaporation during drying.
In this paper, we describe the process of producing ferro-gels in this way, and discuss characterization of the material and its response by using atomic force microscopy (AFM) and electric permittivity and magnetic susceptibility mea-surements. Optical birefringence measurements as function of strain are used on both pure and doped samples to study strain induced orientational order. Our main interest is to in-vestigate the orientational order produced in these materials as consequence of mechanical strain.
2
Experimental
2.1
Sample preparation
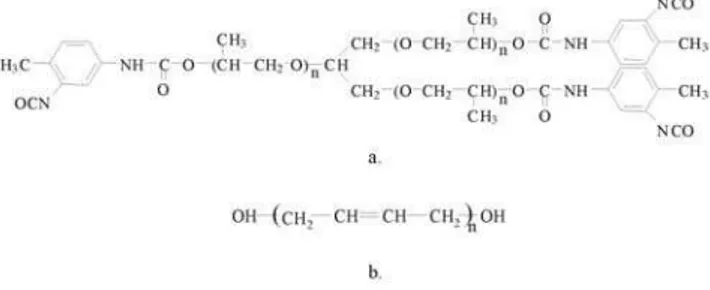
The urethane/urea elastomer was prepared by the reaction of the end groups of the tri-functional polypropylene oxide-based isocyanate prepolymer (PU) (Fig.1a) with molecular weight of 3500, and polybutadiene diol (PBDO) (Fig.1b) with molecular weight of2800, catalyzed by dibutyltin di-lauryate (DBTDL).
Figure 1. Chemical structures of: a) tri-functional polypropylene oxide-based isocyanate prepolymer (PU), n=20; b) polybutadiene diol (PBDO), n=50.
The PU and PBDO prepolymers, in a molar ratio of3 : 2
(PU: PBDO), were dissolved in toluene, under nitrogen at-mosphere according to the procedure described in ref. [19]. Following a 30minperiod during which reaction was al-lowed to proceed, the solution was simultaneously cast and sheared by moving a calibrated Gardner casting knife with speed of 5mm/s, onto a coated glass plate, at room tem-perature. After curing in an oven at 75o
C for 3.5 h, the elastomer was exposed to air. The reaction of water from at-mospheric moisture with excess of isocyanate groups in PU yields urea linkages. The colorless elastomer film, approxi-mately150µmthick, was removed from the glass substrate, and was studied subsequently as a free standing film.
2.2
Ferrofluid doping
The SF F used to dope the elastomer was obtained from Ferrotec Corp. [20]. The ferrofluid is from the EMG 911
series, consisting of magnetite (F e3O4) grains in a mineral oil carrier. The typical grain diameter is10nm, the satu-ration magnetization is11mT, and the viscosity is below
5 mP a·s. The volume fraction of magnetite in the fer-rofluid is between3to15%. Although ferrofluid grains are typically referred to as spheres, in fact, they have irregu-lar, somewhat elongated shapes, resembling potatoes. This shape anisotropy can be seen in AFM experiments on dried ferrofluids [21], and is responsible for the ability of ferroflu-ids to mechanically orient liquid crystals [22]. In addition to this grain shape anisotropy, small scale aggregation usu-ally occurs in ferrofluids, resulting in the formation dimers and trimers [23], which are again elongated in shape.
A mixture of ferrofluid in toluene with volume ratio4 : 1
was prepared to swell the elastomer and to allow the mag-netic grains to diffuse into the sample. No agglomeration of magnetic grains was observed in the mixture. The solu-tion was stable, remaining homogeneous during the6days
of monitoring. Elastomer samples of varying sizes were cut from the150µmthick sheets. To dope with ferrofluid, elas-tomer samples were immersed in the toluene-ferrofluid so-lution and were allowed to stand undisturbed for8 hours. After rinsing in toluene to remove any excess ferrofluid from the surfaces, samples were placed in a vacuum oven for dry-ing for8hours. All of the above processes were carried out at room temperature. After drying, the elastomer samples, which were initially transparent, acquire a brown color due to the presence of magnetite grains. The dimensions of the sample after drying remain the same (within our accuracy: length and width measured with a paquimeter and thickness with a micrometer) as the previous undoped sample.
2.3
Atomic force microscopy
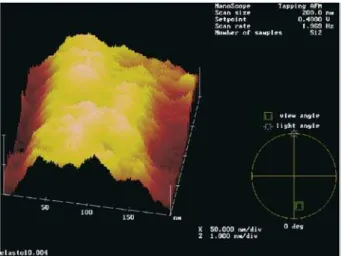
Atomic force microscopy (AFM) was carried out on freshly cut surfaces of pure (undoped) and doped (ferrogel) sam-ples. Fig. 2 shows the AFM pictures of undoped and fer-rofluid doped elastomer. The surfaces studied were edges of the elastomer film, formed by cutting perpendicular to the largest sample surfaces, in the yz plane of the laboratory frame (see Fig. 2a).
Figure 2b. Atomic force micrographs of elastomer samples in tap-ping mode: undoped elastomer, cross section in thexyplane.
Figure 2b shows the typical surface structure of the un-doped elastomer sample on the200nmscanning scale. The pattern is rather featureless, indicating an essentially flat sur-face. On the other hand, the pattern of the ferrofluid doped sample (Fig. 2c) presents a different topography, character-ized by peaks and valleys. The peaks, with typical widths in the range of∼20to∼50nm, correspond to the ferrofluid grains and small-scale aggregates incorporated in the elas-tomer matrix.
Figure 2c. Atomic force micrographs of elastomer samples in tap-ping mode: ferrofluid doped elastomer, cross section in the xy
plane.
2.4
Optical measurements
In order to study strain induced order, we determined the dif-ference in the optical phase shift for light polarized parallel and perpendicular to the stretching direction. The experi-mental geometry is shown in Fig. 3.
Figure 3. Sketch of the optical setup. The laser beam propagates along thexaxis, P and A are the directions of the axes of the polar-izer and analyzer. The sample is stretched in the direction indicated by the arrows.
A HeNe laser beam (λ= 632.8nm), polarized along the
z direction after passing through polarizer P, propagates along thexaxis and is normally incident on a sample, which is stretched in the direction indicated by the arrow. The transmitted light passes through analyzerAparallel to the
yaxis and its intensity is measured by a photodiode. The sample can be stretched along the direction∼30o
from the
zaxis. Without the stretching, the sample is isotropic and the measured intensity of transmitted light is zero. As the sample is stretched, it becomes birefringent. We have mea-sured the transmitted intensity as a function of sample strain. The maximum sample elongation was∆l=l−lo≃1mm; typical sample dimensions were100µm×4mm×7mm, and elongation was along the direction of longest sample di-mensionlo= 7mm.
2.5
Paramagnetic
susceptibility
measure-ments
A ferrofluid doped sample with the same dimensions as above was placed in a magnetic field gradient, and the force on the sample was measured using an Entran force sensor. The ferrogel sample, suspended from the arm of the Entran sensor by a light thread, was placed near the poles of an elec-tromagnet, where the field variation measured with a Hall probe, was found to be∼ 1 kG/cmin thexdirection, as shown in Fig. 4.
The Entran force sensor uses a piezoelectric crystal whose amplified output voltage is proportional to the force on the sensor arm. The output of the amplifier was measured with an oscilloscope.
2.6
Electric permittivity (
ε
) measurements
We determined the dielectric permittivity of both pure and ferrofluid doped elastomer samples via capacitance mea-surements. We constructed parallel plate capacitors by plac-ing our samples between glass plates coated with indium tin oxide. The capacitance was measured at1and5kHz us-ing a GenRad 1615 Capacitance Bridge, with an external Hewlett-Packard Signal Generator and a Stanford Research lock-in amplifier as detector. The relative dielectric constant
εris obtained from the capacitance via
εe=
Cd εoA
(1)
wheredandAare the sample thickness and area, respec-tively.
3
Results and discussion
3.1
Swelling behavior
The urethane/urea elastomer was swelled with six different pure solvents: chloroform, toluene, acetone, isopropanol, ethanol and methanol. Samples were placed between two glass plates separated by400µmspacers to avoid bending of the elastomer during the swelling process. Solvents were introduced between the glass plates to swell samples, and sample lengths (along thez-axis) and widths (along they -axis) were measured as function of time. Typical sample dimensions are: 100µm×3mm×3mm. We define the percent relative expansion, a function of time, as
∆l(t)
lo
= l(t)−lo
lo
×100
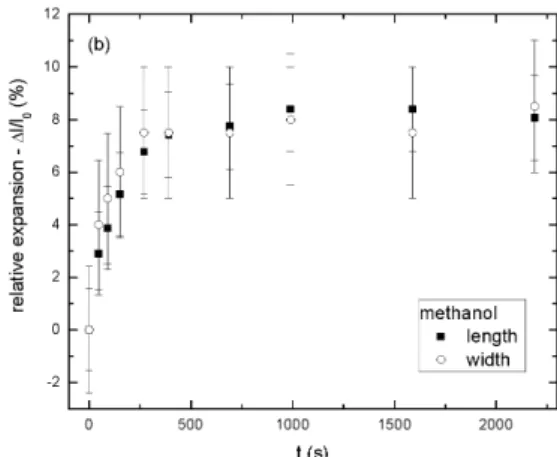
where l(t) is the length of the swelled sample, measured at the time t, and lo is the length of the unswelled sam-ple. Figures 5a and 5b show typical results of the swelling process, with chloroform and methanol, respectively. The errors were calculated using classical error-propagation pro-cedures.
Table 1 presents a summary of the characteristic swelling times (obtained fitting an exponential function to the different percent relative expansion curves) and the rela-tive expansion.
Figure 5a. Relative expansion (∆l/lo) as function of time in the
swelling experiment: (◦) length and () width of the sample in the solvent chloroform.
Figure 5b. Relative expansion (∆l/lo) as function of time in the swelling experiment: () length and (◦) width of the sample in the solvent methanol.
TABLE 1. Characteristic swelling times and relative expansion of the PU/PBDO elastomer with different solvents.
characteristic times (s) relative expansion (%) solvent length width length width chloroform 35.5±3.2 17±2 80 80
toluene 23.3±1.3 20.2±1.6 75 70 acetone 31.1±1.8 20.2±2.3 25 25 isopropanol 182±48 86±15 12 12 ethanol 151±13 156±16 12 12 methanol 148±14 85.0±0.5 8 8
sample, it seems that the solid film preparation and casting, namely the solvent evaporation associated with the shear rate of the casting knife, induced an orientational order in the cross-linked solid film that gives rise to the anisotropic be-havior observed [19]. Chloroform and toluene were the most efficient solvents, with the smallest characteristic times and largest relative expansions. Toluene was therefore chosen as the solvent for the ferrofluid doping procedure. Toluene is the solvent used to prepare the elastomer (both pre-polymers have a great affinity for this solvent) this was one of the rea-sons to choose the toluene for the ferrofluid doping proce-dure.
3.2
Ferrofluid doped samples
Magnetic susceptibility measurements were used to deter-mine the density of grains in the sample. A sample with dimensions of100µm×4mm×7mm, placed in a field gradient of1kG/cmexperienced a force of∼4×10⁻⁴N.
Assuming [24] that the typical value for the magnetic mo-ment of a grain is104 µ
B, whereµB is the Bohr magne-ton, the calculated number density of grains in the sample is∼1.5×1017cm−3. This corresponds to a concentration
of∼10%(by volume) of magnetic grains, which is in rea-sonable agreement with the topographs indicated by AFM in Fig. 2c.
An interesting observation obtained with a freshly pre-pared ferrofluid doped elastomer sample (after drying) is that the sample is similarly attracted by small permanent magnets with fields of∼100G.
Using the optical setup described in the experimental section, we measured the transmittanceT of the sample as a function of the stretching ∆l. The absolute value of the optical phase shift|∆φ|can be calculated from the values of the normalized transmittanceTN =T /TM, whereTM is the maximum transmittance, as
|∆φ|= 2 arcsin(TN).
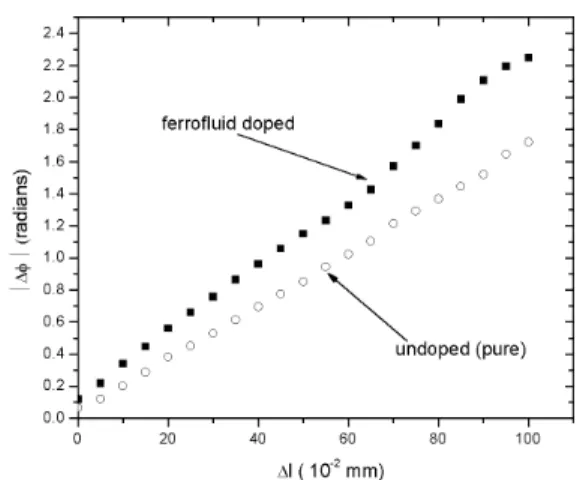
Figure 6 shows|∆φ|as a function of∆lfor a pure elas-tomer sample, and for an elaselas-tomer swelled with toluene and ferrofluid and subsequently dried.
The error, calculated from the experimental transmit-tance measurements, is about±2.5%of the|∆φ|value, for each point of Fig. 6. For both pure and ferrofluid doped sam-ples, the induced phase shift, and hence the birefringence, are proportional to the strain and hence to the stress, as ex-pected from the stress-optic law [25]. The results clearly demonstrate the influence of the presence of magnetic grains in the elastomeric matrix, which increases the stress-induced optical phase shift compared to the values obtained in un-doped samples. We note that although it is recognized in the literature [2,16] that the stress in the network is cou-pled to the magnetization, the origins of this coupling have not been identified. We propose that the coupling, and this stress-induced optical phase shift, originates in the mechani-cal orientation of anisometric grains (and small smechani-cale aggre-gates of grains). In this picture, the long axes of grains and aggregates become parallel to the direction of elongation of
the elastomer in order to reduce the free energy of the de-formed elastomer. It is interesting to note that the shape anisotropy of both grains and small scale aggregates on the average, has quadrupolar symmetry, while the correspond-ing magnetic moment is dipolar. Ferrofluids therefore com-bine dipolar and quadrupolar symmetry when incorporated into the elastomer matrix.
Figure 6. Absolute value of the strain-induced optical phase shift (|∆φ|) as a function of the sample stretch (∆l) at∼25o
Cfor pure and ferrofluid doped elastomer.
We have estimated the absolute value of the optical anisotropy [23] of our ferrofluid doped samples assuming perfectly aligned ferrofluid particles. The particles are con-sidered to be prolate ellipsoids particles with axes of length
2aand2b, (a > b), and aspect ratiob/a= 0.93969, which corresponds to a shape anisotropy of about 5%. In this framework, the ellipsoidal ferrofluid grain has different de-polarizing factors for light polarized parallel or perpendicu-lar to the infinite-fold symmetry axis of the grain [26]. This shape anisotropy imposes to the grain aform birefringence
[27,28], which is now evaluated in our case. The volume fraction of particles is10%, and we obtain the absolute value of the birefringence at saturation [23]|∆n| ≃ 8×10⁻⁴.
In our experiment above, we note that the maximum phase shift increase due to the presence of the ferrofluid particles is 0.4 rad, and fordo = 100 µm thick samples (at this point we have assumed that the stretching does not signif-icantly modify the sample thickness) andλ = 632.8 nm, |∆nexp| = 4×10⁻⁴. There is therefore reasonable agree-ment between theoretical estimates and experiagree-mental obser-vations. Let us discuss now the hypothesis made about the invariance of the sample thickness (d) upon stretching in this evaluation. In a more realistic picture,
d do
≈ lo
lmax
In all the cases studied, a small hysteresis was observed in a cycle increasing and after decreasing∆l. We have also verified that the ferrofluid doped sample, not stretched but subjected to a magnetic field up to13kG, does not exhibit a field-induced phase shift. At this relatively large field, it is expected that the magnetic moments of the grains align par-allel to the field in a N´eel-type rotation of the magnetization [29], without physical rotation of the grains, which remain fixed in the elastomer structure.
Capacitance measurements were carried out to deter-mine the dielectric constant of elastomer samples, both un-doped and un-doped with ferrofluids. The results were inde-pendent of frequency, between1and5kHz. The dielectric constants of the doped and undoped samples were found to be 14.1 and10.5, respectively. We can make a crude es-timate of the expected value of the dielectric constant εe of the elastomer doped with ferrofluid using simple effec-tive medium theory. The effeceffec-tive dielectric constantεeof a mixture consisting of volume fraction(1−p)of compo-nentUwith dielectric constantεUand volume fractionpof componentFwith dielectric constantεF is [30]
(1−p) εU−εe
εU+ 2εe
+pεF−εe εF + 2εe
= 0. (3) Assuming that at low frequencies the dielectric constant of the metal magnetic particles |εF| >> εe, we get, using
p= 0.1,
εe=
εU
3p−2 = 15.0 (4)
in reasonable agreement with the measured value of 14.1.
4
Conclusion
We have shown that ferrofluid grains can be efficiently incorporated into the matrix of PU/PBDO elastomers by swelling fully crosslinked elastomer samples with a toluene and ferrofluid mixture. The magnetic particles remain em-bedded in the elastomer after the solvent is removed. The presence of ferrofluid particles is evidenced by AMF, mag-netic susceptibility and dielectric measurements. The de-pendence of birefringence of both pure and ferrofluid doped elastomer (ferrogel) samples on strain is linear, as expected. The ratio of birefringence to strain of the ferrogel samples is greater than those of the pure elastomers, indicating that fer-rofluid grains are oriented by the strained polymer network. Although the mechanism of the coupling between the orien-tation of grains and clusters and the network has not yet been clearly identified, we propose it is due to shape anisotropy.
Acknowledgement
We acknowledge the Fundac¸˜ao de Amparo `a Pesquisa do Estado de S˜ao Paulo (FAPESP) and the U.S. National Sci-ence Foundation under grant DMR - 0132611 for financial support. Ms. Liou Qiu and Dr. O. D. Lavrentovich, from the characterization facilities of the LCI, KSU are acknowl-edged for the AFM measurements.
References
[1] M. Warner and E.M. Terentjev,Liquid Crystal Elastomers, Oxford University Press, Oxford (2003).
[2] M. Zr´ınyi, L. Barsi, and A. B¨uki, J. Chem Phys.104, 8750 (1996).
[3] C.-T. Zhao, M.N. de Pinho, Polymer40, 6089 (1999).
[4] M.H. Godinho, J.L. Figueirinhas, C.-T. Zhao, and M.N. de Pinho, Macromolecules33, 7675 (2000).
[5] M.H. Godinho, J.L. Figueirinhas, C.-T. Zhao, and M.N. de Pinho, Mol. Cryst. Liq. Cryst.365, 447 (2001).
[6] M.H. Godinho, L.V. Melo, and P. Brogueira, Mat. Sci. Eng. C-Bio S23, 919 (2003).
[7] S. S. Papell, US Patent 3.215.572, October 9th(1963).
[8] R. E. Rosensweig and R. Kaiser,NTIS Rep.No. NASW-1219 (1967).
[9] R. E. Rosensweig, Ferrohydrodynamics Cambridge Univ. Press, Cambridge, (1985).
[10] Magnetic Fluids and Applications Handbook , edited by B. Berkovski and V. Bashtovoy, Begell House, Wallingford (1996).
[11] C. Matuo, A. Bourdon, A. Bee, and A. M. Figueiredo Neto, Phys. Rev. E56, R1310 (1997).
[12] M. Magalh˜aes, A.M. Figueiredo Neto, A. Bee, and A. Bour-don, J. Chem. Phys.113, 10246 (2000).
[13] S. W. Charles and J. Popplewell, inFerromagnetic Material, edited by E. P. Wohfarth, North-Holland Publishing Com-pany, Vol. 2, Amsterdam, (1980).
[14] R. Massart, C. R. Acad. Sci. Paris291C, 1 (1980).
[15] M. Zr´ınyi, L. Barsi, and D. Szab´o, J. Chem Phys.106, 5685 (1997).
[16] T. Mitsumata, K. Ikeda, J. P. Gong, Y. Osada, D. Szab ´o, and M. Zr´ınyi, J. App. Phys.85, 8451 (1999).
[17] J.E. Mark, Brit. Polym. J.17, 144 (1985).
[18] W. Haas, M. Zr´ınyi, H-G. Killian, and B. Heise, Colloid. Polym. Sci.271, 1024 (1993).
[19] A.C. Trindade, M.H. Godinho, and J.L. Figueirinhas, Poly-mer45, 5551 (2004).
[20] http://www.ferrotec.com
[21] C. Quilliet, P. Fabre, and V. Cabuil, J. Phys. Chem.97, 287 (1993).
[22] F. Brochard and P. G. de Gennes, J. Physique31, 691 (1970).
[23] M. F. da Silva and A. M. Figueiredo Neto, Phys. Rev. E48, 4483 (1993).
[24] M.H. Sousa, F.A. Tourinho, J. Depeyrot, G.J. da Silva, and M.C.F.L. Lara, J. Phys. Chem. B105, 1168 (2001).
[25] M. Doi,Introduction to Polymer Physics, Clarendon Press (1996).
[26] J. A. Osborn, Phys. Rev.67, 351 (1945).
[27] E. Frederick and C. Houssier,Electric Dichroism and Elec-tric Birefringence, Oxford: Oxford University Press (1973).
[28] H. W. Davies and J. P. Llewellyn, J. Phys. D: Appl. Phys.12, 1357 (1979).
[29] L. N´eel, Ann. Geophys.5, 99 (1949); C.R. Acad. Sci.228, 664 (1949).