ARTIGO ORIGINAL
The Evaluation of QT Intervals During
Diagnosis and After Follow-Up in
Acromegaly Patients
Avaliação do Intervalo QT no Momento do Diagnóstico e Durante o
Seguimento Clínico em Doentes com Acromegália
1. Department of Endocrinology and Metabolism. Ataturk Education and Research Hospital. Ankara. Turkey. 2. Department of Cardiology. Ataturk Education and Research Hospital. Ankara. Turkey.
Recebido: 04 de Novembro de 2013 - Aceite: 17 de Fevereiro de 2014 | Copyright © Ordem dos Médicos 2014
Husniye BASER1, Nihal AKAR BAYRAM2, Burcak POLAT1, Berna EVRANOS1, Reyhan ERSOY1, Engin BOZKURT2,
Bekir CAKIR1
Acta Med Port 2014 Jul-Aug;27(4):428-432
ABSTRACT
Introduction: It was aimed to calculate QT intervals in patients with acromegaly and to reveal its correlation between QT intervals, and
growth hormone and insulin like growth factor-1.
Material and Methods: Forty-one patients with acromegaly were enrolled into the study. Another 41 individuals with similar features,
such as comorbid diseases, age and sex constituted the control group. The electrocardiographies of patients with acromegaly were evaluated at the baseline and after the follow-up. Only one electrocardiography was performed for controls. QT maximum, QT mini-mum, QT dispersion, corrected QT maximini-mum, corrected QT minimum and corrected QT dispersion were calculated.
Results: Baseline QT maximum, QT dispersion, corrected QT maximum and corrected QT dispersion were significantly longer than
the values of controls. Corrected QT maximum and corrected QT dispersion were significantly shorter after the follow-up, compared to the baseline in patients. QT maximum, QT dispersion, corrected QT maximum and corrected QT dispersion after the follow-up were not statistically different from the values of controls. Except the negative correlation between growth hormone and corrected QT dispersion in patients after the follow-up, no other correlation was detected between QT values and growth hormone or insulin like growth factor-1 levels. Corrected QT dispersion was found to be related with the disease duration in patients.
Discussion: For acromegaly patients, it is important to detect clinical predictors of cardiac arrhytmias. QT dispersion is considered a
beneficial predictor for ventricular arrhytmias. When compared to controls, prolonged QT intervals were determined in our acromegalic patients.
Conclusion: We consider that QT intervals may also be utilized in the evaluation of increased cardiovascular risk in patients with
acromegaly.
Keywords: Acromegaly; Arrhythmias, Cardiac; Electrocardiography; Heart Rate.
RESUMO
Introdução: O estudo teve como objectivo a determinação do intervalo QT em doentes com acromegália e a análise da correlação
entre o intervalo QT e a concentração de hormona do crescimento e de IGF-1 (insulin-like growth factor-1).
Material e Métodos: O estudo englobou 41 doentes com acromegália. O grupo de controlo englobou 41 indivíduos com
característi-cas semelhantes no que se refere a comorbilidades, idade e género. A electrocardiografia de doentes com acromegália foi obtida no início do estudo e após o follow-up. Foi apenas obtido um electrocardiograma no grupo de controlo. Foram calculados o QT máximo, QT mínimo, dispersão do intervalo QT, QT máximo corrigido, QT mínimo corrigido e dispersão do intervalo QT corrigido.
Resultados: Os valores do QT máximo basal, dispersão do intervalo QT, QT máximo corrigido e dispersão do QT corrigido foram
sig-nificativamente mais prolongados no grupo de doentes com acromegália do que nos controlos. O QT máximo corrigido e a dispersão do QT corrigido foram significativamente mais curtos durante o seguimento clínico, quando comparados com os valores basais dos doentes. O QT máximo, dispersão do QT, QT máximo corrigido e dispersão do QT corrigido durante o seguimento clínico não foram estatisticamente diferentes dos valores obtidos nos controlos. Com excepção de uma correlação negativa entre os valores da hormona do crescimento e a dispersão do QT corrigido em doentes durante o seguimento clínico, nenhuma outra correlação foi assinalada entre os valores do intervalo QT e as concentrações de hormona do crescimento e de IGF-1. Concluiu-se que a dispersão do intervalo QT está correlacionada com a duração da doença nos doentes com acromegália.
Discussão: Em doentes com acromegália, é importante a detecção de preditores clínicos de arritmia cardíaca. A dispersão do
inter-valo QT é considerada um preditor relevante de arritmias ventriculares. Os doentes com acromegália englobados no nosso estudo apresentaram intervalos QT prolongados, quando comparados com os controlos.
Conclusão: A avaliação do risco cardiovascular em doentes com acromegália deve englobar a determinação do intervalo QT. Palavras-chave: Acromegalia; Arritmias Cardiacas; Electrocardiografia; Frequência Cardíaca.
INTRODUCTION
Acromegaly is mostly caused by pitiutary tumors secreting growth hormone (GH) and characterised by increased levels of GH and serum insulin like growth factor-1 (IGF-1). Both GH and IGF-1 play a role in the physiology of cardiovascular system. In those with acromegaly, adverse cardiovascular events are the leading causes of increased
mortality. Arrhythmia can be detected in 40% of patients with acromegaly.1 Severity of the ventricular arrhythmia is
correlated with left ventricular hypertrophy.1 Normalization
of serum IGF-1 and GH levels can decrease increased left ventricular mass. However, the effect of decreased left venticular mass either on ventricular functions or prevelance
35
35 ano s a p rom ov er as ciê DI CA PO RTUG UESA 1979 - 2014ARTIGO ORIGINAL
of ventricular arrhythmia still remains unclarified. Detection of pathological electrocardiography findings in patients with acromegaly in remission can imply the presence of anatomically permanent arrhythmogenic pathways caused by irreversible fibrotic process.
QT intervals are electrocardiographic measurements of depolarization and repolarization periods. QT dispersion is the difference between the longest (QT max) and shortest QT (QT min) intervals in 12-derivation-electrocardiography (ECG). Corrected QT (QTc) and QTc dispersion can be beneficial in the estimation of morbidity and mortality in certain pathological conditions2,3 and play a role in the
determination of potential proarrhythmia. Increased QT dispersion is correlated with increased risk of arrhythmia. In our study, we planned to measure QT intervals (i.e. QT max, QT min, QT dispersion, QTc max, QTc min and QTc dispersion) in patients with acromegaly and to research the correlation of GH and IGF-1 levels with QT dispersion.
MATERIAL AND METHODS
Patients with acromegaly treated in the Department of Endocrinology and Metabolism, Ataturk Education and Research Hospital were enrolled into the study. An approval was obtained from the local ethics committee.
Study Population
Forty-one patients with acromegaly (22 women and 19 men) were included into the study. The records of 35 patients (21 women and 14 men) were reached after the follow-up. Among patients, mean duration of follow-up was 4.26 ± 2.20 years (between min 1 year and max 11 years). While 20 patients were in remission, 15 were out of remission. Controls, composed of 41 individuals, were of similar features to those of patients with acromegaly in terms of age, sex and distribution of comorbid diseases, such as diabetes mellitus (DM) and hypertension (HT). In light of clinical and laboratory findings, including elevated serum GH and IGF-1 levels, and failure of serum GH to drop to below 1 μg/L following an oral glucose load of 75 g, acromegaly was diagnosed. Patients with acromegaly were also evaluated as to complications and accompanying systemic conditions, such as DM, HT, panhypopituitarism, thyroid disease, colon polyps and gall stones. In history, all medications recently used by patients were meticulously determined.
Patients with ailments such as chronic liver disease, chronic kidney disease, hyperthyroidism, primary hypothyroidism, congenital heart disease, coronary artery disease, congestive heart failure, atrial fibrillation, Mobitz type 2 block, third degree atrioventricular block, left and right bundle branch block, sick sinus syndrome, ventricular pre-exitation and those with a permanent pacemaker were excluded out of the study.
Of 41 patients, 40 and only one had macroadenoma and microadenoma, respectively. Except for 2 patients exposed to no surgery, 39 had undergone transspenhoidal surgery, and 24 were on the use of somatostatin analogue
(SSA). Fourteen patients were using dopamin agonist in combination with SSA. Five patients were exposed to gama knife therapy.
Serum GH and IGF-1 results of patients with acromegaly were recorded during the diagnosis (baseline) and after the follow-up (post follow-up). These parameters were measured once for each individual in the control group.
Electrocardiographic Measurements
ECGs of patients with acromegaly were evaluated as baseline and post follow-up; however, ECGs of controls were obtained once for each individual. All ECGs were with 12-derivation and obtained after 10-minute rest. ECGs were assessed by a blind cardiologist. QT interval was measured by calculating the distance from the beginning of QRS complex to the end of T wave. In the presence of U wave, QT interval was calculated by taking the distance from the beginning of QRS complex to the nadir of the wave between T and U waves. On each derivation, at least three QT intervals were calculated. QT dispersion was defined as the difference between QT max and QT min. Each QT interval was corrected according to the heart rate by using Bazett’s Formula (QTc = QT/√RR sec) and defined as QTc. QTc dispersion was defined as the difference between QTc max and QTc min.
Laboratory Examination
Serum GH and IGF-1 levels were determined by using chemiluminescence enzyme immunoassay commercial kits (Immulite 2000, Diagnostic Products Corporation, Los Angeles, CA, USA). Reference range for GH was 0-5 ng/ mL, and age specific reference ranges for IGF-1 were as follows; 116-358 ng/mL for ages between 21-25 years, 117-329 ng/mL for ages between 26-30 years, 115-307 ng/ mL for ages between 31-35 years, 109-284 ng/mL for ages between 36-40 years, 101-267 ng/mL for ages between 41-45 years, 94-252 ng/mL for ages between 46-50 years, 87-238 ng/mL for ages between 51-55 years, 81-225 ng/mL for ages between 56-60 years, 75-212 ng/mL for ages between 61-65 years, 69-200 ng/mL for ages between 66- 70 years and 64-188 ng/mL for ages between 71-75 years.
Statistical Analysis
All data were analyzed by SPSS 15.0 (SPSS Inc., Chicago, Il.,USA) package programme. Arythmetic mean ± standart deviation was used for descriptive statistics of the continous data. Frequency tables were made for qualitative data. Whether or not the data were compatible with normal distribution was defined using Kolmogorov-Smirnov test before the determination of the most appropriate statistical test for intergroup comparison. The association between qualitative parameters was investigated using chi-square test. Independent samples t test was used to investigate the difference between both groups in terms of continuous data. Baseline and post follow-up parameters of patients were compared with each other by using paired samples t test. Correlation of parameters was designated with Pearson’s
ARTIGO ORIGINAL
correlation coefficient. p < 0.05 was accepted as statistically significant.
RESULTS
Laboratory results and ECGs of patients at baseline and post follow-up were compared with those of controls. Demographic features of both groups were similar to each other in terms of age, sex, body mass index (BMI), and the frequencies of DM and HT (Table 1). A significant decrease was present at the levels of GH and IGF-1 in patients with acromegaly during post follow-up period, compared to the baseline (17.55 ± 30.87 ng/mL vs 1.42 ± 1.66 ng/mL,
p = 0.005; 963.66 ± 458.69 ng/mL vs 363.50 ± 347.06 ng/mL, p < 0.001, respectively).
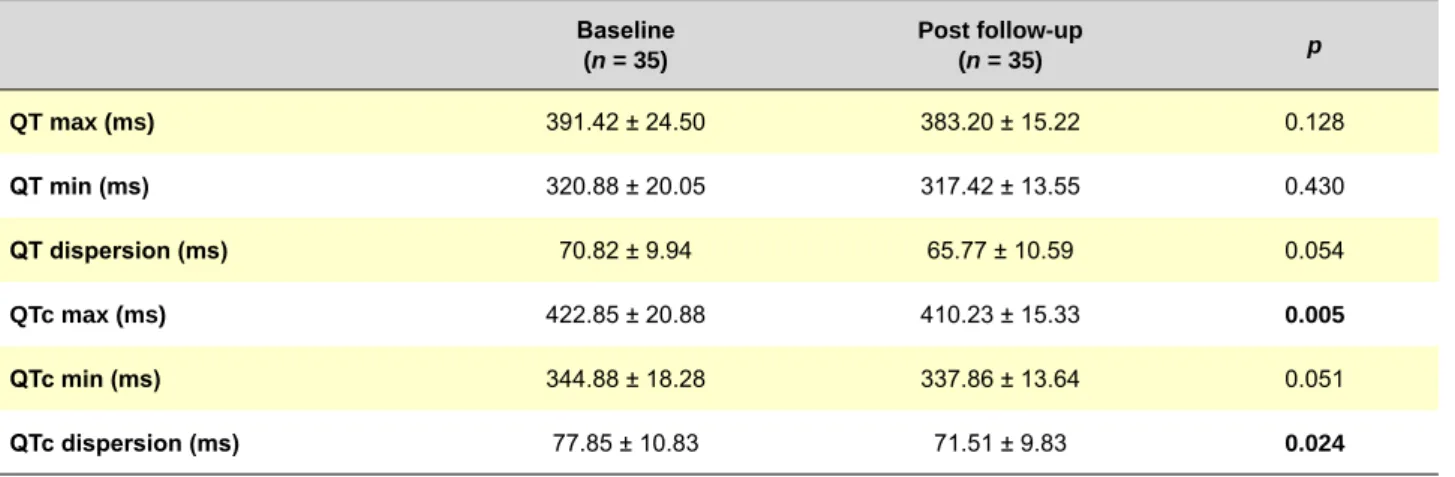
Baseline values of patients for QT max, QT dispersion, QTc max and QTc dispersion were significantly longer, compared with those of controls (p = 0.016, p = 0.001, p = 0.001 and p = 0.002, respectively), and no difference was detected between both groups in terms of QT min and QTc min (Table 2). Post follow-up QTc max and QTc dispersion
were detected to be significantly shorter, compared to baseline values (p = 0.005 and p = 0.024, respectively), and no significant difference was determined between baseline and post follow-up values of QT max, QT min, QT dispersion and QTc min (Table 3). No significant difference was present between patients’ post follow-up values of QT and those of controls (Table 4). Additionally, no significant difference was observed between QT values of patients both in (n = 20) and out (n = 15) of remission (p > 0.05 for all parameters).
The association of QT intervals with GH and IGF-1 was evaluated in each group. Except for the correlation of GH with QTc dispersion in patients’ post follow-up values (r = -0.438, p = 0.011), no other relationship was found between GH, IGF-1 and other QT parameters (p > 0.05 for all parameters). No association was found between QT intervals, and age and BMI rates of all participants (p > 0.05 for all parameters), and a significant positive correlation was detected between disease duration and QTc dispersion in patients with acromegaly (r = 0.440, p = 0.009).
Table 1 - Demographic and laboratory data of both groups
Acromegaly (n = 41) Controls(n = 41) p Age (years) 43.66 ± 11.50 42.46 ± 11.42 0.638 Sex (women/men) 22 / 19 28 / 13 0.258* BMI (kg/m²) 30.99 ± 7.13 29.61 ± 3.99 0.366 SBP (mmHg) 121.30 ± 20.06 113.18 ± 20.79 0.189 DBP (mmHg) 76.69 ± 13.91 71.81 ± 12.20 0.086 HR 79.52 ± 9.22 75.53 ± 12.97 0.169 DM 11 10 1.000* HT 11 7 0.187* GH (ng/mL) 17.55 ± 30.87 0.57 ± 0.93 0.001 IGF-1 (ng/mL) 963.66 ± 458.69 159.35 ± 61.45 < 0.001
BMI: body mass index, SBP: systolic blood pressure, DBP: diastolic blood pressure, HR: heart rate, DM: diabetes mellitus, HT: hypertension, GH: growth hormone, IGF-1: insulin like growth factor-1, * = χ²
Table 2 - Comparison of baseline QT intervals of patients with controls
Acromegaly & baseline
(n = 41) Controls(n = 41) p QT max (ms) 387.73 ± 25.30 373.73 ± 26.33 0.016 QT min (ms) 317.88 ± 22.55 312.46 ± 23.09 0.286 QT dispersion (ms) 70.10 ± 10.51 61.76 ± 12.18 0.001 QTc max (ms) 422.76 ± 20.82 408.27 ± 17.08 0.001 QTc min (ms) 345.59 ± 17.36 339.51 ± 13.34 0.080 QTc dispersion (ms) 77.07 ± 12.34 68.02 ± 13.13 0.002
ARTIGO ORIGINAL
DISCUSSION
Acromegaly is related to increased mortality due to adverse cardiovascular and cerebrovascular events, and the culprit for higher mortality is cardiovascular diseases in 60% of untreated patients.4 The prevalances of DM, HT
and hyperlipidemia, contributors of cardiac abnormalities, are also higher in patients with acromegaly, compared to normal population.5 However, acromegalic cardiomyopathy
is specific and related to neither the presence of DM nor that of HT. The condition is caused and characterized by chronic excess of GH and IGF-1 leading to interstitial fibrosis and myocardial hypertrophy.6
QT intervals and QT dispersion specifically reflect the duration of ventricular repolarization and homogenicity. Ventricular repolarization is an important period for the development of ventricular arrhythmias.7-9 Pathological
conditions altering ventricular repolarization periods would cause significant morbidity and mortality because of increased arrhythmia prevelance.10,11 QT intervals,
especially QTc, are presumed as the markers of increased cardiovascular risk and provide important prognostic information in clinical practice.12 Clinical and experimental
data demostrate that a high QT dispersion is associated with severe ventricular arrhytmia and sudden cardiac death. QT dispersion is considered to be beneficial in the prediction and evaluation of ventricular arrhytmia.13
Malignant ventricular tachyarrhytmia might account for some instances of recurrent syncope and sudden cardiac death in patients with acromegaly.14 Additionally,
cardiac autonomic functions are also reported to be impaired in patients with acromegaly.15 The determination
of clinical predictors of cardiac arrhythmias is important in patients with acromegaly. In literature, the number of studies showing lengthened QT intervals in patients with acromegaly is uncommon.16-19 As consistent with previous
ones, it was demostrated in our study that baseline QT max, QT dispersion, QTc max and QTc dispersion were longer, compared to controls. Lengthening of QT intervals in patients with acromegaly can be explained by the direct effects of GH and IGF-1 on myocardium or left ventricular hypertrophy due to DM, HT and similar disorders. So, the control group in our study was formed from individuals with similar comorbidities (DM, HT) to the patients with acromegaly in order to exclude the effects of such conditions on QT intervals. The results of thyroid fuction test were within normal limits in both groups.
Myocardial interstitial fibrous tissue proliferation due to GH and IGF-1 excess is thought to be the most important factor in arrhythmia in patients with acromegaly.17
Pathological ECGs even in patients with remission might point out irreversible fibrotic process and permanent arrhythmogenic pathways.20 In a study by Maffei et al, late
Table 3 - Comparison of baseline and post follow-up QT intervals of patients
Baseline (n = 35) Post follow-up (n = 35) p QT max (ms) 391.42 ± 24.50 383.20 ± 15.22 0.128 QT min (ms) 320.88 ± 20.05 317.42 ± 13.55 0.430 QT dispersion (ms) 70.82 ± 9.94 65.77 ± 10.59 0.054 QTc max (ms) 422.85 ± 20.88 410.23 ± 15.33 0.005 QTc min (ms) 344.88 ± 18.28 337.86 ± 13.64 0.051 QTc dispersion (ms) 77.85 ± 10.83 71.51 ± 9.83 0.024
QT max: QT maximum, QT min: QT minimum, QTc: corrected QT
Table 4 - Comparison of post follow-up QT intervals of patients with controls
Acromegaly & post follow-up
(n = 35) Controls (n = 41) p QT max (ms) 383.20 ± 15.22 373.73 ± 26.33 0.055 QT min (ms) 317.42 ± 13.55 312.46 ± 23.09 0.249 QT dispersion (ms) 65.77 ± 10.59 61.76 ± 12.18 0.133 QTc max (ms) 410.23 ± 15.33 408.27 ± 17.08 0.603 QTc min (ms) 337.86 ± 13.64 339.51 ± 13.34 0.595 QTc dispersion (ms) 71.51 ± 9.83 68.02 ± 13.13 0.200 QT max: QT maximum, QT min: QT minimum, QTc: corrected QT
ARTIGO ORIGINAL potentials were reported not to be related with GH and IGF-1 levels, and they supposed that GH and IGF-1 play no role in
arrhytmic process.20 Fatti et al also detected no correlation
between GH and IGF-1 levels, and pre- and post-treatment QTc intervals.17 As consistent with Fatti et al, Unubol et
al observed no correlation between GH and IGF-1, and QTc dispersion.18 In our study, a correlation was detected
only between GH and post-treatment QTc dispersion. No correlation, however, was detected between IGF-1 and QT intervals.
Surgery, medical therapy and radiotherapy are used in order to decrease the size of the adenoma and to control the hormonal excess in patients with acromegaly.21
Supression of GH and IGF-1 would improve acromegalic cardiomyopathy. Fatti et al detected statistically significant improvement in heart rate and QTc after primary therapy with SSA and found post-treatment QTc was similar to controls. They assumed that SSA had effects on QT intervals independent of left ventricular mass, because QTc became decreased although no significant change was present in left ventricule volumes after the treatment with SSA.17 In our
study, surgery was chosen as a first-line therapeutic option, and following SSA and dopamin agonists, radiotherapy was considered the second choice in case of unsuccesful surgery in order to maintain hormonal control. In our study, QTc dispersion and QTc max were detected to be shortened after the treatment and to become similar to controls. Now that treatment modalities more than one were used to
maintain hormonal control, we consider that the shortening observed in QT intervals (i.e. QTc dispersion and QTc max) may be associated with controlling acromegaly.
As the disease duration lengthens in acromegaly, the incidence of ventricular arrhythmia also increases.5,22
However, Fatti et al showed no correlation between the disease duration and QTc, as different from Maffei et al.17,20
Likewise, Unubol et al observed no association between the disease duration and QTc dispersion.18 In our study,
a significant correlation was found between the disease duration and QTc dispersion, and the correlation might reflect an increased risk of arrhythmia over time.
CONCLUSIONS
Our study is one of the rare studies where QT intervals were investigated in patients with acromegaly. As a result of our study, we consider that lengthening of QT intervals may be witnessed in patients with acromegaly, and such a condition may return to normal after obtaining hormonal control and be beneficial in the evaluation of cardiovascular risk.
CONFLICTS OF INTEREST
The authors declare that there are no conflicts of interest.
FUNDING SOURCES
No subsidies or grants contributed to this work.
REFERENCES
1. Kahaly G, Olshausen KV, Mohr-Kahaly S, Erbel R, Boor S, Beyer J, et al. Arrhythmia profile in acromegaly. Eur Heart J. 1992;13:51-6. 2. Rossing P, Breum L, Major-Pedersen A, Sato A, Winding H, Pietersen
A, et al. Prolonged QTc interval predicts mortality in patients with Type 1 diabetes mellitus. Diabet Med. 2001;18:199-205.
3. Atak R, Turhan H, Sezgin AT, Yetkin O, Senen K, Ileri M, et al. Effects of slow coronary artery flow on QT interval duration and dispersion. Ann Noninvasive Electrocardiol. 2003;8:107-11.
4. Saccà L, Cittadini A, Fazio S. Growth hormone and the heart. Endocr Rev. 1994;15:555-73.
5. Colao A, Ferone D, Marzullo P, Lombardi G. Systemic complications of acromegaly: Epidemiology, pathogenesis and management. Endocr Rev. 2004;25:102-52.
6. Fazio S, Cittadini A, Cuocolo A, Merola B, Sabatini D, Colao A, et al. Impaired cardiac performance is a distinct feature of uncomplicated acromegaly. J Clin Endocrinol Metab. 1994;79:441-6.
7. Batchvarov V, Malik M. Measurement and interpretation of QT dispersion. Prog Cardiovasc Dis. 2000;42:325-44.
8. Haverkamp W, Breithardt G, Camm AJ, Janse MJ, Rosen MR, Antzelevitch C, et al. The potential for QT prolongation and proarrhythmia by non-antiarrhythmic drugs: clinical and regulatory implications. Report on a policy conference of the European Society of Cardiology. Eur Heart J. 2000;21:1216-31.
9. Malik M. QT dispersion: time for an obituary? Eur Heart J. 2000;21:955-7.
10. Lauer MS, Martino D, Ishwaran H, Blackstone EH. Quantitative measures of electrocardiographic left ventricular mass, conduction, and repolarization, and long-term survival after coronary artery bypass grafting. Circulation. 2007;116:888-93.
11. Piccirillo G, Magri D, Matera S, Magnanti M, Torrini A, Pasquazzi E, et al. QT variability strongly predicts sudden cardiac death in asymptomatic subjects with mild or moderate left ventricular systolic dysfunction: a prospective study. Eur Heart J. 2007;28:1344-50.
12. Dekker JM, Schouten EG, Klootwijk P, Pool J, Kromhout D. Association
between QT interval and coronary heart disease in middle-aged and elderly men. The Zutphen Study. Circulation. 1994;90:779-85. 13. Day CP, McComb JM, Campbell RW. QT dispersion: an indication
of arrhythmia risk in patients with long QT intervals. Br Heart J. 1990;63:342-4.
14. Arias MA, Pachón M, Rodríguez-Padial L. Ventricular tachycardia in acromegaly. Rev Port Cardiol. 2011;30:223-6.
15. Dural M, Kabakci G, Cinar N, Erbaş T, Canpolat U, Gürses KM, et al. Assessment of cardiac autonomic functions by heart rate recovery, heart rate variability and QT dynamicity parameters in patients with acromegaly. Pituitary. 2014;17:163-70.
16. Mohamed AL, Yusoff K, Muttalif AR, Khalid BA. Markers of ventricular tachyarrythmias in patients with acromegaly. Med J Malaysia. 1999;54:338-45.
17. Fatti LM, Scacchi M, Lavezzi E, Pecori Giraldi F, De Martin M, Toja P, et al. Effects of treatment with somatostatin analogues on QT interval duration in acromegalic patients. Clin Endocrinol. 2006;65:626-30. 18. Unubol M, Eryilmaz U, Guney E, Ture M, Akgullu C. QT dispersion in
patients with acromegaly. Endocrine. 2013;43:419-23.
19. Ciulla M, Arosio M, Barelli MV, Paliotti R, Porretti S, Valentini P, et al. Blood pressure-independent cardiac hypertrophy in acromegalic patients. J Hypertens. 1999;17:1965-9.
20. Maffei P, Martini C, Milanesi A, Corfini A, Mioni R, de Carlo E, et al. Late potentials and ventricular arrhythmias in acromegaly. Int J Cardiol. 2005;104:197-203.
21. Melmed S, Colao A, Barkan A, Molitch M, Grossman AB, Kleinberg D, et al. Acromegaly Consensus Group. Guidelines for acromegaly management: an update. J Clin Endocrinol Metab. 2009;94:1509-17. 22. Lombardi G, Colao A, Marzullo P, Biondi B, Palmieri E, Fazio S.
Multicenter Italian Study Group on Lanreotide: Improvement of left ventricular hypertrophy and arrhythmias after lanreotide-induced growth hormone and insulin-like growth factor-I decrease in acromegaly: a prospective multicenter study. J Endocrinol Invest. 2002;25:971-6.