Hexagonal hierarchical cartogram:
Towards a thematic map of Brazil
Moises Colares Barreto, Claudio Esperança e Doris Kosminsky
thematic maps, cartograms, hexagonal hierarchical cartogram, Brazil
The popularity and availability of digital tools has boosted the use of thematic maps in infographics and data visualizations. Unlike general purpose maps, thematic maps are aimed at communicating the spatial distribution of a particular topic or theme, such as population density, voter preference or income. Since thematic maps have been more often studied and tailored for European and North American countries, some of them need adjustment to properly represent Brazilian states, according to their needs. The aim of this paper is to present the hexagonal hierarchical cartogram, which represents Brazilian states in a normalized geographical format using single-hue color scales to show magnitude. As a demonstration of its use, several maps are presented showing average grades obtained by students of all Brazilian states in a national high school exam called ENEM (Exame Nacional do Ensino Médio).
1 Introduction
Maps are abstractions of a three-dimensional world depicted on the bidimensional surface of a sheet of paper or a video screen. As such, they are not intended to be seen as reality, but as representations or projections of points or regions of the globe onto a plane. Although most maps claim to offer an accurate, even objective picture of the world, each one is constructed based on arbitrary conventions that meet the needs and desires of their creators. Take for example the Mercator projection, that renders Greenland as large as South America, when in fact it is only about one-eighth as large (Monmonier, 1996, p. 279-280). With this example in mind, it’s easy to understand that maps can be
tailored to serve a specific need or desire.
There are many types of thematic maps, including choropleth maps, cartograms, proportional symbol maps and dot maps, among the most used ones. All types present advantages and shortcomings depending on the region to be covered. Most of them, when applied to the Brazilian territory will present limitations and distortions. A thematic map for Brazilian states, in particular, presents interesting challenges, since the states are strongly diverse in area, economic
development and population density. For instance, a choropleth map where geographical areas are portrayed realistically might wrongly equate the visual importance of a state with its population size or economic significance. Similarly, cartograms using deformation may lead to the visual disappearance of small areas, proportional symbol maps may generate overlapping symbols over small regions, and dot maps can make it impossible to compute actual figures or still give a false impression of emptiness. Furthermore, map deformation can impair comparison between maps that show different themes for the same region.
Considering that most thematic maps have been created and researched more often in European and North American countries, it is reasonable to assume that these types of maps have been designed according to requirements and needs of these countries. Although this hypothesis could be investigated by, say, conducting a large survey of examples from many years, a more practical approach was chosen, namely, designing a thematic map of Brazil suitable to present data pertaining to Brazilian states. Thus, this study will be an attempt to analyze the special needs for a thematic map of Brazil by state in face of its geographic peculiarities.
The paper is organized as follows: Section 2 presents a
background on maps and analyzes the pros and cons of the most used thematic maps. Section 3 presents Brazil’s geography and establishes the requirements to a new thematic map using ENEM data. Section 4 describes the steps undertaken on designing a thematic map for Brazil and, finally, Section 5 presents some concluding remarks.
2 Background
Thematic mapping refers to maps that indicate the variation of one or several statistical attributes across space (Elmer, 2012, p. 1) and is now a familiar means of visualizing information based on area or location. Thematic maps are meant not simply to show locations, as in general purpose maps, but rather to show attributes or statistics about places, spatial patterns of those attributes, and relationships between places. Common themes used in thematic maps are population density, income and votes by region or country.
There are many types of thematic maps serving different purposes. Dot maps, proportional symbol maps, choropleth maps and cartograms are between the most used ones. These are briefly described below, together with a summary of their advantages and downsides.
Dot maps use dots of same size to represent a unit or a fixed value over a map (Figure 1). For example, in a map of density population, each dot can represent 5000 inhabitants or any other amount. Besides the number of records, dot maps present the location
between regions by considering the concentration of dots. They are, however, time consuming, especially when constructed manually. Also, large numbers of dots cause overcrowding and are difficult to count, making it impossible to calculate actual figures. It’s hard to compare values on two areas that have the same proportion of dots. When the minimal amount is less than the value of one dot, they can give a false impression of emptiness.
Figure 1 Example of a dot map. Population Density of Illinois, 2010. Retrieved from https://commons.wikimedia.org/wiki/ File:Population_Density_of_Illinois_2010_Wikipediamap.svg,
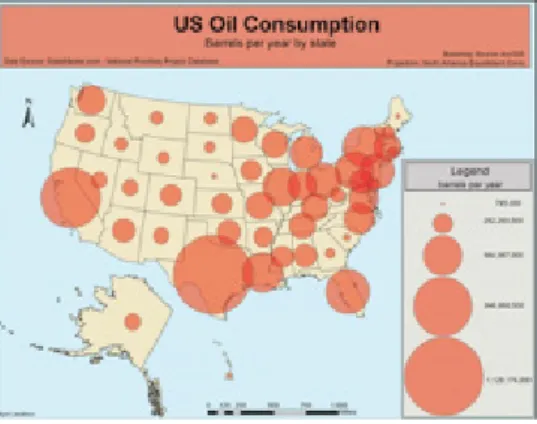
Figure 2 Example of a proportional symbol map. US Oil Consumption. Retrieved from Leistiar / Ty. https://www.flickr.com/ photos/89769525@N08/8242929652/
The proportional symbol maps, also known as graduated symbol maps, use symbols of different sizes to represent data (Figure 2). The size of the symbol reflect its magnitude. Circles or squares, sometimes transparent, are placed directly on the map and allow comparison quite well. This type of map preserves the geographical shape of the areas, but can lead to problems in small regions in the map. In this case, symbols may overlap, hindering the linkage with their corresponding area and generating visual clutter.
A choropleth map presents geographical areas shaded or
patterned in proportion to the measurement of the displayed statistical variable, such as per-capita income or voting districts. Frequently, a color gradation scheme is used, where low values appear lightly shaded and high values are denoted with darker shades. Choropleth maps are indicated for regions of near-uniform size and shape, and also for data that is uniformly distributed (Speckmann and Verbeek, 2010). Although the states of United States of America present some area disparity, particularities may justify why this type of thematic map has been widely used. First of all, the shapes of the American states are fairly regular, making it easy to allow visual comparison of their areas (Figure 3). Although there are clear visual differences between the biggest states (Texas and California) and the five smallest ones, the remaining set (around 80% of the states) exhibit areas that look more or less similar. On the other hand, when this kind of layout is applied to, say, some variable related to population, then large areas will still be visually more important even if sparsely populated.
Figure 3 Choropleth map. U.S. Population by square mile by state (2000 census figures). Retrieved from https://commons.wikimedia.org/wiki/File:US_2000_census_population_density_map_by_state.svg
Figure 4 Example of a Dorling cartogram. Protovis. Retrieved from http://mbostock.github.io/
Cartograms, also known as value-by-area maps, are maps in which a mapping variable such as population or gross national product substitutes land area or distance. There are many different types of cartograms, like standard type, non-contiguous cartograms and circular or Dorling cartograms, among others. In the standard type, also called contiguous area cartograms, the topology is maintained, as the objects (countries or states) remain connected with each other. However, since the statistical attribute value is encoded as the area size, deformations can occur, i.e., significantly smaller or larger data values can affect the original region shape, rendering the map unrecognizable (Speckmann and Verbeek, 2010). As an example, notice the shapes of the African countries in the cartogram of organic food production (Figure 5). In the non-contiguous cartogram the topology (the connectivity between objects) is sacrificed in order to preserve its shape. Free to move away from their adjacent objects, the represented regions can grow or shrink in size and still maintain their shapes, but the downside is that shapes may overlap. In the Dorling or circular cartograms (Figure 4) each region is represented by a non-overlapping circle, which is scaled according to the data value. The circles distribution aims to resemble the original topology - their adjacencies and relative positions. Similarly, rectangular cartograms use rectangles to represent each region. As with the circular
cartograms, rectangles allow comparison with low cognitive effort, however these shapes impose limitations on the layout in order to avoid overlapping. They are also difficult to respect region adjacencies.
Figure 5 Contiguous area cartograms. Image from A World Map of Organic Agriculture. (PAULL, J. and HENNIG, B. 2011).. Retrieved from https://commons.wikimedia.org/wiki/ File:PaullHennig2016WorldMap.OAha.CC-BY-4.0.jpg
Colors can render a map very attractive, but their use to represent data is subject to some rules far beyond intuitive choices. In this
case, any encoding of geographical or statistical data must associate the three dimensions of color to the data that will be displayed, and this, in turn, depends on the color system being used. Among them, the Hue-Saturation-Lightness (HSL) system is widely used by designers. Moreover, there are perceptual constraints as red-green colorblindness affects approximately 8% of males. However, the major design consideration in the use of colors for mapping is whether the intent is to distinguish between categorical attributes or to encode ordered attributes (Munzner, 2014, p. 219). Following the taxonomy of data types, a colormap can be categorical or ordered. Colors used as categorical attributes should be based on hue that doesn’t have an implicit ordering attribute, but can establish distinction between the colors. Colors that encode ordered attributes should use luminance and/ or saturation to show magnitude. A colormap establishes a relationship between colors and attributes or data values. Colormaps can be either a continuous range of values, or segmented into discrete bins of color. Segmented colormaps are suitable for categorical data. For ordinal data, segmented colormaps emphasize its discrete nature, while continuous colormaps emphasize its ordered nature.
3 Requirements for a thematic map of Brazil
Brazil is a Federative Republic which gather 27 Federative Units: 26 states and one federal district for the country’s capital, Brasília. The units have extremely disparate areas. Amazonas is the biggest state with 1,570745.7 km2 while the Federal District (DF) has 5,822.1 km2
and Sergipe, the smallest state has 21,910.3 km2 (Figure 6). Brazil is geopolitically divided into five regions; each region is composed from three to nine states. Brazilian population is not distributed uniformly among the units and the GDP varies enormously from state to state.
Figure 6 Brazil’s map, with the biggest and smallest states highlighted
In order to evaluate the special needs for a thematic map of Brazil by state in face of its geographic peculiarities, this paper focuses on a case study that maps ENEM average grades by exam type to each Brazilian state. ENEM is the National Exam of Upper Secondary Education, organized by the Ministry of Education of Brazil. Originally introduced to assess the quality of secondary-level education, ENEM has been used as an admission test to the main federal universities and educational institutes. More than 8 millions students have enrolled for this exam in the last years, which aims at measuring competence in five areas, each with a respective exam: Languages, Writing, Human Sciences, Natural Sciences and Math. The average grade data for each exam is made available to the public in the form of spreadsheets organized by city and state.
Maps can simplify and regularize information (Tversky, 2000), leaving apart unimportant information that can reduce cognitive load (Barkowsky, 2000). A thematic map can help visualize ENEM average
grades by state eschewing differences in area or population. A data map allows many different levels of analysis, ranging from an overview, the contemplation of general overall patterns, to the small details (Tufte, 2007, p. 16). In designing a thematic map for the ENEM average grades by exam and by state, an initial requirement was established to allow comparison between the average grades of each of the five exams in order to identify patterns and correlations, without losing the overall situation of the country. Since such a comparison requires maps that maintain more or less the same shape, the use of cartograms can be ruled out for this purpose.
A second requirement was to preserve their country shape, which suggested a Choropleth map of Brazil as an appropriate subject of study. However, a geographically accurate map of Brazil’s political
division puts well-known problems in evidence. Small areas, like Sergipe (SE) and the Federal District (DF) are so small that, when compared through colors, are not clearly discernible. States like Amazonas and Pará, despite their low population density, would
be immediately overemphasized, regardless of the variable being
compared. This problem can be worsened if values are similar. To better compare values among Brazilian states that have hugely different sizes, a requirement was established: that states be rendered as uniformly in size as possible. Thus, avoiding the bias associated to the differences in area size is a central issue in this study and its third requirement. To this end, it was decided that each of the 26 states and the federal district be represented by shapes of constant area.
The fourth requirement was to use monochrome color palettes to represent the magnitude of the average grade of each discipline by state. Although many studies (Yau, Munzner) have emphasized the limits in
perception for comparing values with colors, it was observed that using a monochrome color palette for each school subject could personalize the subject maps. A color scale is not merely an aesthetic choice, but is a useful and intuitive tool to visualize magnitude. Moreover, colors can be used to represent ordered attributes, in this case, the different school subjects.
Finally, the fifth requirement was to preserve the neighborhood relationships between the states, facilitating the search for a
specific state.
4 Designing a thematic map for Brazil
Having decided to use fixed sized elements to represent the states, to preserve the neighborhood relations between them and also to retain the country’s shape, the first step consisted in choosing the best geometrical shape to employ. Hexagons were then considered (Figure 7), since they can be assembled together so as to resemble Brazil’s shape (Figure 8). Moreover, through their six edges and vertices the neighborhood relations would be preserved.
In trying to keep Brazil’s overall shape and the topological relationship among the units, some modifications were made in the positions of the hexagons (Figure 9). Nevertheless, some neighborhood relationships were broken, while some coastal states were moved inland. The neighbor states of Piauí (PI) and Maranhão (MA) were separated from each other, while the coastal states of Pernambuco (PE), Piauí (PI) and Bahia (BA) were moved inland.
Figure 7 : First layout of choropleth maps using hexagons
Figure 8 Figure 8: Brazil geographical map
Considering the problems resulting from the hexagonal construction of the map, other shapes were investigated. Since the only other regular polygons that tile the plane are squares and triangles, the use of squared was briefly considered, but immediately discarded, mainly because squares automatically distribute themselves along rows and columns which make infeasible the preservation of neighborhood relationships in such a irregularly shaped country as Brazil.
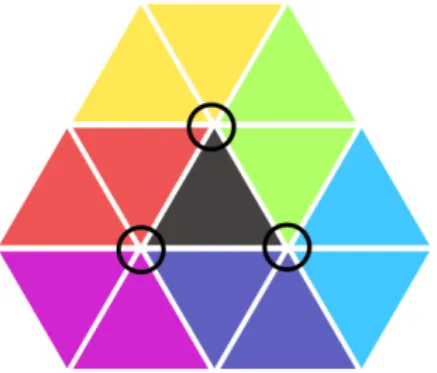
The triangular shape was considered next, once it was observed that each triangle is adjacent to three other triangles by edge and to six other triangles by vertex in a triangle tiling of the plane (Figure 11), which helps address the problem of separated neighbors.
Figure 10 Edge and vertex neighborhood relationships in hexagonal tilings of the plane
Figure 11 Edge and vertex neighborhood relationships in triangular tilings of the plane
Many different organizations were tried, some distributing the units by region (Figure 12) others trying to focus on the external
geographical map (Figure 13). Besides, the variation between the triangle positions, facing up or down, creates an additional problem as the set of triangles does not exhibit the regularity observed in the hexagonal design.
Figure 12 Layout of thematic map using triangles with units distributed by region
Figure 14 Layout of thematic map using triangles
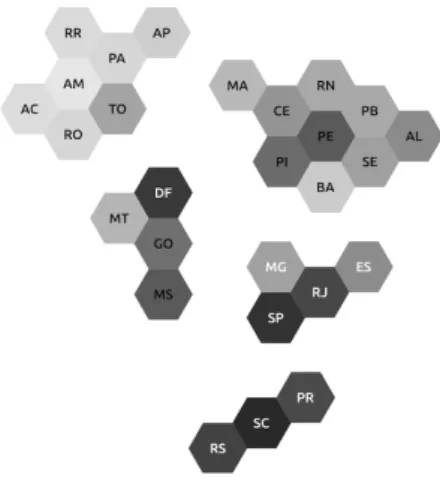
Hence, the use of triangles was discarded for use in a thematic map of Brazil, leaving hexagons as the most adequate choice. Another layout was attempted, where the units were redistributed
non-contiguously, grouping them by region and adding space between the units, aiming at the minimization of the topological problems observed (Figures 16 and 17). At first, the non-contiguous positioning of the units visually seemed to improve the design of the map, making it resemble the final shape of the country. The use of space between the units also minimizes the unpleasant sensation of having coastal units moved towards the interior of the country. However, as the distance between the hexagons increased, the shape of the country seemed to be lost.
Figure 16 Brazil thematic maps with non-contiguous hexagons organized by region.
Figure 17 Brazil thematic maps with non-contiguous hexagons organized by region.
After many attempts at trying to represent the federal units of Brazil with different regular polygons, it was observed that,
regardless of the shape used, the problem still laid in the preservation of the vicinity between the states. Thus, an algorithm was created to exhaustively test the possibilities of changing unit positions while keeping the topological vicinity. To this end, a graph was created, where vertices represent states, and edges represent vicinity relationships, i.e., if two states have a common border, then a graph edge is defined between the two corresponding vertices. A force-directed graph layout algorithm (Eades, 1984) was then coded, where the length of each edge could be continuously varied between the geographical distance between the states’ capitals and a fixed average value. In Figures 18 and 20, the graphs represent these two extremes, respectively, while in Figure 19 corresponds to a 50% interpolation. Vertex colors were assigned to represent the region each state
Figure 18 Graph of Brazilian states positioned according to the distance between states’ capitals.
Figure 19 Graph of Brazilian states positioned in a 50% interpolation between real and fixed value distance of state’s capitals.
One can notice that in the graph drawing on Figure 18, the
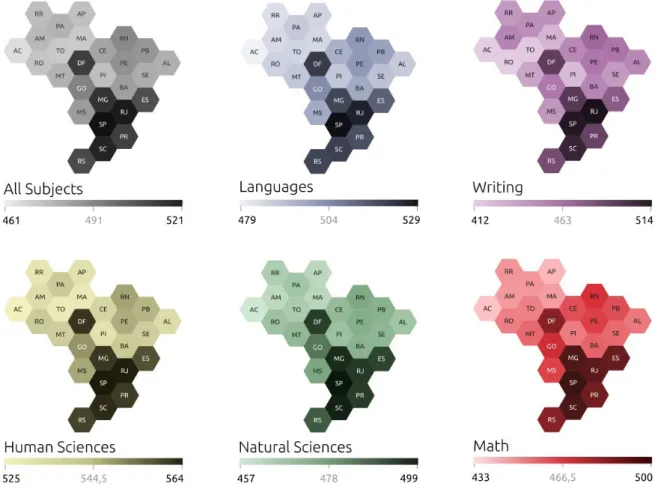
geographical shape of the country is roughly maintained. On the other hand, the drawing on Figure 20 shows each state at an almost uniform distance from its neighbors. The states that have similar area and not many frontier neighbors, like the states of the South region (in purple) suffer little, preserving their position in the country shape. However, many other problems became visible. The first problem is observed with regard to the Federal District. It rests inside the state of Goiás and has no other border neighbors resulting in a weird shape. The second problem is with the state of Bahia that has the opposite problem: it has many neighbors and thus it is pushed towards the center of the map. The last and worst problem observed is the deformation of the country shape. Thus, one may conclude that any organization of the units, which tries to respect both topological vicinity and use a uniform distance between units, will necessarily corrupt the overall shape of the country. For this reason, it was decided to preserve the country shape accepting the risk of moving some units to a non desirable position in the map. Also note that the use of labels minimizes problems in visually locating states, which have moved slightly with respect to their geographically optimal position. The different monochrome color palettes used allow comparisons between the average grades of subjects (Figure 21).
Figure 21 Resulting thematic maps of Brazil with monochrome scales representing average grade of ENEM by state.
5 Conclusion
Although thematic maps have been widely used to communicate the spatial distribution of a particular topic or theme, most of them have been more often studied and tailored for European and North American countries. In designing a cartogram that could properly
represent Brazilian states accordingly to their needs and differences, the present work proposes a normalized geographical format using hexagons to represent each unit and single-hue scale colors to show magnitude. This hexagonal hierarchical cartogram is showcased by mapping the average grades obtained by students of all Brazilian states in a national high school exam called ENEM (Exame Nacional do
The methodology employed in this work included the use of standard design methods like sketching and interchanging in the geometric shapes, but also resorted to a more technical investigation in the form of a program created to exhaust the layout possibilities for the Brazilian states neighborhood graph.
The final result achieved four of the five requirements established, namely: having the state’s area normalized, allowing comparison between average school grades by state, preserve the country shape and using monochrome color palettes to represent magnitude. After all the visual experiments undertaken it was realized that preserving the neighborhood relations between states (the fifth requirement) could only be fully obtained at the risk of losing the country’s shape. The use of labels minimizes problems in visually locating states which had been displaced from their geographically optimal position.
On the whole, this study confirms the importance in the developing of more studies in information design focused on the design of maps that consider regional needs.
References
BARKOWSKY, T., LATECKI, L. J., & RICHTER, K.-F. 2000. Schematizing maps: Simplification of geographic shape by discrete curve evolution. In C. Freksa, W. Brauer, C. Habel, & K. F. Wender (Eds.), Spatial Cognition II - Integrating
abstract theories, empirical studies, formal models, and practical applications, pp. 41-53. Berlin: Springer.
CLARKE, K., BORTINS, I. and DEMERS, S. Cartogram Types. The National Center for Geographic Information and Analysis. Retrived from: http://www.ncgia. ucsb.edu/projects/Cartogram_Central/types.html
EADES, P. 1984. A Heuristic for Graph Drawing, Congressus Numerantium, 42 (11): 149–160.
ELMER, C. 2012. Symbol Considerations for Bivariate Thematic Mapping. Thesis (Masters of Science) - Department of Geography - Cartography/GIS, University of Wisconsin - Madison, USA.
PAULL, J. and HENNIG, B. 2011. A World Map of Organic Agriculture. European Journal of Social Sciences 24 (3): 360-369.
MONMONIER, M. 1996. How to lie with maps. Chicago: University of Chicago Press.
MUNZNER, T. 2014. Visualization Analysis and Design. USA: A K Peters/CRC Press.
PARLAPIANO, Alicia. 2016, November 1. There are many ways to map election results. We’ve tried most of them. The New York Times. The Upshot. Retrieved from: https://nyti.ms/2k7Ce
Portal ENEM. (n.d.). Retrived April 10, 2017 from http://portal.inep.gov.br/web/ guest/enem.
SPECKMANN, B. and VERBEEK, K. 2010. Necklace Maps, IEEE Transactions on Visualization and Computer Graphics, 16, 881–889.
TUFTE, E. R. 2007. The visual display of quantitative information. Connecticut: Graphic Press LLC.
TVERSKY, B. 2000. Some Ways that Maps and Diagrams Communicate. Spatial
Cognition II. Springer Berlin Heidelberg, p. 72-79.
YAU, N. 2013. Data Points: Visualization That Means Something. Indianapolis: John Wiley & Sons, Inc.
About the authors
Moises Colares Barreto | Undergraduate: Iniciação Científica
[email protected] Comunicação Visual Design Escola de Belas Artes
Universidade Federal do Rio de Janeiro
Claudio Esperança | PhD
Programa de Engenharia de Sistemas e Computação
COPPE - Instituto Alberto Luiz Coimbra de Pós-Graduação e Pesquisa em Engenharia
Universidade Federal do Rio de Janeiro
Doris Kosminsky | DDES
[email protected] Escola de Belas Artes
Programa de Pós-graduação em Design
Programa de Pós-graduação em Artes Visuais - PPGAV Universidade Federal do Rio de Janeiro
http://labvis.eba.ufrj.br
Artigo recebido em 17/06/17 Artigo aceito em 27/06/18