EVALUATION OF VISUALIZATION FEATURES IN
THREE-DIMENSIONAL LOCATION-BASED MOBILE SERVICES
M´ario Freitas
1, A. Augusto Sousa
1,2, Ant´onio Coelho
1,2 1DEI / FEUP, Rua Dr. Roberto Frias, s/n 4200-465 Porto, Portugal2INESC Porto, Campus da FEUP, Rua Dr. Roberto Frias, s/n 4200-465 Porto, Portugal
[email protected], [email protected], [email protected]
Keywords: Computer graphics, visualisation paradigms, location-based mobile services, visual perception, navigation systems, mobile 3D city maps, user interaction.
Abstract: Nowadays, there is a wide range of commercial LBMS (Location-Based Mobile Services) available in the market, mainly in the form of GPS-based navigation solutions, and a trend towards the display of 3D maps can be clearly observed. Given the complete disparity of ideas and a visible commercial orientation in the industry, the study of the visualisation aspects that influence user performance and experience in the explo-ration of urban environments using 3D maps becomes an important issue. In this work, a generic conceptual framework is proposed whose main purpose is to objectively evaluate the impact and contribution of the major visualisation elements involved (henceforth mentioned asfeature vectors). With this framework in mind, an online questionnaire was developed and administered to 149 test subjects in order to measure the real impact of
feature vectors. The results clearly demonstrated that certain features have clear impact on user performance, and should be taken in account in LBMS development. As an example, just by displaying buildings with a 3D appearance, subjects were able to match more accurately the real environment with the one presented on a mobile device. In general, users were able to perform the tasks entrusted to them faster, if they were provided more realistic imagery.
1
INTRODUCTION
The LBMS technology, namely in the form of GPS-based navigation systems, has just recently reached a state of technological maturity, enabling the develop-ment of 3D map-based graphical interfaces. Nowa-days, there is a wide offer of LBMS solutions in the market, especially in the form of automotive navi-gation systems. Motivated by commercial interests, many of these products promise to offer the “best vi-sualisation experience ever”, in search for a differ-entiating factor from the competition. By looking at the variety of visualisation paradigms being proposed, one can clearly notice a great disparity of ideas with-out a clear notion of its usefulness.
Provided the non-existence of an objective state-of-the-art generalising theory capable of unifying and evaluating all the visualisation elements and proper-ties, the main motivation of this work is to study the most relevant of these features and how to adjust them
appropriately, in order to maximise the usability of mobile maps and to improve the navigation experi-ence, in accordance with the following objectives:
1. Elicit and assess the state-of-the-art contributions on visualisation paradigms of 3D maps, with par-ticular interest on mobile services and devices; 2. Develop a methodology for evaluating the
differ-ent issues that influence user experience and per-formance when exploring an urban environment with mobile maps.
2
STATE OF THE ART
2.1
Visual Perception of Realism
to reasonably realistic and immersive visualisation paradigms. However, there is a common misconcep-tion on what isImage Realism, how is it visually per-ceived, and how can it be effectively measured.
In (Rademacher et al., 2001), a scientific exper-iment was conducted to understand what aspects of an image can make it look “real” or “not real”, i.e., whether it is perceptually indistinguishable or not from the corresponding photographs. The results showed that subjects were not convinced by the in-creasing number of light sources and shadows nor the variety or number of shapes. The same could be said for “perfectly sharp” shadows or “perfectly polished” surfaces.
In (Lange and Ch, 2003), an experiment was car-ried out with 75 test subjects to classify 90 images of the virtual landscape of Brunnen / Schwyz (Switzer-land) from three different viewpoints in a degree of realism from 1 (very low) to 5 (very high). The results generally demonstrated that the variable that most contributed to the sense of realism was – by far – the high-resolution orthophotographic imagery, and the second most important being texture-mapping.
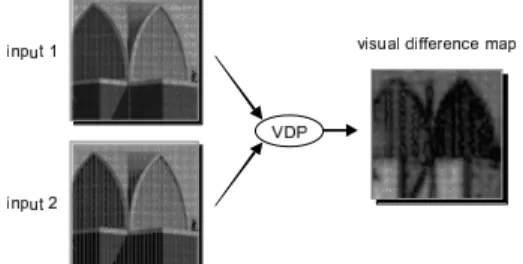
In other works like (McNamara et al., 2000), the importance of perception-based image quality metrics is studied, such as the ones given by the VDP (Visible Differences Predictor) and the VDM (Visual Discrim-ination Metric). These two metrics aim to analytically predict the differences between a computer-generated image and the photograph it depicts, taking into ac-count the limitations of the human eye described by the HVS (Human Visual System). The VDP quality metric takes the two images as input and generates a
difference mapthat predicts the probability of the hu-man eye finding differences between the two pictures, as demonstrated in (Bolin and Meyer, 1999) (see Fig-ure1).
Figure 1: Difference map in the VDP quality metric (ob-tained from the previously mentioned work).
A simplification of the VDM quality metric was provided by following a similar approach (Bolin and Meyer, 1999): instead of finding adifference map, a
just noticeable difference mapwas proposed which corresponds to a 75% probability of a person detect-ing a difference between the two images (McNamara et al., 2000).
Because of some controversy and no agreed-upon standards for measuring realism in computer-generated imagery, a conceptual framework for mea-suring image realism and evaluating its usefulness was proposed in (Ferwerda, 2003). The frame-work distinguishes three different varieties of real-ism: physical realism,photo-realismandfunctional realism. However, this framework does not seem to be enough to encompass the extents to which real-ity or virtualreal-ity can be “augmented”. Accounting for such circumstances, the concept ofVirtuality Contin-uumwas introduced in (Milgram and Kishino, 1994) as represented in Figure2.
Figure 2: The Virtuality Continuum (obtained from the pre-viously mentioned work).
At the left end, we have the “completely real”
Real Environment, which is made up of “real” objects: “any objects that have an actual objective existence”. At the right end, we have the “completely computer-simulated”Virtual Environment, which is made up of “virtual” objects: “objects that exist in essence or ef-fect, but not formally or actually”.
2.2
User tasks
The underlying basic equation that can help us find the “perfect” balance in map-based mobile services is what could be called ofMobility Equation. This equa-tion was first formulated by Leonard and Durrant-Whyte for mobile robot navigation (Borenstein et al., 1996) but can be equally extended to human naviga-tion. The equation is made up of the following three questions:
• ‘Where am I?’ • ‘Where am I going?’ • ‘How do I get there?’
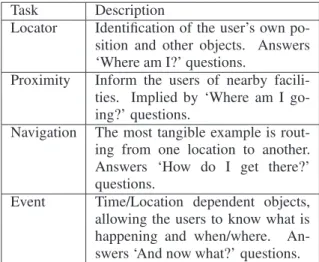
In (Hunolstein and Zipf, 2003), the tasks are clas-sified into 4 different groups of high-level user tasks that have a strong relationship with these questions, as described in table1.
2.3
Location-Based Mobile Services
Table 1: The primary tasks that 3D maps are used for.
Task Description
Locator Identification of the user’s own po-sition and other objects. Answers ‘Where am I?’ questions.
Proximity Inform the users of nearby facili-ties. Implied by ‘Where am I go-ing?’ questions.
Navigation The most tangible example is rout-ing from one location to another. Answers ‘How do I get there?’ questions.
Event Time/Location dependent objects, allowing the users to know what is happening and when/where. An-swers ‘And now what?’ questions.
road and pedestrian maps, as follows: TellMaris, m-LOMA, LAMP3D, TomTom, Navigon, NDrive, iGO, Google Earth, INSTAR, Virtual CableTMand Enkin.
3
CONCEPTUAL FRAMEWORK
In this section, a generic evaluation framework is pro-posed which can be used as the main methodology for the specification, development and evaluation of new or existing solutions in the visualisation problem do-main. This framework is proposed in order to simplify the evaluation process to the most relevant features, to the detriment of other classical analysis methods that can be used to obtain a more thorough evaluation. This framework defines the concept offeature vectors
comprisingorientationsandmagnitudes. The orien-tation defines the idea or concept the visualisation paradigm represents, andmagnitudethe degree/level to which the paradigm “amplifies” the vector. An ex-ample can be seen in Figure3to describe a possible feature vector for transportation. An orientation of this feature vector is the mode of transport, while pol-lution, cost and speed are magnitudes.
The framework is composed by six feature vectors as shown in Figure4and described below. These fea-ture vectors are not intended to characterise the com-plete set of visualisation features, but the most rele-vant ones observed from the current state of the art described in section2.3.
3.1
Image Realism
Image Realismis the feature vector that is concerned with how real, i.e., free from any idealisations or abstractions, is the image of the map presented to the user. Taken into account what was previously
Figure 3: A possible feature vector for “Transportation”.
Figure 4: Evaluation Framework through feature vectors.
mentioned on this matter (see Section2.1), the sug-gestedmagnitudesfor this vector will be based on the framework proposed in (Ferwerda, 2003) and the con-cepts onvirtuality continuumdefined in (Milgram and Kishino, 1994), with a few modifications. Firstly, a “relaxed” version ofphysical realismwill be adopted, i.e., it is assumed that current displays are consid-ered perfect in the sense that they can emit the ac-tual energy we want them to reproduce. Secondly, this framework will be incorporated into thevirtuality continuumas illustrated in Figure5, adapted from the above work.
Figure 5: An illustration of the proposed framework com-bining the Virtuality Continuum spectrum with varieties of image realism (adapted from the previously mentioned work).
Photo-Realismis located to the left ofFunctional Realism, not because it is considered “less virtual” thanFunctional Realismbut because it is closer to the
Physical Realism, and consequently providing a more “realistic” environment.
3.2
Object Labelling
Object Labellingencompasses the kind of visual tech-niques and strategies that are followed to label map elements such as rivers, streets, cities, and so on.
In (Been et al., 2006) and other studies, the impor-tance of two types of labelling, namelystatic labelling
anddynamic labelling, is discussed. This is relevant to distinguish since, depending on the case, we might be dealing with dynamic maps, i.e., maps that support continuous zoom (changing the scale) and continuous panning (usually by dragging the map). Based on the framework proposed in the previous study, the mag-nitudes for this vector will include the concepts of
Static/Dynamic Selection (visibility) andPlacement
(size, position and orientation) of labels.
One of the possible approaches when labelling ob-jects is to project the labels oriented towards the cur-rent perspective, analogous to a billboard in Computer Graphics. This approach is followed by all the con-tributions exceptGoogle Earthwhere labels are flat-tened and laid down on the maps surface.
Based on the works of (Wolff, 1999; van Dijk et al., 1999) and the previous discussion on adaptive-ness to the current perspective, the proposed orien-tationsforObject LabellingarePerspective-Adaptive
(oriented towards the current perspective),Point Posi-tioning(point symbols),Line Positioning(polygonal chains, such as rivers), Area Positioning(areal fea-tures such as countries), andGeneral Positioning(a combination of the three previous methods).
3.3
Visual-Spatial Abstraction
Visual-Spatial Abstractionmeasures the complexity of mental operations that are required to perform the visual matching of the real environment that can be observed and the one on the screen. This vector is specifically focused on the mental viewing transfor-mation that is required in order to have a perfect cor-respondence between both images: the reality and the screen. The proposedorientationsfor this vector are presented, regardless of the elevation angle of the “camera”, namelyGround Level(when it is only pos-sible to observe the current street and its junctions),
Local-Area Level(when streets that may not even be part of the route can be observed), and Wide-Area Level (when municipalities and an overview of the route are visible). The proposedmagnitudesreflect the adaptiveness of the camera to the users’ behaviour. We defineAdaptive LevelandAdaptive Orientation
when the camera adapts to the user’s movement (ac-cording to some variable like speed), and whether it adapts to his looking direction, respectively.
3.4
Route Indication
Route Indicationprovides a classification of the visual techniques and strategies for showing the itinerary path in the road maps, and the kind of manoeuvre in-dicators or way points that are presented in the dis-play. The proposedorientationsfor this vector, can be regarded as the visual indicators that are gener-ally used by the majority of the contributions to dis-play the route, namelyArrows,Cords,Way Pointsand
Carpet-like shapes to indicate the route. These in-dicators can be used with different “immersion” lev-els which are considered the proposedmagnitudesfor
Route Indication, namelyInstructive(when indicators are merely instructive) andSimulative(when they re-semble real world indicators).
3.5
Landmark Symbology
Landmark Symbologyevaluates the cartographic sym-bology that is used to portray the world using a pic-torial language, represented by “map symbols”, often accompanied by a legend. This vector is also related toImage Realism, in the way that both should be com-plementary, i.e., excessive realism may distract the users, but a great lack of symbology may completely blur their sense of orientation.
New concepts and design guidelines for the carto-graphic visualisation of landmarks in mobile maps are proposed in (Elias et al., 2005). Based on these con-cepts, theorientationsfor this vector will reflect the kind of buildings represented by symbols, specifically
Shops referenced by name(e.g., KFC, McDonalds),
Shops referenced by type (e.g., hotel, pharmacy),
Buildings with unique name / function(e.g., Tokyo Tower, Statue of Liberty), andBuildings with unique visual properties(e.g., “the large yellow house”). Ad-ditionally, the first proposedmagnitudefor this vec-tor will define in itself, the concept of levels of ab-stractions for landmarks, according to a scale (from the most abstract, to the most concrete):Words,Sign,
Icon,Sketch,Drawing, andImage, as defined in the previous study.
adapts to the current zoom level, and whether they change with the varying complexity of features.
3.6
Contextual Awareness
Contextual Awarenessmeasures the extent to which a visualisation paradigm is applied to get additional information on a contextual or situational basis.
It is important to distinguish the three groups of application areas in which virtual urban environments can be valuable, according to the spatio-temporal na-ture. These groups constitute the proposed orienta-tionsfor this vector, depending on whether they focus on the past, present or fiction, according to (Coelho, 2006):Reconstructional(reconstruction of urban en-vironments that were totally or partially lost), Recre-ational(urban design, urban planning, etc.), and Fic-tional(creation of imaginary realities).
Levels of awareness regarding the current loca-tion, time, and situation can vary from contribution to contribution. In (Burigat and Chittaro, 2005), it is claimed that a passive contextual-awareness approach is generally more flexible than an active approach. In the latter case, if the user is constantly presented with unwanted information it can become “too obtrusive”. Contrarily, in most automotive navigation systems, direction instructions or location-based information such as nearby points of interest are automatically presented, i.e., without the need of the user’s interven-tion. For these reasons, the proposedmagnitudesfor this vector will reflect the different autonomy levels of “contextual awareness” an application can demon-strate in different contexts and tasks, as previously denoted by (Chen and Kotz, 2000), specifically Ac-tive Awareness (without the need of user interven-tion), andPassive Awareness(when the user shows interest for getting context-based information).
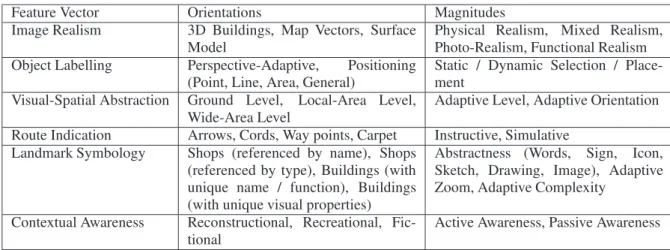
Table2summarises the evaluation framework, ac-cording to the proposedmagnitudesandorientations.
4
METHODOLOGY
An interactive online questionnaire was developed and several hypothesises were formulated, in order to assess the real impact of each visualisation feature described in the conceptual framework. Since avail-able free online questionnaires are generally limited to allow users to set their preferences, an interactive online questionnaire was developed specifically for this study, enabling the measuring of time for each answer and a more adequate visual aspect definition. However, due to the intrinsic limitations of the pro-posed questionnaire, and in order not to make it
per-ceived by potential participants as “too exhaustive”, only the features for which there are no significant indications from the state-of-the-art (regarding their impact and relevance) were evaluated with the ques-tionnaire. Moreover, there are some components that were not possible to evaluate, and therefore were not included in this study, given the limitations imposed by this kind of questionnaire.
The questionnaire was divided into 3 parts. In the first part, the exercises were mainly based on the
pointing task paradigm as previously performed in other studies (Nurminen, 2006). In the second part, a similar approach was followed, but instead of eval-uating the matching of the two realities, the main ob-jective was to measure how well users perform a given task (see Section 2.2). In the last part, users were asked about their preferences regarding the visualisa-tion of map elements such as landmarks.
4.1
Image Realism
All Image Realism orientations were tested along with the various degrees ofmagnitudes, in accordance with the vector instances (orientations and magni-tudescombined) found in the state-of-the-art contri-butions. These instances were considered eligible for the evaluation through the questionnaire, since there are few or no indications, with regards to their impact:
• Simple Textured Buildings and Photo Textured Buildings
• Coloured MapandOrthophotomap • Flat ModelandTerrain Model
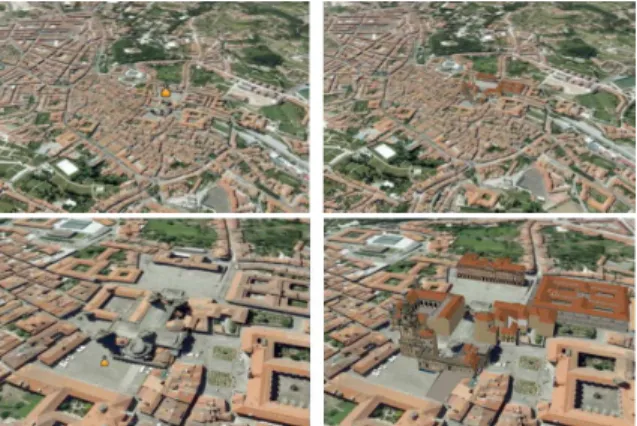
It was hypothesised that, in the absence of Sim-ple Textured Buildings, test subjects will have to rely on their ability to match the 3D geometry of the real building with the geometry of the 2D polygon repre-sentation on the map. At the same time, it is supposed that by providing the three-dimensional (yet simple) geometry of the whole building, in the presence of this component, test subjects will make fewer mis-takes and, as a consequence, will require less time matching both realities (see Figure6).
Figure 6: The 2 images supporting the questions that evalu-ate the impact of Simple Textured Buildings.
Table 2: Structure of the proposed evaluation framework.
Feature Vector Orientations Magnitudes Image Realism 3D Buildings, Map Vectors, Surface
Model
Physical Realism, Mixed Realism, Photo-Realism, Functional Realism Object Labelling Perspective-Adaptive, Positioning
(Point, Line, Area, General)
Static / Dynamic Selection / Place-ment
Visual-Spatial Abstraction Ground Level, Local-Area Level, Wide-Area Level
Adaptive Level, Adaptive Orientation
Route Indication Arrows, Cords, Way points, Carpet Instructive, Simulative Landmark Symbology Shops (referenced by name), Shops
(referenced by type), Buildings (with unique name / function), Buildings (with unique visual properties)
Abstractness (Words, Sign, Icon, Sketch, Drawing, Image), Adaptive Zoom, Adaptive Complexity
Contextual Awareness Reconstructional, Recreational, Fic-tional
Active Awareness, Passive Awareness
simultaneously providing the 3D geometry of a build-ing along with photographic fac¸ades, test subjects will be able to detect features (e.g. windows, doors, unique wall patterns, etc.) more accurately and faster than in the case ofSimple Textured Buildings.
Figure 7: The 2 images supporting the questions that evalu-ate the impact of Photo Textured Buildings.
RegardingMap Vectors, it is assumed that an Or-thophotomapcan provide subjects a much more en-riching visualisation experience than the one provided by aColoured Map(see Figure8). The hypothesis rests on the belief that anOrthophotomapcomponent can make easier for users to discern the true features of the map’s surface, by giving a realistic view rather than a rough generalisation. There are many situa-tions were coloured vector polygons are not enough to represent features like a tiled pavement; a group of trees arranged in a special and unique way; and sev-eral “static” features like public benches, zebra cross-ings, and many others that are impossible to find in a coloured vector map.
Figure 8: The 2 images supporting the questions that evalu-ate the impact of Coloured Map and Orthophotomap.
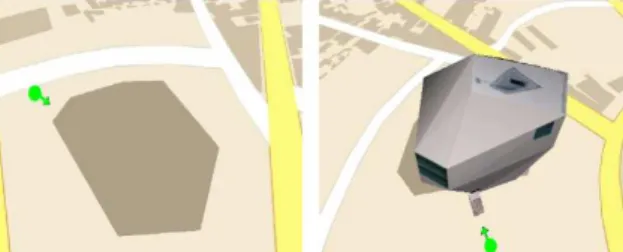
Regarding theSurface Model, it was hypothesised that by using aTerrain Modelrather than aFlat Model
component, users will be able to perform the spa-tial matching of both reality and virtuality in a much more immersive and natural way (see Figure9). It is expected that by providing theTerrain Model com-ponent, users will be able to use elevated reference points, and to understand and visualise occlusions caused by the varying landscape elevation.
Figure 9: The 2 images supporting the questions that evalu-ate the impact of Flat Model and Terrain Model.
In the end, it is expected that users will be able to perform their tasks in less time, since they just need to think “outside the box”. On the other hand, by using a
Flat Model, users would understand that the image on the screen does not account for occlusions, and there-fore, they would have to do that job themselves.
4.2
Object Labelling
With respect toObject Labelling, it was hypothesised that, when users are analysing labels (e.g. of streets, rivers, cities, and so on) which are not oriented to-wards the current viewing direction depicted in the device, they will feel much more difficulty reading the words, due to the decreased visibility, especially when looking in a direction which is parallel to the map’s surface (see Figure10).
Figure 10: The 2 tasks that evaluate the impact of Perspective-Adaptive Labelling (close-up).
it becomes easier to read. Particularly in the case of labels which are almost parallel to the camera’s view-ing direction, some users will wish to skip words, if they find them “too difficult” to read.
4.3
Route Indication
It was hypothesised that, when a user is presented with an image which looks more familiar to him, given the current context, the user will be able to per-form his task with lesser effort (see Figure11). It is assumed that users won’t make more mistakes using one approach or the other, but that a significant dif-ference in the time they require to complete their task may arise, i.e., that aSimulativecomponent will result in faster responsiveness than anInstructiveapproach.
Figure 11: 2 of the tasks that evaluate the impact of Instruc-tive and SimulaInstruc-tive route indications.
4.4
Landmark Symbology
For this feature vector, it was hypothesised that users will requireAdaptive Zoomfunctionality, i.e., that the majority of them will choose an abstract landmark representation of a given building, when a map which is zoomed out far from the ground is used, but a more concrete representation when at close range (see Fig-ure12).
The basis of such hypothesis rests on the various issues raised by the cartographic generalisation pro-cedures, as previously explained in Section3.5. For instance, even if a concrete landmark is used rather than an abstract representation, there are certain zoom levels of a map which do not allow users to perceive enough features of that landmark, in order to identify it with a significant confidence level.
Figure 12: The preferences that evaluates the users’ need for an Adaptive Zoom approach, when a map which is zoomed out far / zoomed in close to the ground is used.
5
RESULTS
In total, 149 test subjects answered the questionnaire, mostly from a student population in Computer Sci-ence and Informatics: 89% were male, and 78% were in the 18 to 25 age group. In general, prior to an-swering the questionnaire, subjects considered them-selves fairly capable of using both maps and GPS nav-igators, given the approximate 50-50 ratio shared be-tween “average” and “experienced” users. Only 3% of the participants reported they were unfamiliar with either maps or GPS navigators.
5.1
Image Realism
Regarding the impact of the presence and absence of
15s, s.d. 6.4s). This clearly demonstrates that the re-sults withPhoto Textured Buildingsare more stable, considering the increase in difficulty of the exercise.
In the presence of a Coloured Map, the num-ber of participants who were unable to answer the question was quite high (14%). The same happened with the number of wrong answers being quite differ-ent from theOrthophotomap(67% and 7%, respec-tively). Nevertheless, subjects had no apparent dif-ficulty in finding the correct answer, in the presence of theOrthophotomapcomponent, as 92% chose the correct answer in similar conditions (as shown in Fig-ure13). Besides being more effective, the Orthopho-tomapproved also to be more efficient, as subjects took an average time of 9.3s (s.d. 18.4s) to answer the question, considerably faster compared to the 23.5s (s.d. 16.8s) in the case of theColoured Map.
Figure 13: Answers in the presence of a Coloured Map and an equivalent Orthophotomap.
In terms of Surface Model, there was just a 5% difference in the number of correct answers between both cases, with advantage to the Terrain Model. However, theTerrain Modelwas much more efficient, as the average response time was 7.5s (s.d. 5s), com-pared to the 15.3s (s.d. 13.8s) obtained with theFlat Model.
These results point out that image realism can im-prove the task of matching the 3D map with reality, both maximising effectiveness (lesser mistakes) and effectiveness (lesser time).
5.2
Object Labelling
With respect toObject Labelling, when labels were oriented towards the camera, the subjects took lesser time to perform the task (avg. 11.8s, s.d. 5.2s) than when labels were not oriented according to the cam-era (avg. 15s, s.d. 6.4s), as shown in Figure14.
From these results a conclusion can be made that
Perspective-Adaptive Labellingcan increase readabil-ity of labels in 3D maps.
5.3
Route Indication
With respect to theRoute Indicationthere was no rel-evant difference in terms of answer correctness be-tweenInstructive orSimulative components.
How-Figure 14: Answer times in the presence and absence of Perspective-Adaptive Labelling component.
ever, in terms of efficiency, theSimulativecomponent resulted in faster response times (avg. 8.6s, s.d. 5.9s), against (avg. 11.8s, s.d. 7.9s) in the case of the In-structivecomponent.
Although both techniques can achieve similar lev-els of correctness, theSimulativeapproach can speed-up the task of matching reality with the 3D map. This can be of great importance when supporting activities that demand short response times, such as driving.
5.4
Landmark Symbology
A vast majority of participants (87%) answered they would more easily identify and recognise the presence of a given distant landmark, when an abstract repre-sentation of that landmark was used. Approximately 86% of them indicated their preference towards the use of concrete landmarks at close range.
Different zoom levels over 3D maps will encom-pass also different levels of visual complexity, and as such,Adaptive Zoomfunctionality is of great impor-tance for maximising readability.
6
CONCLUSIONS AND FUTURE
WORK
In this study, a genericEvaluation Framework was proposed as the main methodology for the specifica-tion, development and evaluation of new or existing solutions in the 3D map visualisation problem domain for LBMS.Feature Vectorscan individually describe a set of choices (orientations) and degrees of appli-cability (magnitudes). The proposed framework fo-cuses on 6 feature vectors namely, Image Realism,
analysing the totality of features that address visuali-sation aspects, in the context of exploration of urban environments, using 3D LBMS as guidance.
Although the state of the art contemplates some of the issues involved, the questionnaire gave a much more clear insight on them. In general, it is ob-served a greater tendency towards the need ofImage Realismrather than Image Functionalism. In terms ofPerspective-Adaptive Labelling, it was proved that users are at disadvantage, if they are given the task to read labels of a map, when these labels are not ori-ented towards the camera’s viewing direction. The results also demonstrated that users can more easily identify the presence of a distant landmark with an ab-stract representation, and a close landmark with a con-crete representation, which is indicative of the need of anAdaptive-Zoombehaviour.
Since there are several limitations on the kind of measurements that can be performed with the pro-posed questionnaire in order to evaluatefeature vec-tors, it would be interesting to perform other kinds of tests, with particular focus on dynamic experiments, to get more information about other vectors such as
Visual-Spatial AbstractionandContextual Awareness
which were not evaluated. An example of these exper-iments would include using a driving simulator to test the participants’ reflexes, given a situation where they are approaching a manoeuvre, and deciding which way to go.
From the results obtained from this work, and fu-ture lines of research, we expect the definition of new paradigms of visualisation for 3D map visualisation on LBMS that maximise usability and improve user experience and performance.
ACKNOWLEDGEMENTS
We would like to thankNDrive Navigation Systems, S.A.for the support provided for this research project.
REFERENCES
Been, K., Daiches, E., and Yap, C. (2006). Dynamic map la-beling.IEEE Transactions on Visualization and Com-puter Graphics, 12(5):773–780.
Bolin, M. R. and Meyer, G. W. (1999). A visual difference metric for realistic image synthesis. In Proc. SPIE, pages 106–120.
Borenstein, J., Everett, H. R., and Feng, L. (1996).”Where am I?” – Sensors and Methods for Mobile Robot Po-sitioning. The University of Michigan.
Burigat, S. and Chittaro, L. (2005). Location-aware visual-ization of vrml models in gps-based mobile guides. In John, N. W., Ressler, S., Chittaro, L., and Duce, D. A., editors,Web3D, pages 57–64. ACM.
Chen, G. and Kotz, D. (2000). A survey of context-aware mobile computing research. Technical Report TR2000-381, Dept. of Computer Science, Dartmouth College.
Coelho, A. (2006).Expeditious Modelling of Virtual Urban Environments based on Interoperability and Geospa-tial Awareness (in Portuguese). PhD thesis, Faculdade de Engenharia da Universidade do Porto.
Elias, B., Paelke, V., and Kuhnt, S. (2005). Concepts for the cartographic visualization of landmarks. In Proceed-ings of Symposium 2005 Location Based Services & TeleCartography, page 11.
Ferwerda, J. A. (2003). Three varieties of realism in com-puter graphics. InIn Proceedings SPIE Human Vision and Electronic Imaging ’03, pages 290–297. Hunolstein, S. V. and Zipf, A. (2003). Towards task oriented
map-based mobile guides. InWorkshop ”HCI in Mo-bile Guides” at MoMo-bile HCI 2003. 5th International Symp. on HCI with Mobile Devices and Services.
Lange, E. and Ch, Z. R. (2003). The degree of realism of GIS-based virtual landscapes: Implications for spa-tial planning. InD. Fritsch and R. Spiller (eds) Pho-togrammetric Week ’99, pages 367–374.
McNamara, A., Chalmers, A., and Trocianko, T. (2000). Visual perception in realistic image synthesis. In Co-quillart, S. and Duke, D., editors,STAR Proceedings of Eurographics 2000, Interlaken, Switzerland. Euro-graphics Association.
Milgram, P. and Kishino, F. (1994). A taxonomy of mixed reality visual displays. IEICE Transactions on Infor-mation Systems, E77-D(12):1321–1329.
Nurminen, A. (2006). The m-loma mobile 3d map project website. http://www.init.hut.fi/research %26projects/m-loma/. Last Checked: November, 2008.
Rademacher, P., Lengyel, J., Cutrell, E., and Whitted, T. (2001). Measuring the perception of visual realism in images. InProceedings of the 12th Eurographics Workshop on Rendering Techniques, pages 235–248, London, UK. Springer-Verlag.
van Dijk, S., van Kreveld, M., Strijk, T., and Wolff, A. (1999). Towards an evaluation of quality for label placement methods. In Proc. 19th Internat. Car-tographic Conf. (ICC’99), pages 905–913, Ottawa, Canada. Internat. Cartographic Association.