Accepted
Article
This article has been accepted for publication and undergone full peer review but has not
Article type : Original ArticleTemporal variation in brain transcriptome is associated with the
expression of female mimicry as a sequential male alternative
reproductive tactic in fish
Sara D. Cardoso,1,2,3 David Gonçalves,4 Alexander Goesmann,5# Adelino V.M. Canário,6 Rui F. Oliveira1,2,3*
1 Instituto Gulbenkian de Ciência, Rua da Quinta Grande 6, 2780-156 Oeiras, Portugal 2 ISPA - Instituto Universitário, Rua Jardim do Tabaco 34, 1149-041 Lisbon, Portugal
3 Champalimaud Neuroscience Programme, Champalimaud Centre for the Unknown, Avenida Brasília, 1400-038 Lisbon, Portugal
4 Institute of Science and Environment, University of Saint Joseph, Rua de Londres 16, Macau SAR, China
5 Center for Biotechnology, CeBiTec, Bielefeld University, 33501 Bielefeld, Germany
6 CCMAR – Centro de Ciências do Mar, Universidade do Algarve, Campus de Gambelas, 8005-139 Faro, Portugal
# Present address: Bioinformatics and Systems Biology, Justus-Liebig-University, 35392 Giessen, Germany
Keywords: Salaria pavo, alternative reproductive tactics, behavioural plasticity, neurogenomic state, sex-biased gene expression, RNA-seq
* Correspondence: Rui F. Oliveira, Fax: +351 21 440 79 70 E-mail: [email protected] (RFO)
Accepted
Article
Abstract
Distinct patterns of gene expression often underlie intra- and inter-sexual differences, and the study of this set of co-regulated genes is essential to understand the emergence of complex behavioural phenotypes. Here, we describe the development of a de novo transcriptome and brain gene expression profiles of wild-caught peacock blenny, Salaria pavo, an intertidal fish with sex-role reversal in courtship behaviour (i.e. females are the courting sex) and sequential alternative reproductive tactics in males (i.e. larger and older nest-holder males and smaller and younger sneaker males occur). Sneakers mimic both female’s courtship behaviour and nuptial colouration to get access to nests and sneak fertilizations, and later in life transition into nest-holder males. Thus, this species offers the unique opportunity to study how the regulation of gene expression can contribute to intersex phenotypes and to the sequential expression of male and female behavioural phenotypes by the same individual. We found that at the whole brain level, expression of the sneaker tactic was paralleled by broader and divergent gene expression when compared to either females or nest-holder males, which were more similar between themselves. When looking at sex-biased transcripts, sneaker males are intersex rather than being either nest-holder or female-like, and their transcriptome is simultaneously demasculinized for nest-holder-biased transcripts and feminized for female-biased transcripts. These results indicate that evolutionary changes in reproductive plasticity can be achieved through regulation of gene expression, and in particular by varying the magnitude of expression of sex-biased genes, throughout the lifetime of the same individual.
Introduction
Sexual dimorphisms in morphological and behavioural traits are ubiquitous in sexually reproducing organisms, and in most studied cases are paralleled by differential gene expression between the sexes for loci that are present in both males and females (Ellegren & Parsch 2007; Mank 2009, 2017). Thus, it has been hypothesized that sex biases in gene expression may play a central role in resolving sexual conflict and that sex-specific transcription regulatory mechanisms may be key in sexual selection (Pointer et al. 2013). This rationale can be extended to species with alternative
reproductive tactics (ARTs) where multiple phenotypes may occur within one of the sexes, typically males, with varying degrees of sexual dimorphism. In ARTs at least two sexually mature (i.e. with functional testes) male morphs occur: (1) bourgeois males that fully express male secondary sex characters and compete for the monopolization of access to mates (e.g. by defending breeding territories), expressing male-typical behaviour (e.g. aggression, courtship); (2) parasitic males (aka sneakers) that do not express male secondary sex characters and behaviour, and exploit the investment of bourgeois males to get access to mates (e.g. sneaking fertilizations) (Taborsky et al. 2008). Hence, species with ARTs offer the possibility to test the hypothesis that differential expression of sex-biased genes is also a major genetic mechanism for the evolution of intra-sexual variation in reproductive tactics by providing inter-individual variation in the expression of
behavioural and morphological sex-related traits. Moreover, in some species, female-mimicking sneaker males occur. These sneaker males are morphologically and behaviourally similar to females but have functional male gonads, and use their female resemblance to approach mating pairs in
Accepted
Article
order to try to get parasitic fertilizations (Taborsky 1994; Taborsky et al. 2008). Thus, these males have male and female traits expressed in the same phenotype. This raises the question of how regional differential regulation of gene expression may accommodate different sex phenotypes across different tissues and the role it may play in the evolution of ARTs. Interestingly in some cases, female-mimicking ARTs are expressed by the same individual at different life-history stages, which raises the additional hypothesis that temporal differential regulation of gene expression may allow for the evolution of sequential ARTs within the same individual.
In recent years, the possibility of analysing gene expression profiles without a reference genome (e.g. RNA-seq; (Wang et al. 2009)) allowed us to test the abovementioned hypotheses in non-model organisms (Zuk & Balenger 2014). For example, in two horned beetle species with ARTs
(Onthophagus taurus and O. nigriventris) gene expression in different tissues was as divergent between alternative male morphs as it was between sexes (Snell-Rood et al. 2011). However, in the bulb mite, Rhizoglyphus robini, the number of sex-biased genes in whole-body expression analysis was much higher than the number of genes differentially expressed between male morphs (Stuglik
et al. 2014). Within teleosts, the variability of reproductive systems is vast, and most studies have
focused on the characterization of whole-brain gene expression patterns associated with discrete reproductive phenotypes. In all studies, gene expression differences between members of the same species that differ in plasticity of mating tactics reflect how they differ in behaviour and life-history (Aubin-Horth et al. 2005; Fraser et al. 2014), and these differences are more pronounced among male tactics than between sexes (Schunter et al. 2014; Stiver et al. 2015; Partridge et al. 2016; Nugent et al. 2016).
In the present study, we investigate the role of gene expression in the expression of female-mimicking male ARTs in the peacock blenny Salaria pavo (Blenniidae; Fig. 1) a littoral fish where female-mimicking males occur (Gonçalves et al. 1996). In this species, nest-holder (bourgeois) males are larger than females, have well-developed secondary sexual characters (SSCs; viz. a head crest and a sex-pheromone producing anal gland), which are used to attract females to their nests for spawning (Gonçalves et al. 2002; Barata et al. 2008), and provide sole parental care to eggs until hatching (Fishelson 1963; Patzner et al. 1986). In a population where nest sites are scarce, and the operational sex ratio is female-biased, females become the courting sex (Almada et al. 1994; Saraiva
et al. 2009). Female courtship consists of the expression of a transient nuptial colouration and in
stereotypic movements directed towards nest-holder males (Almada et al. 1994). In this population, an alternative male mating tactic is also present, consisting of smaller and younger males behaving as female-mimics to get access to nests guarded by nest-holder males and sneak fertilizations (Gonçalves et al. 1996). Sneaker males switch to nest-holders at a later age (Fagundes et al. 2015), hence the same male expresses both male and female reproductive behaviour during his lifetime. Here, we specifically tested: (1) if differences in sexual dimorphism in reproductive behaviour between sneaker and nest-holder males are paralleled by gene expression differences in the brain; and (2) if the sneakers’ brain transcriptome is closer to that of nest-holder males, since both are sexually mature males and hence are expected to have masculinized brains, or to that of females, since both express female courtship and nuptial colouration. We have also studied males that are in transition from the sneaker to the nest-holder male phenotype. These transitional males are no longer reproductively active as sneakers (i.e. they no longer express female-mimicking behaviour typical of sneakers), but they also have not become nest-holders yet, since they lack the male secondary sex characters and do not defend a nest. Moreover, transitional males possess reduced
Accepted
Article
testes which may result from their investment in somatic growth to become nest-holders, since nest-holders reproductive success depends on body size (Oliveira et al. 1999). Thus, transitional males offer the opportunity to have an extra sampling point in the intrasex dimorphism continuum. Since this is the first study reporting whole transcriptome sequencing for this species, we have also provided a brief characterization of the peacock blenny’s transcriptome.
Material and Methods
Ethics statement
All procedures were performed in accordance with accepted veterinary practice under a “Group-1” license issued by the Direcção-Geral de Veterinária, Ministério da Agricultura, do Desenvolvimento Rural e das Pescas, Portugal (permit number 0421/000/000/2013).
Sample collection
Individuals were collected during the breeding season at Culatra Island (Ria Formosa Natural Park, 36°59′N, 7°51′W, Portugal; for a detailed description of the sampling area see (Almada et al. 1994)). During the breeding season, both females and sneaker males actively express courtship behaviour towards the nest-holder males, while nest-holder males defend nests and provide sole parental care to eggs (Almada et al. 1995; Gonçalves et al. 1996). The peacock blenny is an intertidal species, hence individuals were captured with hand nets during low tide; nest-holder males were collected from their nests, whereas females, sneaker males, and transitional males were collected from surrounding areas, where they seek shelter in small pools under tiles and other debris. Since sneaker males are female mimics, we used sperm release upon gentle abdominal pressure as an
identification criterion. Transitional males, which represent the shift from sneaker to nest-holder males, were identified by having poorly developed secondary sexual characters (SSCs) and a larger body size than sneakers, while not releasing sperm upon abdominal pressure. Fish were euthanized using a lethal dosage of the anaesthetic MS-222 (tricaine methanesulfonate; Sigma-Aldrich) followed by rapid severance of the spinal cord with a scalpel. Brain dissection occurred within 5 minutes after capture and brains were immediately immersed in RNAlater (Sigma-Aldrich), kept at 4ºC for 24h, and stored at –80ºC until further processing. Fish were then dissected to assess gonadal sex by direct inspection of the gonads.
Thirty-seven individuals (9 females, 9 nest-holder males, 9 sneaker males and 10 transitional males) were sampled for gene expression analysis, establishing two replicates of pools of 4 to 5 individuals for each phenotype. Among males, sneakers had the largest gonads relative to their body size (GSI), followed by nest-holders and then by transitional males (Welch’s one-way ANOVA, F2,11.0 = 47.708, p
< 0.001). This variation in GSI followed previously reported patterns (Gonçalves et al. 1996, 2008) confirming the reproductive state of examined male individuals (i.e. only nest-holder and sneaker males are sexually mature). All females used in this study were expected to be actively courting, since their GSI values indicate they were sexually mature (mean ± S.E.M. = 10.65 ± 3.54; see (Patzner
Accepted
Article
1983) for a description of the ovarian cycle of this species), and in this species all sexually mature females are known to exhibit courtship behaviour (Almada et al. 1995).
RNA extraction and sequencing
Total RNA was extracted from whole brain tissue for each individual of the four phenotypes. Samples were transferred to 1 ml of QIAzol lysis reagent (Qiagen) and the tissue homogenized (on ice) with a sonicator. RNA was then extracted using the RNeasy Lipid Tissue Mini Kit (Qiagen) following
manufacturer’s protocol. RNA quality and concentration for each sample were determined using a NanoDrop 1000 spectrophotometer (Thermo Scientific). Equal amounts of RNA from each individual were used to prepare the RNA pools corresponding to the replicated libraries for each phenotype (2 libraries per phenotype).
Preparation and sequencing of the eight pooled RNA libraries were performed by The Genome Analysis Centre (TGAC, Norwich, United Kingdom). Upon arrival, samples’ RNA integrity was verified on the Agilent 2100 Bioanalyzer. Libraries were prepared from polyA+ RNA and sequenced in two lanes on the Illumina HiSeq 2000 as paired-end 100 bp reads with an approximate insert size of 341 bp. Each library was sequenced at a high depth (Table S1, Supporting Information) to detect transcripts that can become underrepresented when analysing whole brain tissue expression. To improve the de novo assembly, four additional pooled libraries, one for each phenotype, were also prepared using RNA from the previous collection, and sequenced using Roche’s 454 technology. Library preparation and single-end sequencing on a GS-FLX System were performed at Max Planck Institute (Berlin, Germany) using the manufacturer's protocol.
De novo assembly
Quality filtering and trimming of Illumina reads was carried using implemented plugins in Conveyor software (Linke et al. 2011), keeping only pairs of reads that had an overall Phred quality score superior to 20 and a minimum read length of 50 bp (Table S1, Supporting information). In addition to the 454 data, a multi-tissue dataset previously sequenced and used for microsatellite mining
(Cardoso et al. 2013) was also included in the analysis. All 454 reads were quality trimmed to have an overall Phred quality score of 15 and a minimum read length of 100 bp. Read quality was assessed using FastQC v0.7.2 (Andrews 2010).
The de novo transcriptome assembly was carried out in two phases (Fig. S1, Supporting information). First, all 454 reads, which represent the long reads in this work, were assembled with Newbler (454 Sequencing System Software v2.6; Roche) using the -urt option to recover more complete
representations of transcripts as well as low coverage transcripts. The resultant 63,521 Newbler isotigs (N50 = 464 bp) were then given as input together with the Illumina reads to Trinity assembler v20110820 (Grabherr et al. 2011) with default parameters. After redundancy and exogenous contig removal (see Supporting information for more details), 577,532 putative transcripts with an N50 of 1,165 bp (Table S2, Supporting information) were functionally annotated against UniProtKB
Accepted
Article
(taxonomic division vertebrate databases, release April 2014) using BLASTX with an E-value cut-off of 10−5, allowing a maximum of 10 hits per contig.
Differential expression analysis
For differential expression (DE) analysis of transcripts, pairs of reads from each of the eight sequenced libraries (2 pools from each male morph and female) were mapped separately against the filtered Trinity assembly using Bowtie v1.0.0 (Langmead et al. 2009) within RSEM v1.2.8 (Li & Dewey 2011) with default settings. On average 77.8% of the pairs of reads from each library mapped back onto the reference assembly (Table S2, Supporting information). Due to the high read depth of our dataset and the use of pooled individuals for sequencing, we expected that some of the 577,532 contigs present in the assembly would represent assembly mistakes and rare variants (e.g. genetic polymorphisms, introns, chimeras, sequencing errors). To remove this low-level expression noise from the analysis we employed a filter similar to the one used by Harrison and colleagues (2012), and discarded all contigs that did not have at least two fragments per million mappable reads (FPKM = 2, corresponding to 179,202 contigs retained; Fig. S2; Table S2; see Supporting information for more details).
Pairwise comparisons were made using the two libraries per phenotype as biological replicates in the R package DESeq v1.14.0 (Anders & Huber 2010) by applying the default parameters. DESeq has a more data-driven parameter estimation, allowing a better performance in controlling the false-positive rate while also maintaining the power to detect differentially expressed transcripts when analysing experimental designs with a low number of replicates per condition (Soneson & Delorenzi 2013; Zhang et al. 2014). Transcripts were considered to be differentially expressed with a fold change > 2 and a P < 0.05 after Benjamini-Hochberg adjustment for multiple testing (Benjamini & Hochberg 1995). For visualization of the global expression patterns of differentially expressed transcripts among phenotypes, variance stabilized transformed expression values were retrieved and Trinity scripts for heatmap generation using the hclust function in R adapted to produce a hierarchical clustering of Z-transformed expression values using Euclidean distance with complete linkage. The reliability of the inferred tree was assessed by 1,000 bootstrap resampling of the expression values using the R package Pvclust v1.2.2 (Suzuki & Shimodaira 2006). A principal component analysis was also performed using the R package plot3D v1.1, and Venn diagrams created with the R package VennDiagram v1.6.17. Differences in transcript regulation bias towards up- or down-regulation among phenotypes were analysed using a two-way contingency table simulation statistics (ACTUS2, (Estabrook et al. 2002)), based on 1,000 simulations. Other statistical analyses and graphing presented in this work were obtained using R (R Development Core Team 2014).
Transcriptional coexpression network analysis
To investigate the network of co-expressed genes (i.e. gene modules) across phenotypes a weighted coexpression network analysis (WGCNA) was conducted (R package WGCNA v1.51; (Langfelder & Horvath 2008)). This analysis clusters together genes with highly correlated expression values across
Accepted
Article
all samples into modules (Langfelder & Horvath 2008). Variance stabilized transformed expression values from all transcripts that underwent differential expression analysis in DESeq were used. A block-wise weighted signed network approach was followed, using a maximum of 36,000 transcripts in each block, due to constraints in R memory allocation when working with large datasets. In brief, this method pre-clusters nodes into large blocks in an unsupervised way, where hierarchical
clustering is applied independently defining the dendrogram of gene modules (Langfelder & Horvath 2008). Afterwards, the module detection results are combined across blocks by merging modules whose eigengenes (i.e. module-weighted average expression profiles) are highly correlated
(Langfelder & Horvath 2008). The soft-thresholding power (β) was set to 17, corresponding to an R-squared of > 0.80 (Zhang & Horvath 2005) (mean connectivity of 3,406.6; Fig. S3, Supporting
information), with a minimum module size of 30 transcripts. Modules were merged when eigengene dissimilarity between modules was < 0.20. Default settings were used for all other WGCNA
parameters. Statistical significance of module correlation with each phenotype was determined when P < 0.05 after a Benjamini-Hochberg adjustment for multiple testing. These modules were subsequently validated in silico by assessing the relationship between transcript significance for each phenotype and module membership (i.e. correlation of the module eigengene with the transcript expression profile).
Functional Annotation
Sequences and BLAST results for the selected level of differential expression analysis (FPKM = 2) were imported into Blast2GO v2.7 (Conesa et al. 2005), and mapping of Gene Ontology (GO) terms (Ashburner et al. 2000) proceeded against a local database (release April 2014). For the detected differential expressed contigs, samples’ mapping results were manually checked in IGV v2.3.37 (Robinson et al. 2011) and annotations were further refined based on the characteristics of contig-hit alignments by cross-checking BLASTX results from UniProtKB and NCBI’s nr database (E-value cut-off of 10−5, release April 2014). After this step of manual curation, detected chimeras, contigs whose BLAST hits belonged to different genes that showed no significant overlap, were not considered for further analyses (N = 18). GO terms were annotated using an annotation cut-off of 65 and a GO weight of 10, which resulted in 111,325 GO terms annotated to 30,367 contigs and exported in tabular form. GO term enrichment for modules and contigs detected as differentially expressed were evaluated by GOstats v2.32 R package (Falcon & Gentleman 2007) using a ‘conditional’ hypergeometric test with a P < 0.01. This method accounts for the hierarchical relationships of GO terms by removing genes from ancestor terms if they are significantly enriched in a child term. We did not apply any formal correction for multiple testing due to the implicit dependence between neighbouring GO terms, which do not comply with the independence of tests needed for correction of the P-values. Semantic similarity among phenotypes for enriched GO terms was computed using the Wang graph-based method available in the R package GOSemSim v1.30.3 (Yu et al. 2010) independently for each GO ontology, and the respective scores used to cluster samples according to their GO similarity using heatmap clustering. The relative contribution of GO enrichment data in terms of GO classes they represent was visualized using the GO-slim vocabulary and the web tool CateGOrizer (Hu et al. 2008).
Accepted
Article
Results
A total of 1.3 million single-end reads with an average size of 375 bp and 210 million paired-end reads with an average size of 93 bp remained after trimming and were used for de novo
transcriptome assembly. After filtering lowly expressed transcripts, the reference assembly featured 179,202 transcripts with an N50 length of 1,646 bp (Table S2, Supporting information). The
annotation of the peacock blenny transcriptome assembly against the vertebrate division of
UniProtKB revealed that only 45,994 contigs (ca. 25.7%) had a BLAST hit, and that more than half of these contigs had its top hit from one of three species of fish, Oreochromis niloticus (N = 18,139),
Xiphophorus maculatus (N = 5,190) and Gasterosteus aculeatus (N = 4,423).
Differential transcript expression across phenotypes
Six pairwise comparisons were performed using DESeq’s negative binomial model with a false discovery cut-off of 5%, resulting in a total of 814 transcripts (corresponding to 0.45% of the
transcriptome and 704 Trinity predicted genes) detected as being differentially expressed among the four phenotypes. Normalized expression profiles represented by hierarchical clustering were
obtained considering all phenotypes (Fig. 2A). All biological replicates were clustered according to their respective phenotype. The profile of DE transcripts was more similar between nest-holder males and females than with transitional males or with sneaker males. Sneakers formed their own cluster apart from all other phenotypes. All clusters had high confidence, as illustrated by the bootstrap probability values (Fig. 2A). Principal components analysis of DE transcripts also showed a clear separation among male morphs, with the first three components accounting for 85.2% of the observed variance in transcript expression (Fig. 2B; Table S3, Supporting information).
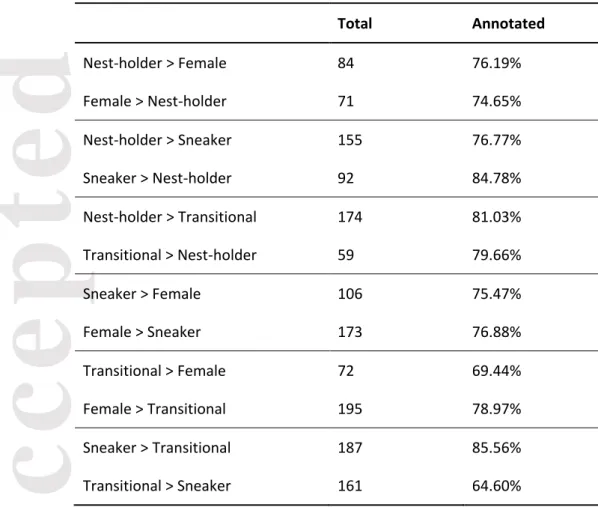
Regarding the pairwise comparisons (Table 1; Tables S4-S9, Supporting information), the comparison between nest-holder males and females had the lowest number of differentially expressed
transcripts (N = 155), whereas the comparison between sneakers and transitional males had the highest number of differentially expressed transcripts (N = 348). Overall, sneaker males differed from the other phenotypes in the expression of 644 transcripts (78.38% annotated), followed by transitional males (600 transcripts; 75.71% annotated), females (564 transcripts; 76.51% annotated) and finally nest-holder males (518 transcripts; 78.92% annotated). A bias in the direction of
expression of these transcripts was also detected for each phenotype. Looking into the total number of transcripts that were either up- or down-regulated in a phenotype, nest-holder males and females had more transcripts up-regulated and fewer transcripts down-regulated than expected by chance, whereas sneaker and transitional males had the opposite pattern with fewer transcripts
up-regulated and more transcripts down-up-regulated than expected by chance (one-tailed P-value < 0.05; Fig. 2C). These results point to different mechanisms of gene regulation acting across phenotypes. However, when the number of transcripts that were only found to be either up- or down- regulated on a specific phenotype was examined, all phenotypes showed a bias towards down-regulation (Z-tests with p < 0.05: nest-holder, z = –12.69; transitional, z = –13.64; sneaker, z = –10.63; female, z = – 12.01; Fig. 2C), indicating that negative regulation of gene expression was more specific within each phenotype than positive regulation.
Accepted
Article
Gene ontology (GO) enrichment analysis
GO analysis for up-regulated transcripts within each phenotype revealed distinct classes of enriched terms in male morphs (Fig. 3; Table S10, Supporting information). Nest-holder males had a
predominant enrichment for processes related to lipid metabolism and transmembrane transport of ions at the cell level. Females showed a predominant enrichment for protein metabolism and, similarly to nest-holder males, transmembrane transport of ions. Sneaker males had a specific enrichment for processes related to morphogenesis, development, cell cycle, and DNA metabolism. Finally, transitional males showed an enrichment primarily for regulation of cellular transport, cellular organization and biogenesis processes. Noteworthy, all phenotypes, with the exception of nest-holder males, had an enrichment for terms related to cell, cytoskeleton and organelle
organization and biogenesis, whereas sneaker males were the only phenotype with enrichment for extracellular processes (Fig. 3). These enrichment results were further used to obtain measures of GO semantic similarity among phenotypes separately for each ontology (Fig. 3). For both ‘Biological Process’ and ‘Molecular Function’ nest-holder males and females had a GO enrichment more similar between themselves than with sneakers and transitional males. In contrast, for ‘Cellular Component’ enrichment transitional males were closer to nest-holders. Taken together, these results are in accordance with the gene expression level clustering.
Additionally, GO analysis for down-regulated transcripts within each phenotype also presented distinct classes of enriched terms in male morphs (Fig. 4; Table S11, Supporting information). Transcripts down-regulated in nest-holder males had a predominant GO enrichment for processes related with cell and organelle organization and biogenesis, cell differentiation, and protein metabolism and modification at the cell and intracellular level. Down-regulated transcripts in females showed a predominant enrichment for processes related with transporter activity, metabolism, and biosynthesis. Finally, both sneaker and transitional males had transcripts down-regulated with an enrichment for ion transport activity. Additionally, only transitional males presented an enrichment for processes related to lipid metabolism and development. GO semantic similarity analysis (Fig. 4), showed that overall sneaker and transitional males had a GO enrichment more similar between themselves than with females or nest-holder males, with the exception for ‘Biological Process’ where nest-holder males had the most dissimilar enrichment when compared with the remaining phenotypes.
Demasculinization versus feminization of the brain transcriptome of
sneakers and transitional males
To further test how the brain transcriptomes of sneakers and transitional males are related to the ones of either nest-holder males or females, we analysed sex-biased transcripts (i.e. transcripts that were up-regulated in either nest-holder males or females; Fig. 5). Both sneaker males and
transitional males expressed nest-holder-biased transcripts (N = 84) at significantly lower levels than nest-holders (Fig. 5A), suggesting that the brains of these male morphs are transcriptionally
demasculinized. Conversely, both sneaker and transitional males expressed female-biased
Accepted
Article
transcriptionally feminized. Interestingly, there were no significant differences between sneaker and transitional males in the expression of either nest-holder-or female-biased transcripts (Fig. 5A). Hierarchical clustering of expression levels showed that both sneaker and transitional males clustered together with high confidence with nest-holder males for nest-holder-biased transcripts, and with females for female-biased transcripts (Fig. 5B). This clustering pattern suggests that the brain transcriptome of these two male morphs can be interpreted as intersex rather than either typically male or female. Hierarchical clustering of expression levels also showed that among the three male morphs transitional and nest-holder males clustered together for nest-holder-biased genes, suggesting a higher degree of demasculinization of the sneakers' brain transcriptome than of the transitional males. In contrast, transitional and sneaker males clustered together for female-biased genes, suggesting that their brain transcriptomes are equally feminized.
From the 71 female-biased transcripts, 37 were up-regulated in sneaker males of which 25 were also up-regulated in transitional males relative to nest-holder males (Tables S12 and S13, Supporting information). Thus, the 12 female-biased transcripts, which were exclusively up-regulated in females and sneaker males, are potential candidate genes to control the expression of female-like courtship behaviour. These candidate genes had an enrichment in GO terms for biological processes mainly involved in histone modifications and in the regulation of Ral protein signal transduction, which is involved in neural plasticity among other processes (Table S13c, Supporting information).
From the 84 nest-holder-biased transcripts, 48 were also up-regulated in sneakers of which 25 were also up-regulated in transitional males (Table S14 and S15, Supporting information). Thus, the 23 transcripts that were exclusively up-regulated in nest-holder and sneaker males, represent candidate genes for the control of male reproduction since both nest-holders and sneakers, but not
transitional males, are sexually mature. These transcripts had an enrichment in GO terms mainly related to cell cycle regulation (Table S15b, Supporting information). From the 84 male nest-holder transcripts, 19 were exclusively up-regulated in nest-holder males (but not in either sneakers or transitional males) (Table S14, Supporting information). Hence, these transcripts represent potential candidate genes for the control of male reproductive behaviour (i.e. nesting, breeding territoriality). From these transcripts, only two had GO terms enriched to cell-cell contact and actin cytoskeleton (Table S15d, Supporting information).
Patterns of gene co-expression modules among phenotypes
The WGCNA showed that the transcriptome could be clustered in 171 modules, with modules ranging in size from 30 to 41,342 transcripts (Fig. S4 and Table S16, Supporting information). From these, only three modules could be significantly associated with one of the phenotypes after Benjamini-Hochberg correction: the plum3 module (Pearson’s r = 0.99 with P = 0.001) with nest-holder males, and the sienna3 and salmon modules (rsienna3 = 0.99, rsalmon = −0.96, with Psienna3 = 0.001,
Psalmon = 0.04) with sneaker males. All three modules showed a significant positive correlation
between transcript significance between the phenotype and module membership, corroborating the importance of these modules for each of the male’s phenotypes (Fig. S5, Supporting information). Plum3 module included 296 transcripts, of which seven transcripts were also found up-regulated for nest-holder males. This module was mainly enriched for GO terms associated with energy
Accepted
Article
production through the oxidative phosphorylation metabolic pathway (Table S17a, Supporting information). Sienna3 module included 1,031 transcripts, of which 17 were also found as up-regulated in sneaker males. This module represented an enrichment for processes involved in the canonical Wnt signalling pathway, cytokinesis, glucose metabolism and carbohydrate transport (Table S17b, Supporting information). The only module with a negative correlation was the salmon module containing 7,951 transcripts, of which 142 transcripts were also found down-regulated in sneaker males. This module was mainly enriched for processes involved in the regulation of G-protein coupled receptor signalling pathway (Table S17c, Supporting information).
Discussion
Here, we describe the development of a de novo transcriptome and brain gene expression profiles of wild-caught peacock blenny, Salaria pavo, an intertidal fish with sex-role reversal in courtship
behaviour (i.e. females are the courting sex) and presence of alternative reproductive male morphs (Gonçalves et al. 1996; Fagundes et al. 2015).
Brain transcriptomic architecture of alternative reproductive tactics
We found that each peacock blenny phenotype has a distinct transcriptomic profile (Fig. 2A), indicating that distinct behavioural repertoires are associated with distinct neurogenomic states, which differentiate not only sex but also male morphs. These results are consistent with previous studies that have already described this parallel between specific behavioural states and
neurogenomic states at different timescales (reviewed in (Zayed & Robinson 2012; Harris & Hofmann 2014; Cardoso et al. 2015)), and with previousreports of specific brain transcriptomic profiles among species with ARTs for alternative male morphs, particularly in teleost fishes (Aubin-Horth et al. 2005; Schunter et al. 2014; Fraser et al. 2014; Stiver et al. 2015; Partridge et al. 2016; Nugent et al. 2016). For example, in bluegill sunfish (Lepomis macrochirus) the three male ARTs, encompassing two distinct life histories, presented distinct neurogenomic profiles, with sneaker males having the most divergent expression profile, while parental males were further discriminated in the analysis relatively to their reproductive state (i.e. spawning vs. non-spawning; (Partridge et al. 2016)). In sailfin mollies (Poecilia latipinna), differentially expressed transcripts were also associated with each ART: in which small males and large males have fixed alternative tactics, always displaying sneaking and courtship behaviour, respectively, whereas intermediate males display courtship or sneaking behaviour depending on the male composition of their social environment (Fraser et al. 2014). Interestingly, in sailfin mollies the differentially expressed transcripts in the brain associated with the plastic male tactic tended to exhibit larger and more robust genetically regulated changes than socially regulated changes (Fraser et al. 2014). Thus, both in fixed and in plastic ARTs the expression of alternative morphs with specific behavioural phenotypes within the same sex seems to be achieved through differential gene expression in the brain. However, when one compares the available brain RNA-seq transcriptome data for teleost species with ARTs no clear pattern emerges. Whereas in some species sneaker males exhibit the most distinctive transcriptome (e.g. L.
Accepted
Article
other species nest-holder males are the most differentiated phenotype (e.g. Symphodus ocellatus (Nugent et al. 2016)). Similarly, the lists of differentially expressed genes for functionally equivalent phenotypes (e.g. sneakers) across species do not share significant numbers of transcripts, suggesting that ARTS may have evolved in different species through species-specific genetic architectures.
In contrast to the morph-specific profiles of differentially expressed genes, the patterns of gene co-expression modules were only specific for holder and sneaker males. Indeed, the nest-holder phenotype was associated with a gene co-expression module enriched for GO terms
associated with energy production, which may reflect the metabolic demand of reproduction in nest-holder males, who have to defend breeding territories for extended periods of time during, in which they do not exit the nest for feeding, hence presenting a sharp decline in their body condition over the breeding season (Gonçalves & Almada 1997). On the other hand, the sneaker phenotype was associated with: (1) the up-regulation of a gene co-expression module involved in the canonical
Wnt signalling pathway and metabolisms, which may reflect their developmental stage; and (2) with
a down-regulation of a gene co-expression module enriched for processes involved in the regulation of G-protein-coupled-receptor (GPCR) signalling pathway, which may reflect a mechanisms to make the brain of sneakers less responsive to male gonadal signals (e.g. sex steroids), given that sneakers have mature gonads. In fact, despite the fact that steroid hormones exert their actions by binding to intracellular nuclear receptors, which then bind to DNA to initiate gene transcription (i.e. steroid-inducible transcription factors), steroids can also activate GPCRs in the cell membrane, or even located intracellularly (e.g. G-protein-coupled-estrogen-receptor), to initiate rapid non-genomic effects (Losel et al. 2003; Maggiolini & Picard 2010; Gaudet et al. 2015). The lack of specific gene modules for transitional males and females can be due to the complex dataset that generated a large number of gene co-expression modules. Nonetheless, the analysis revealed the same pattern as the DE analysis among females and male morphs and, for the three significant modules discussed above, a partial overlap was present between transcripts belonging to the morph-specific gene modules and the direction of expression of differentially expressed genes in those morphs. Overall, these results suggest that the brain transcriptome reflects better reproductive plasticity rather than sex-dimorphism. However, other factors present in the experimental design may have affected the observed patterns as well, namely: age differences between phenotypes; analysis of whole brain gene expression data; use of pooled samples; and the low number of biological replicates. For example, the use of whole brain samples may have masked regional differences in gene expression between phenotypes. Nevertheless, whole brain transcriptome analyses have been very informative as a first approach to characterize behavioural phenotypes namely in the ART literature (Aubin-Horth et al. 2005; Schunter et al. 2014; Fraser et al. 2014; Stiver et al. 2015; Partridge et al. 2016; Nugent et al. 2016). Similarly, the use of sample pooled replicates offers the advantage of incorporating information from more individuals into de analysis while still allowing for the estimation of biological variability (Todd et al. 2016), although greater power in the statistical analysis would have been gained by using more biological replicates (Robles et al. 2012). Finally, differences among male morphs may be influenced by differences in age, since sneaker males are younger than nest-holder males and transitional males lay between the two. Hence, in this study it is not possible to disentangle the effect of age from that of reproductive tactic. However, it should be noted that the expression of a specific tactic is one of the most prominent phenotypic characteristic of each age class, and that in other studies, where it was possible to assess the effect of age and age-dependent behavioural tactic to the transcriptome, the latter was the most relevant (e.g. differences
Accepted
Article
in gene expression associated with the transition from nurse to forager in honey bees are largely independent of natural age-related changes (Whitfield et al. 2006)). In summary, despite the possibility of more detailed studies in the future, the present results already reveal ART specific brain gene expression profiles in the peacock blenny.
Potential role of epigenetic mechanisms in alternative reproductive
tactics
Although we do not aim to discuss in detail the list of genes differentially expressed between the different morphs of the peacock blenny, it is important to note the presence of enzymes responsible for post-translational modification of histones (i.e. chromatin rearrangements), and for repression of DNA transcription (i.e. DNA methylation), among the differentially expressed transcripts, hence providing some of the first evidence of the relevance of epigenetic marks in this species and more broadly in the context of ARTs. The role of epigenetic mechanisms in the expression of within-species differential behavioural phenotypes has already been highlighted in other contexts, namely in caste differentiation among social insects (e.g. (Yan et al. 2014)), and recently in relation to social status dependent behaviours of fish (Lenkov et al. 2015). In particular in our study, dnmt3a,
encoding an enzyme responsible for de novo methylation of DNA (Okano et al. 1999), was
upregulated in females, transitional and sneaker males, suggesting a common role for this enzyme in the modulation of behaviour among these phenotypes (e.g. decreased aggression in all three and/or and display of female courtship in females and sneakers) when compared with nest-holders. This enzyme has been recently found to be required for brain feminization in female rat pups within the hormonally sensitive period of sexual differentiation (Nugent et al. 2015). During this period, aromatization of testosterone (T), synthesized by male testes, to oestradiol (E2) within the
developing neurons, leads to a suppression of dnmt3a activity, which in turn enables male-specific neuronal organizational effects to take place and a consequent expression of male sexual behaviours in the adult (Nugent et al. 2015). A similar mechanism of brain feminization may be present in the peacock blenny. In this species gonadal steroids regulate different aspects of reproductive behaviour in the different morphs (Oliveira et al. 2001; Gonçalves et al. 2007, 2014), and sneaker males have lower levels of brain aromatase mRNA (Gonçalves et al. 2010) and of brain aromatase activity (Gonçalves et al. 2008) than nest-holder males. Thus, neuronal intracellular levels of E2 are expected to be low in sneakers in comparison to nest-holder males, consistent with the observed
up-regulation of dnmt3a in sneakers. Further experiments are necessary to test this hypothesis further.
Genetic architecture of female mimicry in sneaker males
Despite marked sex differences in sexual behaviour between nest-holders and females, in our study relatively few genes were expressed differentially between the sexes, differences being more pronounced among morphs within the same sex (i.e. nest-holder vs. sneaker vs. transitional males). Thus, it is possible that the observed sex differences in reproductive behaviour are due to these few male- or female-biased genes. Therefore, in order to test the hypothesis that the lack of male reproductive behaviour (i.e. nesting and territorial defence) in sneakers was due to a
Accepted
Article
demasculinization of their brain transcriptome, whereas their expression of female-like behaviour was linked to a feminization of their brain transcriptome, we looked into the expression of male- and female-biased genes across morphs. The fact that both sneaker and transitional males have a lower expression of male-biased brain transcripts than nest-holder males reflects a demasculinization of the brains of these morphs, which may reflect their lack of expression of male reproductive behaviour. On the other hand, the fact that both sneaker and transitional males have a higher expression of female-biased brain transcripts than nest-holder males suggests a feminization of these male morphs. Thus, the brain transcriptome of both sneaker and transitional males is intersex, rather than typically male (or female). However, since from these two male morphs only sneaker males are sexually active and express female-like reproductive behaviour (i.e. courtship and nuptial colouration) the feminization of the sneaker’s brain transcriptome (that also occurs in transitional males) cannot be associated with the expression of female-like behaviour by these males. Therefore, female-courtship expressed by females and by sneaker males seems to be associated with different brain transcriptomic architectures. This result is further supported by the lack of shared gene modules between sneakers and females in our WGCNA analysis. However, it has been recently shown that individual dimorphically expressed genes in specific regions of the brain may control one or a few components of a sex-typical behaviour in mice (Xu et al. 2012; Yang & Shah 2014).
Therefore, two alternative hypotheses may explain the genetic basis of female mimicry in the peacock blenny sneaker males: (1) despite their kinematic and structural similarities, the courtship behaviour expressed by females and sneaker males is controlled by different genetic programs; or (2) despite the lack of differences in the average expression of female-biased genes between sneakers and transitional males, there are specific female-biased genes, which are also biased in sneakers but not in transitional males, that regulate female courtship in both sneakers and females. In support of the latter hypothesis, we found 12 transcripts that were exclusively up-regulated in sneakers and females, which have a functional annotation that suggests an involvement on neural plasticity, in some cases with interactions with estrogen responsive elements. Interestingly the mate search component of female courtship in this species has been shown to be estrogen-dependent (Gonçalves et al. 2014). Thus, the hypothesis of a shared genetic factor underlying the expression of female courtship in both females and sneakers is the most parsimonious of the two presented above. Newly available techniques of genome editing (e.g. CRISPR/Cas9, (Heidenreich & Zhang 2016; Lee et al. 2016)) open the door to testing the role of specific candidate genes in the control of female courtship behaviour in both females and sneakers.
Conclusions
In summary, our results are consistent with previous studies in species with ARTs, and show that at the brain level intrasexual behavioural plasticity is accompanied by broader changes in gene expression than intersexual differences in sex-dimorphism, which is in clear contrast to what has been found in gonad (Pointer et al. 2013; Harrison et al. 2015; Dean et al. 2017) and whole body (Stuglik et al. 2014) transcriptional variation. However, the lack of reference genomes for most teleosts limits much of the work on ARTs possibly leaving other major regulatory and structural mechanisms unexplored (e.g. supergene in the ruff Philomachus pugnax; (Küpper et al. 2015; Lamichhaney et al. 2015)). Furthermore, our results for the peacock blenny also indicate that at the
Accepted
Article
brain level reproductive plasticity can be explained by varying the magnitude of sex-biased gene expression. A shift in expression of sex-biased genes has been found in response to sexual selection in mating behaviour (Hollis et al. 2014; Immonen et al. 2014) and has been considered one of the evolutionary processes for differential male and female adaptation. Our results suggest that a similar process may mediate the evolution of alternative reproductive morphs within one of the sexes, in our case males, that explore new areas of the sex-biased transcriptional landscape.
Acknowledgements
S.D.C. would like to thank Oliver Rupp from the Bioinformatics and Systems Biology group for the advices and assistance during the assembly of the dataset. This study was supported by the research grants PTDC/MAR/69749/2006 and EXCL/BIA-ANM/0549/2012 from the Portuguese Foundation for Science and Technology (FCT), and grant no. 012/2012/A1 from the Macao Science and Technology Development Fund (FDCT). During the writing of this manuscript S.D.C. was being supported by a Ph.D. fellowship (SFRH/BD/89072/2012) from FCT.
References
Almada VC, Gonçalves EJ, Oliveira RF, Santos AJ (1995) Courting females: ecological constraints affect sex roles in a natural population of the blenniid fish Salaria pavo. Animal Behaviour, 49, 1125–1127.
Almada VC, Gonçalves EJ, Santos AJ, Baptista C (1994) Breeding ecology and nest aggregations in a population of Salaria pavo (Pisces: Blenniidae) in an area where nest sites are very scarce.
Journal of Fish Biology, 45, 819–830.
Anders S, Huber W (2010) Differential expression analysis for sequence count data. Genome Biology,
11, R106.
Andrews S (2010) FastQC: A Quality Control Tool for High Throughput Sequence Data. Available online at: http://www.bioinformatics.babraham.ac.uk/projects/fastqc.
Ashburner M, Ball CA, Blake JA et al. (2000) Gene ontology: tool for the unification of biology. The Gene Ontology Consortium. Nature Genetics, 25, 25–29.
Aubin-Horth N, Landry CR, Letcher BH, Hofmann HA (2005) Alternative life histories shape brain gene expression profiles in males of the same population. Proceedings of the Royal Society of
London B: Biological Sciences, 272, 1655–1662.
Barata EN, Serrano RM, Miranda A et al. (2008) Putative pheromones from the anal glands of male blennies attract females and enhance male reproductive success. Animal Behaviour, 75, 379– 389.
Accepted
Article
approach to multiple testing. Journal of the Royal Statistical Society. Series B, 57, 289–300. Cardoso SD, Gonçalves D, Robalo JI et al. (2013) Efficient isolation of polymorphic microsatellites
from high-throughput sequence data based on number of repeats. Marine Genomics, 11, 11– 16.
Cardoso SD, Teles MC, Oliveira RF (2015) Neurogenomic mechanisms of social plasticity. Journal of
Experimental Biology, 218, 140–149.
Conesa A, Götz S, García-Gómez JM et al. (2005) Blast2GO: a universal tool for annotation, visualization and analysis in functional genomics research. Bioinformatics, 21, 3674–3676. Dean R, Wright AE, Marsh-Rollo SE et al. (2017) Sperm competition shapes gene expression and
sequence evolution in the ocellated wrasse. Molecular Ecology, 26, 505–518.
Ellegren H, Parsch J (2007) The evolution of sex-biased genes and sex-biased gene expression.
Nature Reviews Genetics, 8, 689–698.
Estabrook G, Almada V, Almada F, Robalo J (2002) Analysis of conditional contingency using ACTUS2 with examples from studies of animal behavior. Acta ethologica, 4, 73–80.
Fagundes T, Simões MG, Saraiva JL et al. (2015) Birth date predicts alternative life history pathways in a fish with sequential reproductive tactics. Functional Ecology, 29, 1533–1542.
Falcon S, Gentleman R (2007) Using GOstats to test gene lists for GO term association.
Bioinformatics, 23, 257–258.
Fishelson L (1963) Observations on littoral fishes of Israel. I. Behaviour of Blennius pavo Risso (Teleostei: Blenniidae). Israel Journal of Zoology, 12, 67–80.
Fraser BA, Janowitz I, Thairu M, Travis J, Hughes KA (2014) Phenotypic and genomic plasticity of alternative male reproductive tactics in sailfin mollies. Proceedings of the Royal Society B:
Biological Sciences, 281, 20132310.
Gaudet HM, Cheng SB, Christensen EM, Filardo EJ (2015) The G-protein coupled estrogen receptor, GPER: The inside and inside-out story. Molecular and Cellular Endocrinology, 418, 207–219. Gonçalves EJ, Almada VC (1997) Sex differences in resource utilization by the peacock blenny.
Journal of Fish Biology, 51, 624–633.
Gonçalves EJ, Almada VC, Oliveira RF, Santos AJ (1996) Female mimicry as a mating tactic in males of the blenniid fish Salaria pavo. Journal of the Marine Biological Association of the United
Kingdom, 76, 529–538.
Gonçalves D, Alpedrinha J, Teles M, Oliveira RF (2007) Endocrine control of sexual behavior in sneaker males of the peacock blenny Salaria pavo: effects of castration, aromatase inhibition, testosterone and estradiol. Hormones and Behavior, 51, 534–541.
Gonçalves DM, Barata EN, Oliveira RF, Canário AVM (2002) The role of male visual and chemical cues on the activation of female courtship behaviour in the sex-role reversed peacock blenny.
Accepted
Article
Journal of Fish Biology, 61, 96–105.
Gonçalves D, Costa SS, Teles MC et al. (2014) Oestradiol and prostaglandin F2 regulate sexual displays in females of a sex-role reversed fish. Proceedings of the Royal Society B: Biological
Sciences, 281, 20133070–20133070.
Gonçalves D, Saraiva J, Teles M et al. (2010) Brain aromatase mRNA expression in two populations of the peacock blenny Salaria pavo with divergent mating systems. Hormones and Behavior, 57, 155–161.
Gonçalves D, Teles M, Alpedrinha J, Oliveira RF (2008) Brain and gonadal aromatase activity and steroid hormone levels in female and polymorphic males of the peacock blenny Salaria pavo.
Hormones and Behavior, 54, 717–725.
Grabherr MG, Haas BJ, Yassour M et al. (2011) Full-length transcriptome assembly from RNA-Seq data without a reference genome. Nature Biotechnology, 29, 644–652.
Harris RM, Hofmann HA (2014) Neurogenomics of behavioral plasticity. In: Ecological Genomics.
Advances in Experimental Medicine and Biology (eds Landry CR, Aubin-Horth N), pp. 149–168.
Springer, Dordrecht.
Harrison PW, Mank JE, Wedell N (2012) Incomplete sex chromosome dosage compensation in the Indian meal moth, Plodia interpunctella, based on de novo transcriptome assembly. Genome
Biology and Evolution, 4, 1118–1126.
Harrison PW, Wright AE, Zimmer F et al. (2015) Sexual selection drives evolution and rapid turnover of male gene expression. Proceedings of the National Academy of Sciences of the United States
of America, 112, 4393–4398.
Heidenreich M, Zhang F (2016) Applications of CRISPR-Cas systems in neuroscience. Nature reviews.
Neuroscience, 17, 36–44.
Hollis B, Houle D, Yan Z, Kawecki TJ, Keller L (2014) Evolution under monogamy feminizes gene expression in Drosophila melanogaster. Nature Communications, 5, 689–698.
Hu Z-L, Bao J, Reecy JM (2008) CateGOrizer: A Web-Based Program to Batch Analyze Gene Ontology Classification Categories. Online Journal of Bioinformatics, 9, 108–112.
Immonen E, Snook RR, Ritchie MG (2014) Mating system variation drives rapid evolution of the female transcriptome in Drosophila pseudoobscura. Ecology and Evolution, 4, 2186–2201. Küpper C, Stocks M, Risse JE et al. (2015) A supergene determines highly divergent male
reproductive morphs in the ruff. Nature Genetics, 48, 79–83.
Lamichhaney S, Fan G, Widemo F et al. (2015) Structural genomic changes underlie alternative reproductive strategies in the ruff (Philomachus pugnax). Nature Genetics, 48, 84–88. Langfelder P, Horvath S (2008) WGCNA: an R package for weighted correlation network analysis.
Accepted
Article
Langmead B, Trapnell C, Pop M, Salzberg SL (2009) Ultrafast and memory-efficient alignment of short DNA sequences to the human genome. Genome Biology, 10, R25.
Lee HB, Sundberg BN, Sigafoos AN, Clark KJ (2016) Genome Engineering with TALE and CRISPR Systems in Neuroscience. Frontiers in Genetics, 7, 47.
Lenkov K, Lee MH, Lenkov OD, Swafford A, Fernald RD (2015) Epigenetic DNA Methylation Linked to Social Dominance. PloS ONE, 10, e0144750.
Li B, Dewey CN (2011) RSEM: accurate transcript quantification from RNA-Seq data with or without a reference genome. BMC Bioinformatics, 12, 323.
Linke B, Giegerich R, Goesmann A (2011) Conveyor: a workflow engine for bioinformatic analyses.
Bioinformatics, 27, 903–911.
Losel RM, Falkenstein E, Feuring M et al. (2003) Nongenomic Steroid Action: Controversies, Questions, and Answers. Physiological Reviews, 83, 965–1016.
Maggiolini M, Picard D (2010) The unfolding stories of GPR30, a new membrane-bound estrogen receptor. Journal of Endocrinology, 204, 105–114.
Mank JE (2009) Sex Chromosomes and the Evolution of Sexual Dimorphism: Lessons from the Genome. The American Naturalist, 173, 141–150.
Mank JE (2017) The transcriptional architecture of phenotypic dimorphism. Nature Ecology &
Evolution, 1, 6.
Nugent BM, Stiver KA, Alonzo SH, Hofmann HA (2016) Neuroendocrine profiles associated with discrete behavioural variation in Symphodus ocellatus, a species with male alternative reproductive tactics. Molecular Ecology, 25, 5212–5227.
Nugent BM, Wright CL, Shetty AC et al. (2015) Brain feminization requires active repression of masculinization via DNA methylation. Nature Neuroscience, 18, 690–697.
Okano M, Bell DW, Haber DA, Li E (1999) DNA Methyltransferases Dnmt3a and Dnmt3b Are Essential for De Novo Methylation and Mammalian Development. Cell, 99, 247–257.
Oliveira RF, Almada VC, Forsgren E, Gonçalves EJ (1999) Temporal variation in male traits, nesting aggregations and mating success in the peacock blenny. Journal of Fish Biology, 54, 499–512. Oliveira RF, Carneiro L a, Gonçalves DM, Canario a V, Grober MS (2001) 11-Ketotestosterone inhibits
the alternative mating tactic in sneaker males of the peacock blenny, Salaria pavo. Brain,
Behavior and Evolution, 58, 28–37.
Partridge CG, MacManes MD, Knapp R, Neff BD (2016) Brain Transcriptional Profiles of Male Alternative Reproductive Tactics and Females in Bluegill Sunfish. PLoS ONE, 11, e0167509. Patzner RA (1983) The reproduction of Blennius pavo (Teleostei, Blenniidae). I. Ovarial cycle,
Accepted
Article
Patzner RA, Seiwald M, Adlgasser M, Kaurin G (1986) The reproduction of Blennius pavo (Teleostei, Blenniidae) V. Reproductive behavior in natural environment. Zoologischer Anzeiger, 216, 338– 350.
Pointer MA, Harrison PW, Wright AE, Mank JE (2013) Masculinization of gene expression is associated with exaggeration of male sexual dimorphism. PLoS Genetics, 9, e1003697. R Development Core Team (2014) R: A language and environment for statistical computing. R
Foundation for Statistical Computing, Vienna, Austria. URL http://www.R-project.org/. Robinson JT, Thorvaldsdóttir H, Winckler W et al. (2011) Integrative genomics viewer. Nature
Biotechnology, 29, 24–26.
Robles JA, Qureshi SE, Stephen SJ et al. (2012) Efficient experimental design and analysis strategies for the detection of differential expression using RNA-Sequencing. BMC Genomics, 13, 484. Saraiva JL, Barata EN, Canário AVM, Oliveira RF (2009) The effect of nest aggregation on the
reproductive behaviour of the peacock blenny Salaria pavo. Journal of Fish Biology, 74, 754– 762.
Schunter C, Vollmer S V, Macpherson E, Pascual M (2014) Transcriptome analyses and differential gene expression in a non-model fish species with alternative mating tactics. BMC Genomics, 15, 167.
Snell-Rood EC, Cash A, Han M V et al. (2011) Developmental decoupling of alternative phenotypes: insights from the transcriptomes of horn-polyphenic beetles. Evolution, 65, 231–245.
Soneson C, Delorenzi M (2013) A comparison of methods for differential expression analysis of RNA-seq data. BMC Bioinformatics, 14, 91.
Stiver KA, Harris RM, Townsend JP, Hofmann HA, Alonzo SH (2015) Neural Gene Expression Profiles and Androgen Levels Underlie Alternative Reproductive Tactics in the Ocellated Wrasse, Symphodus ocellatus. Ethology, 121, 152–167.
Stuglik MT, Babik W, Prokop Z, Radwan J (2014) Alternative reproductive tactics and sex-biased gene expression: the study of the bulb mite transcriptome. Ecology and Evolution, 4, 623–632. Suzuki R, Shimodaira H (2006) Pvclust: an R package for assessing the uncertainty in hierarchical
clustering. Bioinformatics, 22, 1540–1542.
Taborsky M (1994) Sneakers, Satellites, and Helpers: Parasitic and Cooperative Behavior in Fish Reproduction. Advances in the Study of Behavior, 23, 1–100.
Taborsky M, Oliveira RF, Brockmann HJ (2008) The evolution of alternative reproductive tactics: concepts and questions. In: Alternative Reproductive Tactics: an Integrative Approach (eds Oliveira RF, Taborsky M, Brockmann HJ), pp. 1–21. Cambridge University Press, Cambridge. Todd E V., Black MA, Gemmell NJ (2016) The power and promise of RNA-seq in ecology and
Accepted
Article
Wang Z, Gerstein M, Snyder M (2009) RNA-Seq: a revolutionary tool for transcriptomics. Nature
Reviews Genetics, 10, 57–63.
Whitfield CW, Ben-Shahar Y, Brillet C et al. (2006) Genomic dissection of behavioral maturation in the honey bee. Proceedings of the National Academy of Sciences of the United States of
America, 103, 16068–16075.
Xu X, Coats JK, Yang CF et al. (2012) Modular genetic control of sexually dimorphic behaviors. Cell,
148, 596–607.
Yan H, Simola DF, Bonasio R et al. (2014) Eusocial insects as emerging models for behavioural epigenetics. Nature Reviews Genetics, 15, 677–688.
Yang CF, Shah NM (2014) Representing sex in the brain, one module at a time. Neuron, 82, 261–278. Yu G, Li F, Qin Y et al. (2010) GOSemSim: an R package for measuring semantic similarity among GO
terms and gene products. Bioinformatics, 26, 976–978.
Zayed A, Robinson GE (2012) Understanding the relationship between brain gene expression and social behavior: lessons from the honey bee. Annual Review of Genetics, 46, 591–615.
Zhang B, Horvath S (2005) A general framework for weighted gene co-expression network analysis.
Statistical applications in genetics and molecular biology, 4, Article17.
Zhang ZH, Jhaveri DJ, Marshall VM et al. (2014) A Comparative Study of Techniques for Differential Expression Analysis on RNA-Seq Data. PLoS ONE, 9, e103207.
Zuk M, Balenger SL (2014) Behavioral ecology and genomics: new directions, or just a more detailed map? Behavioral Ecology, 25, 1277–1282.
Data Accessibility
Both raw data and transcriptome assembly were deposited in BioProject portal at NCBI (PRJNA329073).
Author Contributions
SDC, DG, AVMC and RFO were responsible for the design and implementation of the study. Assembly of the sequence data was performed by SDC and AG, and subsequent analyses by SDC. SDC and RFO wrote the manuscript with contributions from all authors.
Accepted
Article
Figures
Fig. 1 The peacock blenny (Salaria pavo) has two reproductive male morphs and sex-role reversal in
courtship behaviour. Larger and older nest-holder males (inside the nest) with well-developed secondary sexual characters (e.g. head crest) are courted by (A) females and (B) smaller and younger sneaker males behaving as female-mimics. Both females and sneaker males while courting the nest-holder male display a conspicuous nuptial colouration that consists on a pattern of dark and light band across the anterior portion of the body.
Fig. 2 Differences in brain expression patterns across Salaria pavo phenotypes. A) Heatmap of all
transcripts differentially expressed (N = 814) between 2 or more phenotypes, either with or without functional annotation. Intensity of colour indicates relative expression levels of each transcript (rows) in each phenotype sample (columns), with blue representing down-regulated transcripts and yellow up-regulated transcripts. Similarity between phenotypes with hierarchical clustering can be seen above the heatmap with respective bootstrap values. B) Principle Components Analysis (PCA) shows a clear separation between male morphs across the first three components, which account for 85.2% of the observed variance in transcript expression. C) Total number of transcripts for which each phenotype showed significantly different expression from all other phenotypes. Differences in the degree of bias in expression for each phenotype toward up- or down-regulation were tested using a two-way contingency table simulation statistics (* cases detected as significantly big, ** cases detected as significantly small based on 1,000 simulated tables in ACTUS2, one tailed P-value < 0.05). Dark yellow and dark blue bars indicate the number of transcripts expressed exclusively by the phenotype. Light yellow and light blue bars indicate the number of transcripts expressed in two or more phenotypes regardless of the pairwise comparison. Each phenotype is colour coded in agreement with blue for nest-holder males (NH), green for transitional males (Tr), orange for sneaker males (Sn), and red for females (Fm).
Fig. 3 Representation of the relative contribution of enriched GO data in terms of GO classes for
each ontology, A) Biological Process, B) Cellular Component, and C) Molecular Function. Enriched GO terms were obtained for up-regulated transcripts in each phenotype and mapped to a total of 127 GO-Slim ancestor terms with CateGOrizer. For each GO class, coloured bars represent the number of enriched terms for each phenotype, with blue for nest-holder males, green for transitional males, orange for sneaker males, and red for females. Within each ontology, the heatmap clustering represents the semantic similarity scores for enriched GO terms among phenotypes computed using GOSemSim. Values range between 0 and 1, with higher values indicating greater similarity between groups of GO terms. (*) Complete term for GO class is ‘nucleobase, nucleoside, nucleotide and nucleic acid metabolism’.
Fig. 4 Representation of the relative contribution of enriched GO data in terms of GO classes for
each ontology, A) Biological Process, B) Cellular Component, and C) Molecular Function. Enriched GO terms were obtained for down-regulated transcripts in each phenotype and mapped to a total of
Accepted
Article
127 GO-Slim ancestor terms with CateGOrizer. For each GO class, coloured bars represent the number of enriched terms for each phenotype, with blue for nest-holder males, green for transitional males, orange for sneaker males, and red for females. Within each ontology, the heatmap clustering represents the semantic similarity scores for enriched GO terms among phenotypes computed using GOSemSim. Values range between 0 and 1, with higher values indicating greater similarity between groups of GO terms. (*) Complete term for GO class is ‘nucleobase, nucleoside, nucleotide and nucleic acid metabolism’.
Fig. 5 Expression patterns for sex-biased transcripts. Nest-holder-biased (N = 84) and female-biased
(N = 71) transcripts in females (Fm, coloured in red), sneaker males (Sn, coloured in orange),
transitional males (Tr, coloured in green), and nest-holder males (NH, coloured in blue) represented as average log2 variance stabilized transformed expression values, A) notched boxplot, excluding outliers, with asterisks indicating significant P-values calculated by the Kruskal-Wallis test, followed by Nemenyi post-hoc test to perform multiple comparisons among male morphs (** P < 0.01, **** P < 0.0001), and B) hierarchical clustering of the four phenotypes with respective bootstrap values.
Supporting Information
Fig. S1 Data analysis workflow outline.
Fig. S2 Boxplots of the shifted logarithm of raw and normalized counts (columns), for each FPKM
threshold (rows) tested in this study to remove low-level expression noise.
Fig. S3 Summary of network indices, A) signed R-square for scale-free topology model fit, and B)
mean connectivity, in function of the soft thresholding power.
Fig. S4 Heatmap showing the association between identified WGCNA transcript modules (rows) and
each phenotype (columns). From the 171 identified modules, three modules remained significantly associated with a specific phenotype, after correcting the P-value for multiple comparisons (*).
Fig. S5 Plots representing the correlation between gene significance for the phenotype and module
membership (left), with respective correlations and P-values, and expression values of the module eigengene for each sample sequenced (right), for A) plum3 module in nest-holder males, B) sienna3 and C) salmon modules in sneaker males.
Accepted
Article
Table S1 Sample-wise numbers of raw and filtered reads are shown.
Table S2 Summary of transcriptome and mapped read details when considering different FPKM
thresholds for the assembled transcripts.
Table S3 Principal Component Analysis (PCA) loadings for the first three components of each
sequenced sample.
Tables S4 List of differentially expressed contigs between nest-holder males and females of Salaria
pavo.
Tables S5 List of differentially expressed contigs between nest-holder males and sneaker males of
Salaria pavo.
Tables S6 List of differentially expressed contigs between nest-holder males and transitional males
of Salaria pavo.
Tables S7 List of differentially expressed contigs between females and sneaker males of Salaria pavo. Tables S8 List of differentially expressed contigs between females and transitional males of Salaria
pavo.
Tables S9 List of differentially expressed contigs between sneaker males and transitional males of
Salaria pavo.
Table S10 Gene ontology enrichment for transcripts up-regulated in each phenotype across pairwise
comparisons.
Table S11 Gene ontology enrichment for transcripts down-regulated in each phenotype across
pairwise comparisons.
Table S12 List of female-biased transcripts up-regulated in sneaker males relative to nest-holder
males (N = 37). Direction of expression of these transcripts in transitional males is specified, either being up-regulated or not statistically significant (n.s.).
Table S13 Gene ontology enrichment for shared expression of female-biased transcripts.
Table S14 List of nest-holder-biased transcripts either exclusive to nest-holder males (N = 19) or also